. 2024 Feb 9;15(1):1244.
doi: 10.1038/s41467-024-45221-2.

CAR-T cell therapy targeting surface expression of TYRP1 to treat cutaneous and rare melanoma subtypes

Affiliations

CAR-T cell therapy targeting surface expression of TYRP1 to treat cutaneous and rare melanoma subtypes

Sameeha Jilani et al. Nat Commun. .

Abstract

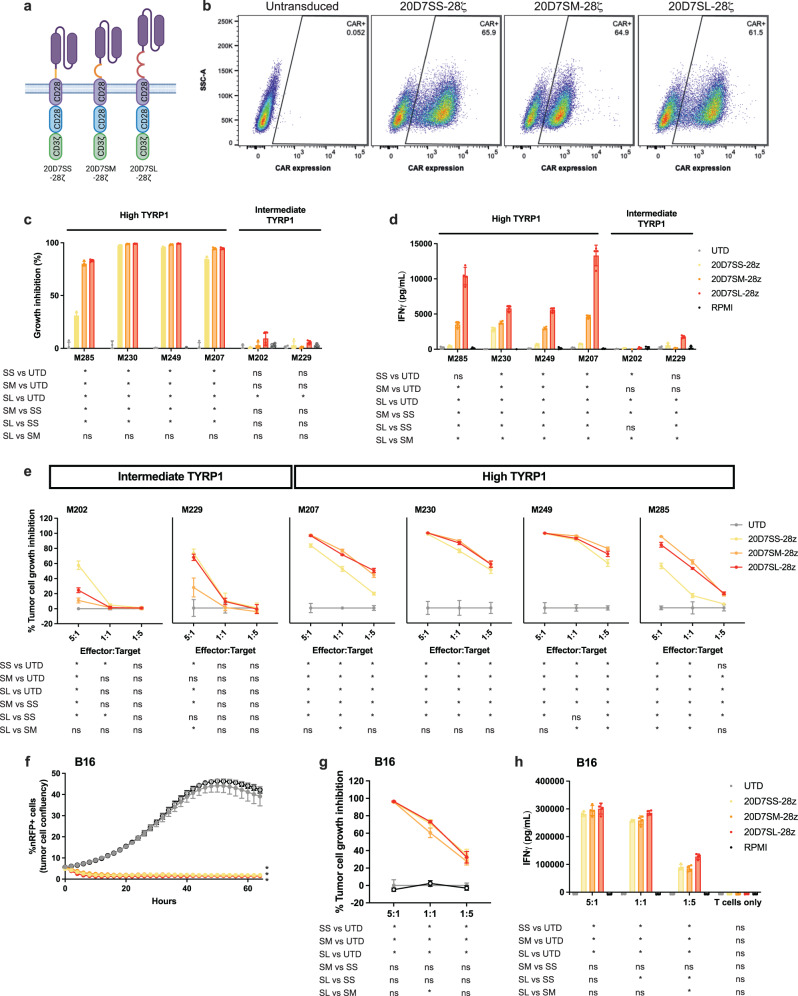
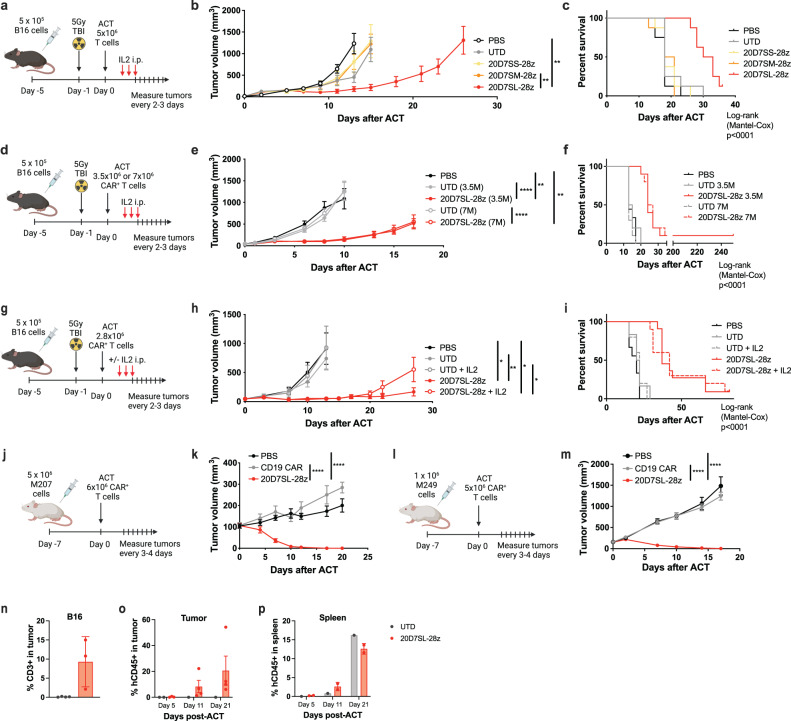
A major limitation to developing chimeric antigen receptor (CAR)-T cell therapies for solid tumors is identifying surface proteins highly expressed in tumors but not in normal tissues. Here, we identify Tyrosinase Related Protein 1 (TYRP1) as a CAR-T cell therapy target to treat patients with cutaneous and rare melanoma subtypes unresponsive to immune checkpoint blockade. TYRP1 is primarily located intracellularly in the melanosomes, with a small fraction being trafficked to the cell surface via vesicular transport. We develop a highly sensitive CAR-T cell therapy that detects surface TYRP1 in tumor cells with high TYRP1 overexpression and presents antitumor activity in vitro and in vivo in murine and patient-derived cutaneous, acral and uveal melanoma models. Furthermore, no systemic or off-tumor severe toxicities are observed in an immunocompetent murine model. The efficacy and safety profile of the TYRP1 CAR-T cell therapy supports the ongoing preparation of a phase I clinical trial.


Conflict of interest statement

A.R. has received honoraria from consulting with Amgen, Bristol-Myers Squibb, Chugai, Dynavax, Genentech, Merck, Nektar, Novartis, Roche, and Sanofi, is or has been a member of the scientific advisory board and holds stock in Advaxis, Arcus Biosciences, Bioncotech Therapeutics, Compugen, CytomX, Five Prime, RAPT, ImaginAb, Isoplexis, Kite-Gilead, Lutris Pharma, Merus, PACT Pharma, Rgenix and Tango Therapeutics. A.R. is a co-founder of PACT Pharma, a member of the Board of Directors, and holds founder stock. Y.Y.C., A.R., and C.P.-S. are founders of, hold equity in, are members of the Scientific Advisory Board, and receive consulting fees from ImmPACT Bio. Y.Y.C. is a member of the scientific advisory board and holds equity in Catamaran Bio, Notch Therapeutics, Pluto Immunotherapeutics, Prime Medicine, Sonoma Biotherapeutics, and Waypoint Bio. She has consulted for Novartis and Gritstone Bio.

UCLA has filed Patent applications on aspects of the described work, entitled “Chimeric Antigen Receptors and Related Methods and Compositions for the Treatment of Cancer” (WO2021046432A1). No potential competing interests were disclosed by the other authors.

Figures

Fig. 1
Fig. 1. Surface expression of TYRP1 is a relevant target for CAR-T cell therapy for patients with melanoma.
a TYRP1 expression in melanoma biopsies combining the TCGA melanoma (n = 472), the CheckMate038 (n = 191), and the Keynote-001 (n = 60) clinical trial datasets (n = 723). Expression measured by RNAseq. Black line positive TYRP1 expression (≥1 Log2 FPKM). Red line high TYRP1 expression (≥7 Log2 FPKM). b TYRP1 Log2 FPKMs of paired baseline and on-treatment biopsies from the CheckMate 038 clinical trial were classified based on clinical response as responders (n = 20), stable disease (n = 17), and non-responders (n = 30). Responders defined as CR and PR and non-responders are defined as PD. Two-sided, paired t test p values are shown. Data is presented in Boxplot format where the center is the median and top and bottom bounds represent 75th and 25th percentile, respectively. c Histogram showing the number of patients with negative (≤1 Log2 FPKM), intermediate, and high (≥7 Log2 FPKM) TYRP1 expression in on-treatment samples after receiving ICB (CheckMate 038 clinical trial) classified based on response. SD are excluded from this analysis, R and NR patients as in (b). d–f TYRP1 expression in acral (d, n = 12), mucosal (e, n = 20), and uveal melanoma (f, n = 12). Same dataset and cutoff as (a). g TYRP1 expression measured by immunohistochemistry stain in metastatic lesions of cutaneous, acral, mucosal, and uveal melanoma. Scale bar equal to 2 mm. One representative image of cutaneous (n = 11), acral (n = 10), mucosal (n = 6), and uveal (n = 11) melanoma is shown. h TYRP1 score in metastatic lesion from patients with cutaneous (n = 11), acral (n = 10), mucosal (n = 6), and uveal (n = 11) melanoma. The solid and dashed black lines indicate 50% and 65% of the total tumor cells with 3 + TYRP1 stain, respectively. i TYRP1 expression in a panel of 54 patient-derived melanoma cell lines. Expression measured by RNAseq. Same cutoff as (a). Red arrows indicate cell lines used in subsequent experiments. j Expression of surface and internalized TYRP1 after 16 h culture with the TYRP1 antibody (red) compared to the isotype control (gray) in cell lines with high (≥7 Log2 FPKM), intermediate (≥1 Log2 FPKM) and negative (<1 Log2 FPKM) TYRP1 RNA levels. One representative sample of three replicates is shown. Total (k), surface only (l), and surface/internalized over a 16 h period (m) TYRP1 expression normalized by the isotype control in the same cell lines (mean ± SD, n = 3 independent samples). n Expression of surface/internalized TYRP1 after 16 h culture with the TYRP1 antibody (red) compared to the isotype control (gray) in B16 cells. One representative sample of three replicates is shown. FPKM Fragments Per Kilobase of transcript per Million mapped reads. CR complete response, PR partial response, PD progressive disease, SD stable disease. Source data and exact p values are provided as a Source Data file.
Fig. 2
Fig. 2. TYRP1 CAR-T cell therapy optimized to detect the low levels of TYRP1 on the cell surface leads to cytotoxicity and cytokine release against patient-derived and murine melanoma models.
a Schematics of the 20D7SS-28ζ, 20D7SM-28ζ, and the 20D7SL-28ζ CAR-T cells. Graphical depictions were created with BioRender.com. b Human primary T cells transduced with the TYRP1 CARs. Representative flow cytometry plots showing CAR expression on the cell surface. CAR expression was detected with the Kip-1 anti-whitlow linker antibody. Representative flow cytometry showing transduction efficiency of one experiment out of two experiments performed using these constructs. c, d Co-culture of 20D7SS-28ζ, 20D7SM-28ζ, and the 20D7SL-28ζ with a panel of TYRP1high and TYRP1intermediate patient-derived cell lines. Mean ± SD (n = 4, independent co-cultures) are plotted. c Percentage of tumor cell growth inhibition normalized by the growth of the cell lines co-cultured with untransduced T cells at 96 h after co-culture at a 1:1 effector to target (E:T) ratio. d IFNγ released at 24 h after co-culture measured by ELISA (5:1, E:T ratio). e Cytotoxicity dose–response curves of 20D7SS-28ζ, 20D7SM-28ζ, and the 20D7SL-28ζ CAR-T cells upon 48 h co-culture with a panel of TYRP1high and TYRP1intermediate melanoma cell lines. Percentage of tumor cell growth inhibition normalized by the untransduced T cells control. Mean ± SD (n = 4, independent co-cultures) are plotted. f–h Antitumor activity of the 20D7SS-28ζ, 20D7SM-28ζ, and the 20D7SL-28ζ murine CAR-T cells upon co-culture with the B16 murine melanoma cell line. Untransduced murine T cells, or media alone are used as negative controls. Mean ± SD (n = 4, independent co-cultures) are plotted. f Time-course of B16 murine melanoma tumor cell growth and inhibition (5:1 E:T). g Cytotoxicity dose-response curves at 48 h after co-culture. h Dose–response IFNγ release at 24 h after co-culture. Cytokine secretion of T cells alone without stimulation is shown as a negative control. *p < 0.05 unpaired, two-tailed t test with Holm-Sidak adjustment for multiple comparisons. Source data and exact p values are provided as a Source Data file.
Fig. 3
Fig. 3. TYRP1 CAR with a long flexible hinge exhibits superior tumor control in TYRP1high syngeneic and patient-derived melanoma models.
a, d, g, j, l Schematics of the in vivo mouse studies indicating the timeline, tumor cell and CAR-T cell doses, and irradiation and IL-2 doses and timelines if applicable. Graphical depictions were created with BioRender.com. b, e, h, k, m Kinetic of tumor growth or regression over time after treatment with 20D7S-derived CAR-T cells alone or in combination with IL-2. Untransduced T cells or CD19 CAR-T cells and vehicle were used as controls. Mean ± SEM are plotted (b: n = 8, e: n = 10, h: n = 10 for 20D7SL and 20D7SL + IL2, n = 6 for UTD, n = 5 for UTD + IL2, n = 9 for PBS, k: n = 10, m: n = 10). * p < 0.05, ** p < 0.005, **** p < 0.0005 unpaired, two-tailed t test with Holm-Sidak adjustment for multiple comparisons. c, f, i Kaplan-Meier survival curves. Survival differences are statistically significant. Log-rank (Mantel-Cox) p < 0.0001. n Percentage of CD3+ cells from single cells in B16 tumors treated with 20D7SL-28z or untransduced CAR-T cells on Day 13 after ACT. Mean ± SEM is plotted (n = 4 for UTD, n = 3 for 20D7SL-28z). Percentage of CD45+ from single cells in tumors (o) and spleens (p) of M207-bearing mice treated with 20D7SL-28z or untransduced CAR-T cells at day 5, 11, and 21 after ACT. Mean ± SEM are plotted (in (o), n = 2 for UTD day 5, n = 1 for UTD days 11 and 21, n = 3 for 20D7SL-28z day 5 and n = 4 for 20D7SL-28z days 11 and 21. In (p), n = 1 for UTD and n = 2 for 20D7SL-28z at all time points). Source data and exact p values are provided as a Source Data file.
Fig. 4
Fig. 4. CD28 outperforms 4-1BB as the costimulatory signal for the 20D7SL CAR, leading to antitumor activity in a larger tumor panel.
a Schematics of the 20D7SL-28ζ and the 20D7SL-BBζ CAR-T cells. Graphical depictions were created with BioRender.com. b IFNγ measured by ELISA 24 h after co-culture 20D7SL-28ζ and 20D7SL-BBζ CAR-T cells with a panel of TYRPhigh patient-derived melanoma cells (5:1, E:T ratio). Untransduced T cells (UTD) were used as a negative control. Mean ± SD are plotted (n = 4, independent co-cultures). *p < 0.05 20D7SL-28z vs UTD, #p < 0.05 20D7SL-28z vs 20D7SL-BBζ, unpaired, two-tailed t test with Holm-Sidak adjustment for multiple comparisons. Percentage of tumor cell confluency over time upon co-culture of 20D7SL-28ζ and 20D7SL-BBζ CAR-T cells with ten consecutive antigen challenges with M230 (c) or M249 (d) melanoma cells. Untransduced T cells (UTD) and media alone were used as a negative control during the first two challenges. Mean ± SD are plotted (n = 4, independent co-cultures). The green arrow in the x-axis marks each challenge. Kinetic of tumor growth or regression over time after treatment with 20D7SL-28ζ and the 20D7SL-BBζ CAR-T cells in NSG mice bearing M230 (e) and M249 (f) subcutaneous tumors. Untransduced T cells and PBS were used as controls. Tumor size was measured with a caliper. Mean ± SEM are plotted (e: n = 10 mice for PBS and 20D7SL-BBz, n = 2 for UTD, n = 8 for 20D7SL-28z; f n = 8 for PBS and 20D7SL-28z, n = 10 for UTD and 20D7SL-BBz). Representative of two independent experiments. *p < 0.05, **p < 0.005, ****p < 0.0005 unpaired, two-tailed t test with Holm-Sidak adjustment for multiple comparisons. Source data and exact p values are provided as a Source Data file.
Fig. 5
Fig. 5. 20D7SL-28ζ and 20D7SL-BBζ CAR-T cells specifically recognize TYRP1.
a, b Co-culture of 20D7SL-28ζ and 20D7SL-BBζ with a panel of patient-derived TYRP1high cell lines and their TYRP1-knock out counterpart. Mean ± SD (n = 4, independent co-cultures) are plotted. *p < 0.05 vs untransduced T cells, unpaired, two-tailed t test with Holm-Sidak adjustment for multiple comparisons. a Percentage of tumor cell growth inhibition normalized by the growth of the cell lines co-cultured with untransduced T cells at 96 h after co-culture (1:1, E:T ratio). b IFNγ released at 24 h after co-culture measured by ELISA (5:1 and 1:1, E:T ratio). c Cytotoxicity dose–response curves of 20D7SL-28ζ and 20D7SL-BBζ CAR-T cells upon 48 h co-culture with a panel of TYRP1high melanoma cell lines and their TYRP1-knock out counterparts. Percentage of tumor cell growth inhibition normalized by the untransduced T cells control. Mean ± SD (n = 4, independent co-cultures) are plotted. *p < 0.05, unpaired, two-tailed t test with Holm-Sidak adjustment for multiple comparisons. d, e Co-culture of 20D7SL-28ζ and 20D7SL-BBζ with a panel of a patient-derived TYRP1high cell line (M230) and non-melanoma cell lines. Mean ± SD (n = 4, independent co-cultures) are plotted. *p < 0.05 vs untransduced T cells, unpaired, two-tailed t test with Holm-Sidak adjustment for multiple comparisons. d IFNγ released at 24 h after co-culture measured by ELISA (5:1, E:T ratio). e Cytotoxicity time-course (5:1, E:T). Source data and exact p values are provided as a Source Data file.
Fig. 6
Fig. 6. 20D7SL-28ζ CAR-T cells exert strong tumor control and lack toxicity in the immunocompetent B16 melanoma model.
a Kinetic of tumor growth or regression over time after treatment with 20D7SL-28ζ CAR-T cells. Tumor size was measured with a caliper. Mean ± SEM is plotted (n = 10 mice for untreated, n = 11 mice for UTD and 20D7SL-28z). ****p < 0.0005 vs Untreated, ####p < 0.0005 vs UTD, unpaired, two-tailed t test with Holm-Sidak adjustment for multiple comparisons. Retrovirus vector copy number in the tumor (b) and the spleen (c) of mice treated with 20D7SL-28ζ CAR-T cell therapy at days 5, 13, and 27 after adoptive T-cell transfer. Mean ± SD is plotted (n = 10 mice). Complete blood counts at days 5, 13, and 27 after adoptive T-cell transfer with 20D7SL-28ζ CAR-T cells. White blood cells (d), hemoglobin (e), hematocrit (f), and Platelets (g) are shown. Mean ± SD are plotted, each dot is one mouse (df) Untreated n = 9 for Day 6 and n = 10 for Day 13, UTD n = 8 for Day 6 and n = 10 for Day 13, 20D7SL-28z n = 8 for Day 6, n = 6 for Day 13 and n = 7 for Day 27; (g) Untreated n = 8 for Day 6 and n = 9 for Day 13, UTD n = 8 for Day 6 and n = 9 for Day 13, 20D7SL-28z n = 6 for Day 6, n = 2 for Day 13 and n = 6 for Day 27). Serum chemistry at day 13, after adoptive T-cell transfer with 20D7SL-28ζ CAR-T cells. Mice with tumors treated with untransduced T cells and vehicle were used as controls. Untreated mice without tumors and mice without tumors receiving irradiation only were used as additional controls. Alkaline phosphatase (h), Alanine aminotransferase (i), aspartate aminotransferase (j), and total bilirubin (k) are shown. Mean ± SD is plotted (n = 5 mice). Cytokine release in serum at days 5, 13, and 27 after adoptive T-cell transfer with 20D7SL-28ζ CAR-T cells. IL-6 (l), IFNγ (m), and IL-10 (n) are shown. Mean ± SD are plotted, each dot is one mouse (ln) Untreated n = 7 for Day 5 and n = 9 for Day 13, UTD n = 7 for Day 6 and n = 10 for Day 13, 20D7SL-28z n = 7 for Day 6, n = 6 for Day 13 and n = 10 for Day 27). Black dashed line shows the minimum quantifiable levels using the BD CBA Mouse Inflammation Kit (20 pg/mL). o, p Quantitative measures of the average ONL thickness were taken at 0.2 mm intervals in frames (−10 to 10) to the optic nerve. Mean ± SEM is plotted (n = 4 mice). q Quantitative TYRP1 pixel intensity in the RPE cells from mice at day 13 and 27 after receiving ACT with untransduced T cells or 20D7SL-28ζ CAR-T cells. Mean ± SD is plotted (n = 4 mice, three sections of the retina per mouse). *p < 0.05, **p < 0.005, ***p < 0.001, ****p < 0.0005 unpaired, two-tailed t test with Holm-Sidak adjustment for multiple comparisons. Unless otherwise indicated, differences are not statistically significant. Unless otherwise indicated, untransduced T cells and PBS were used as controls. Source data and exact p values are provided as a Source Data file.
Fig. 7
Fig. 7. 20D7SL-28ζ CAR-T cell therapy is effective at treating acral and uveal melanoma.
a, d TYRP1 RNA expression measured by qPCR in a panel of uveal melanoma (a) and acral melanoma (d) cell lines. M249 TYRP1high and M202 and M229 TYRP1intermediate cutaneous melanoma cell lines were used as controls. A549 lung adenocarcinoma cell line was used as negative control. ΔCt is normalized by the Ct of the negative control cell line (n = 3 technical replicates, mean ± SD are plotted). b, c Antitumor activity of the 20D7SL-28ζ CAR-T cells upon co-culture with a panel of uveal melanoma cell lines at different E:T ratios (10:1, 5:1, and 1:1). b Time-course of uveal melanoma tumor cell growth and growth inhibition. Mean ± SD (n = 3 in all conditions except UTD 10:1 in MP41, which is n = 2, independent co-cultures) are plotted. c T-cell activation measured by the percentage of CD8+ T cells overexpressing 4-1BB and CD4+ T cells overexpressing OX-40. Mean (n = 2, independent co-cultures) is plotted. e, f Antitumor activity of the 20D7SL-28ζ CAR-T cells upon co-culture with a panel of acral melanoma cell lines at different E:T ratios. (10:1, 5:1, and 1:1) Mean ± SD are plotted (n = 3, independent co-cultures). e Time-course of acral melanoma tumor cell growth and growth inhibition. f T-cell activation was measured by the percentage of CD8+ T cells overexpressing 4-1BB and CD4+ T cells overexpressing OX-40. *p < 0.05 vs untransduced, unpaired, two-tailed t test with Holm-Sidak adjustment for multiple comparisons. g–i Antitumor activity of the 20D7SL-28ζ CAR-T cells (derived from CD14CD25CD62L+ T cells) in vivo in patient-derived models of uveal and acral melanoma in immunodeficient mice. Kinetic of tumor growth or regression over time after treatment with 20D7SL-28ζ CAR-T cells. Tumor size was measured with a caliper. Mean ± SEM are plotted (n = 10 for all conditions except H untreated -n = 9- and I untreated -n = 8-)., ****p < 0.0005 vs untreated, ### p < 0.001, #### p < 0.0005 vs untransduced T cells. Unpaired, two-tailed t test with Holm-Sidak adjustment for multiple comparisons. Unless otherwise indicated, untransduced T cells and PBS were used as controls. Source data and exact p values are provided as a Source Data file. Tables with titles and legends: NA.

References

    1. Larkin J, et al. Combined nivolumab and ipilimumab or monotherapy in untreated melanoma. N. Engl. J. Med. 2015;373:23–34. doi: 10.1056/NEJMoa1504030. - DOI - PMC - PubMed
    1. Larkin J, et al. Five-year survival with combined nivolumab and ipilimumab in advanced melanoma. N. Engl. J. Med. 2019;381:1535–1546. doi: 10.1056/NEJMoa1910836. - DOI - PubMed
    1. Wolchok JD, et al. Overall survival with combined nivolumab and ipilimumab in advanced melanoma. N. Engl. J. Med. 2017;377:1345–1356. doi: 10.1056/NEJMoa1709684. - DOI - PMC - PubMed
    1. Schachter J, et al. Pembrolizumab versus ipilimumab for advanced melanoma: final overall survival results of a multicentre, randomised, open-label phase 3 study (KEYNOTE-006). Lancet. 2017;390:1853–1862. doi: 10.1016/S0140-6736(17)31601-X. - DOI - PubMed
    1. Sharma P, Hu-Lieskovan S, Wargo JA, Ribas A. Primary, adaptive, and acquired resistance to cancer immunotherapy. Cell. 2017;168:707–723. doi: 10.1016/j.cell.2017.01.017. - DOI - PMC - PubMed