. 2024 Mar;43(6):904-930.
doi: 10.1038/s44318-024-00044-1. Epub 2024 Feb 9.

Mitochondrial outer membrane integrity regulates a ubiquitin-dependent and NF-κB-mediated inflammatory response

Affiliations

Mitochondrial outer membrane integrity regulates a ubiquitin-dependent and NF-κB-mediated inflammatory response

Esmee Vringer et al. EMBO J. 2024 Mar.

Abstract

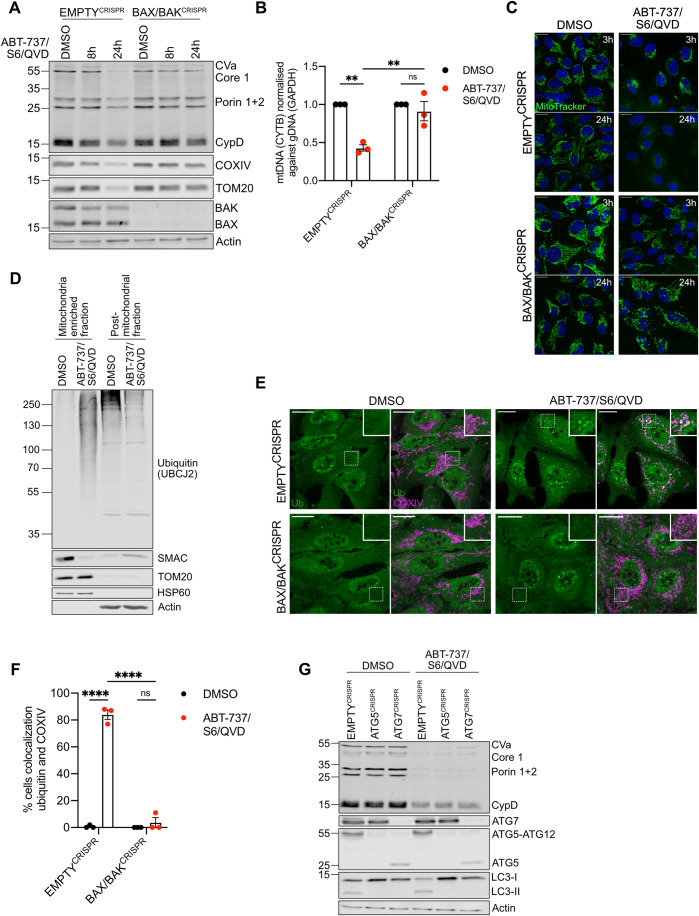
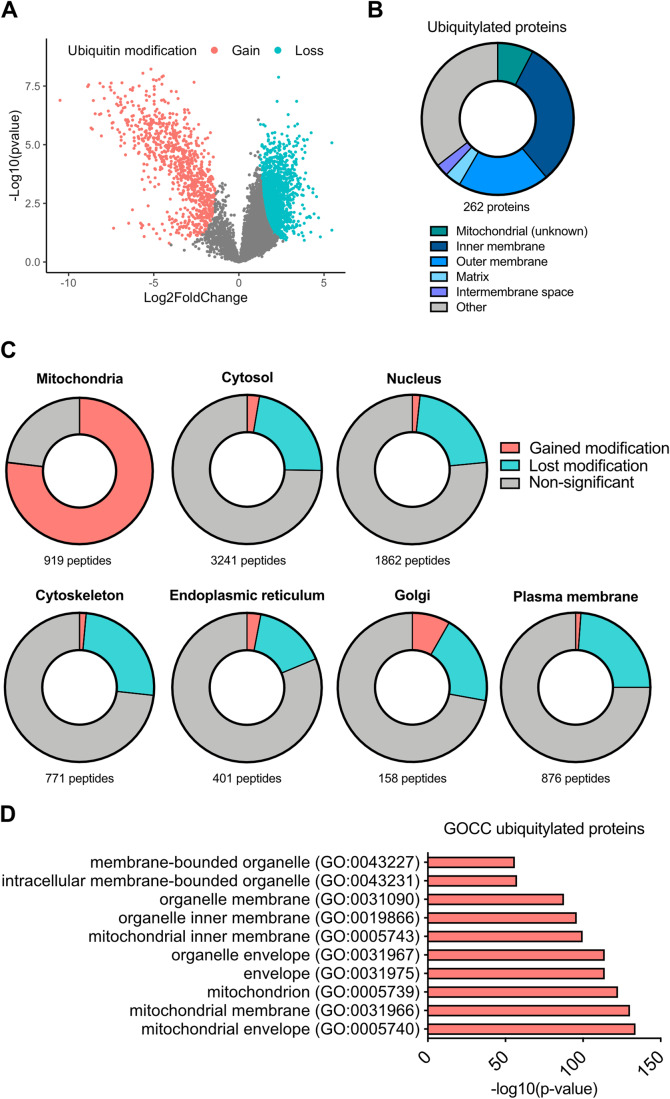
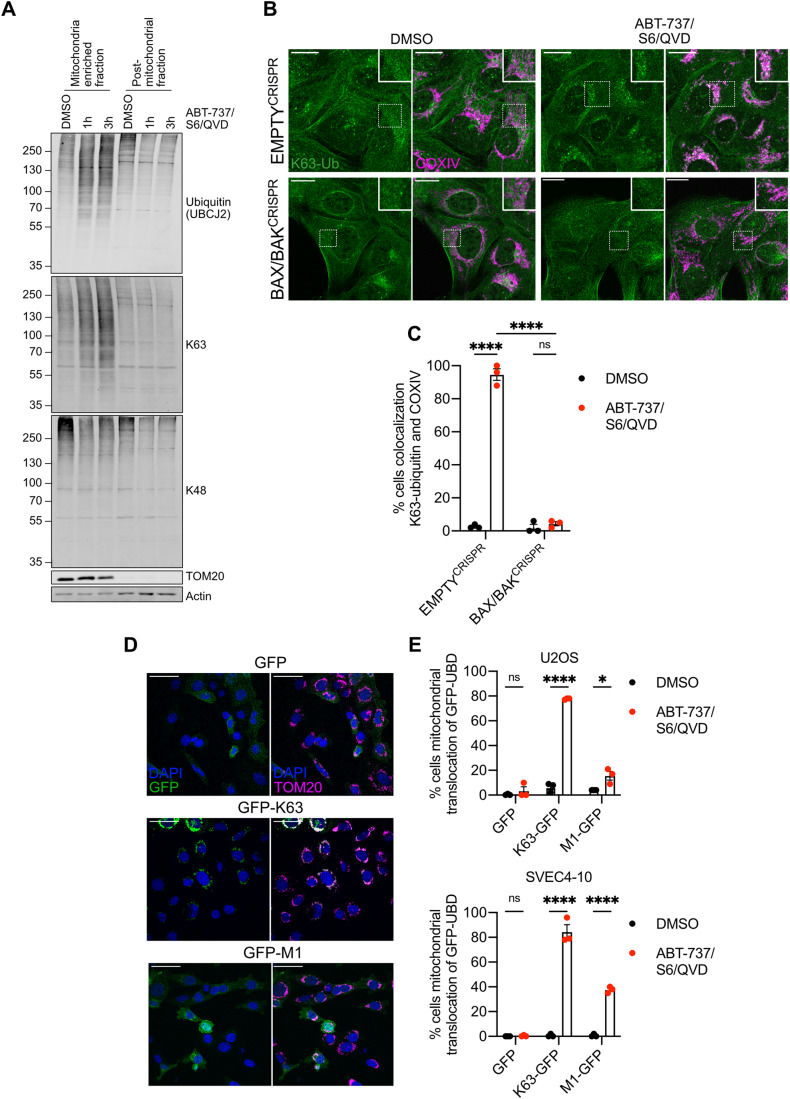
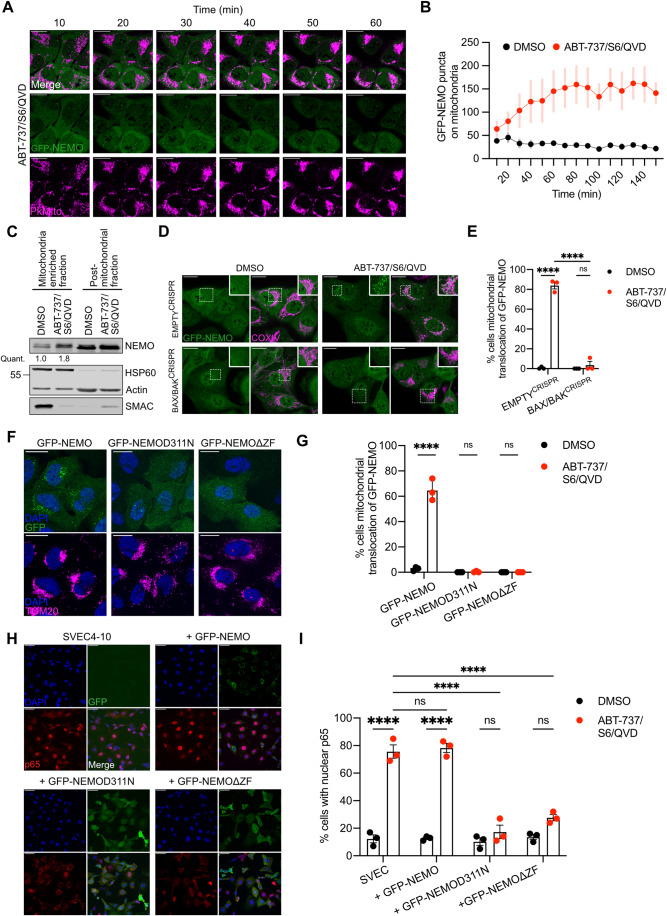
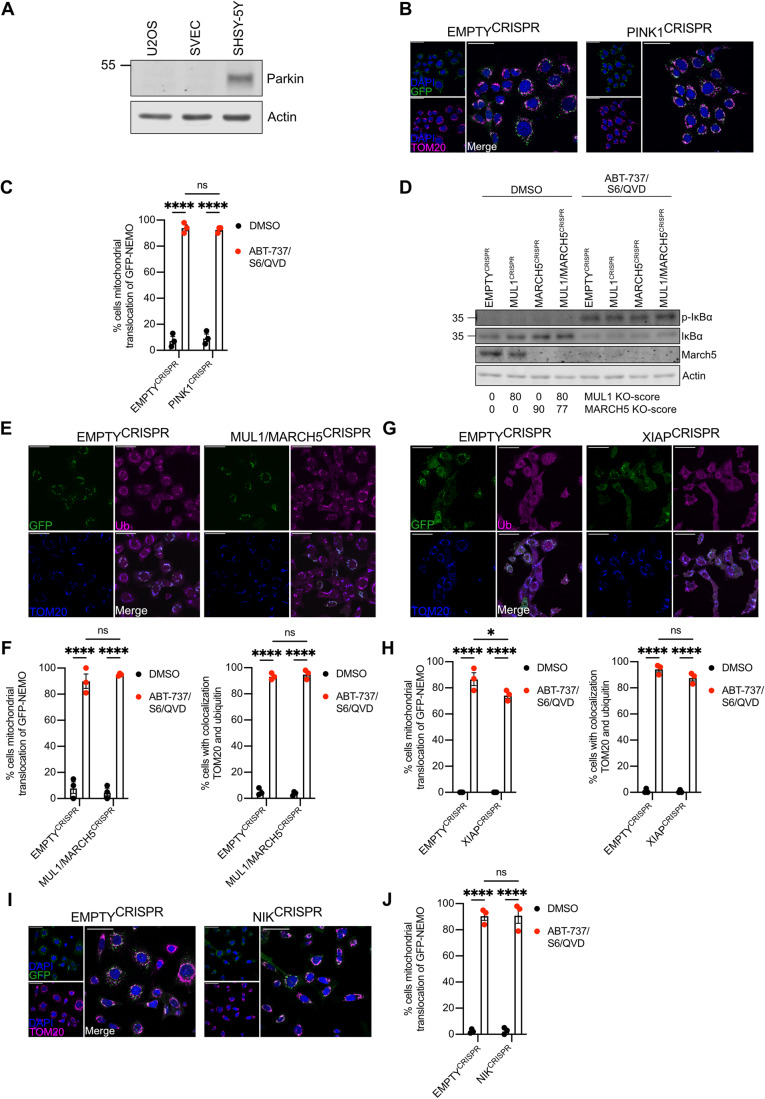
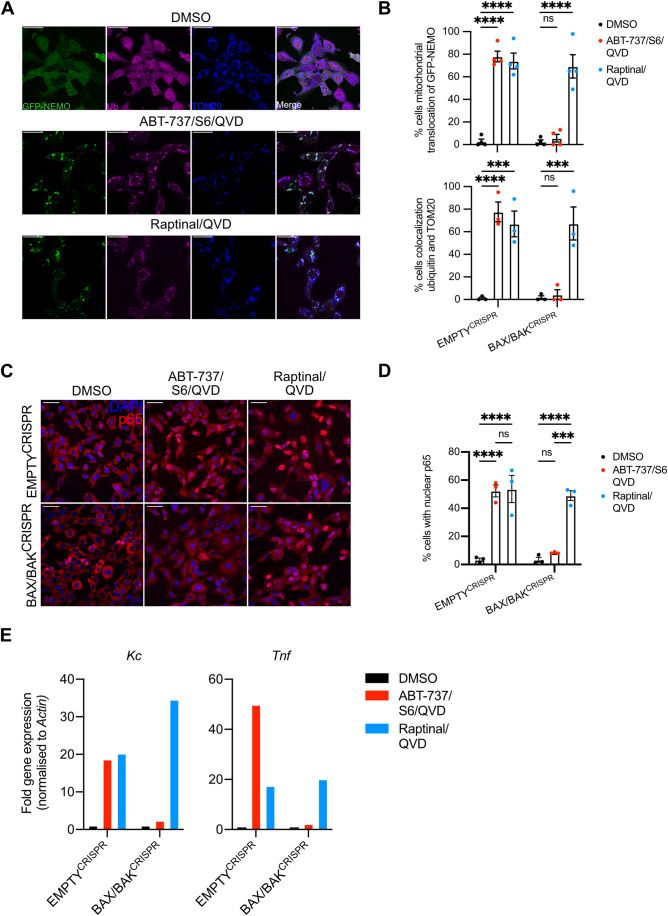
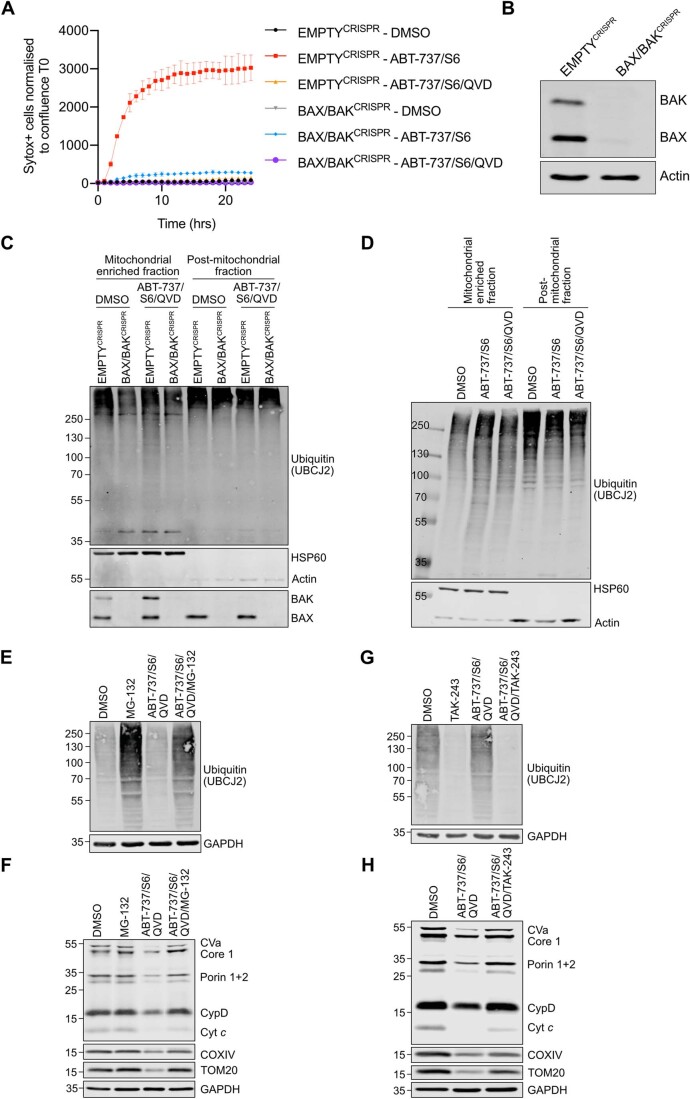
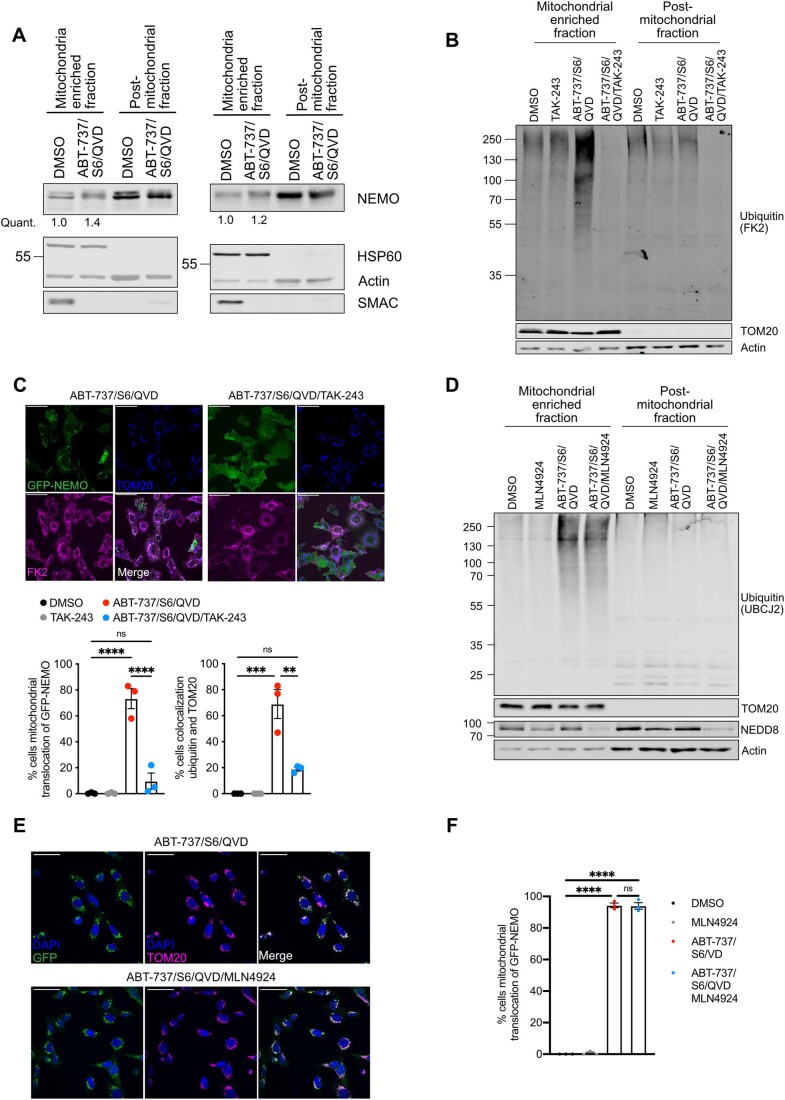
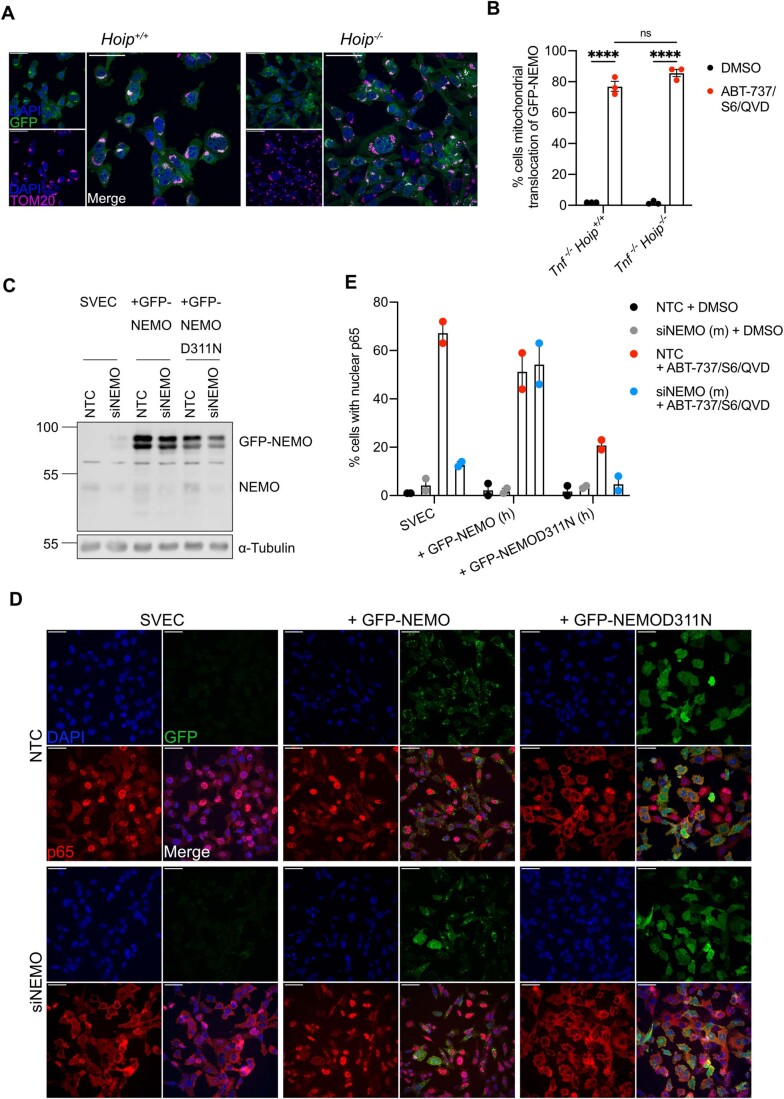
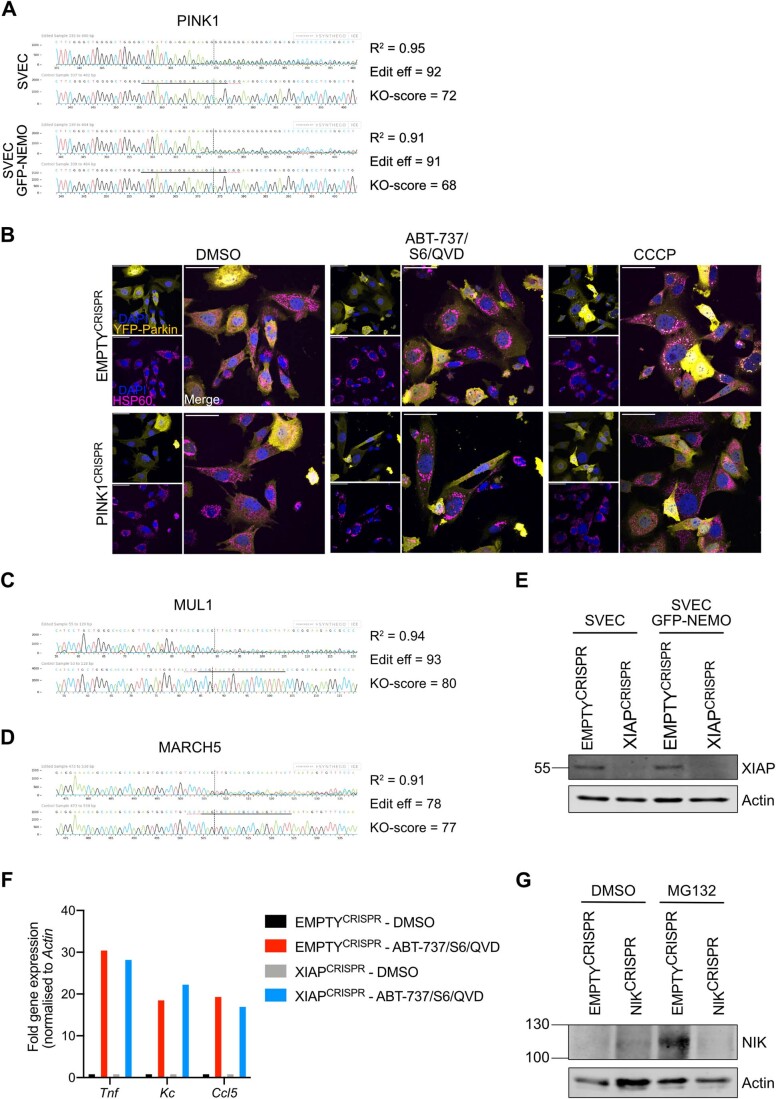
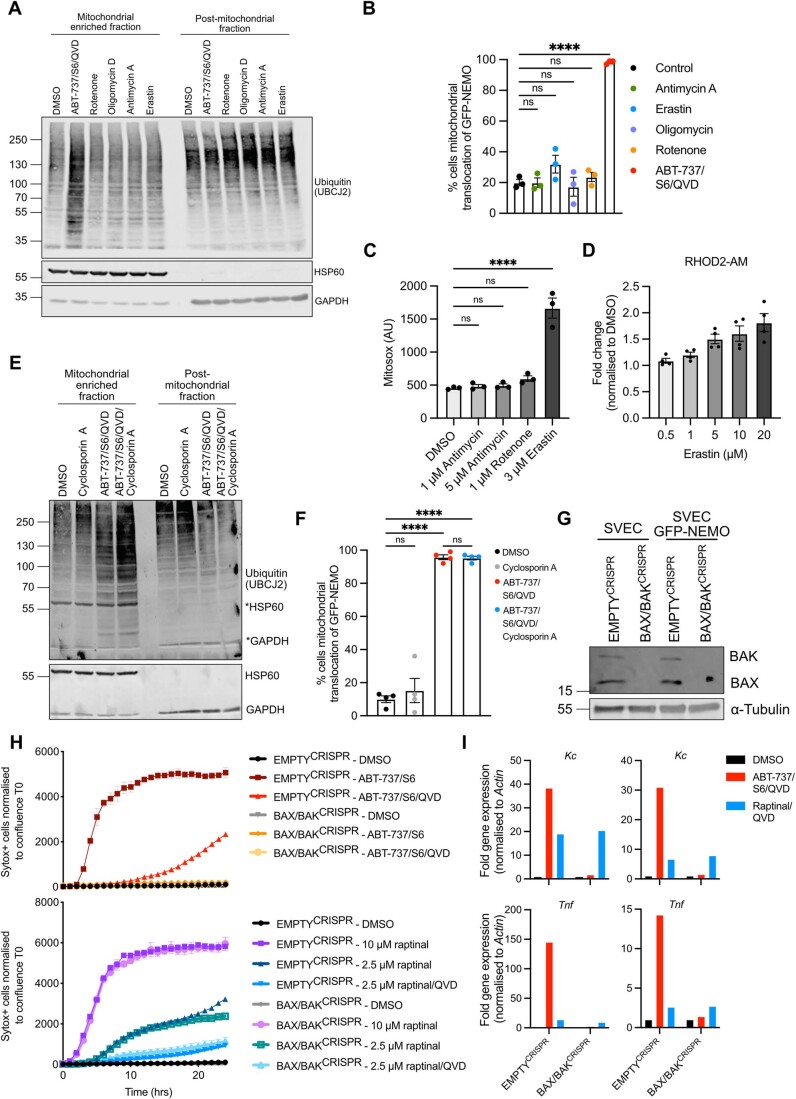
Mitochondrial outer membrane permeabilisation (MOMP) is often essential for apoptosis, by enabling cytochrome c release that leads to caspase activation and rapid cell death. Recently, MOMP has been shown to be inherently pro-inflammatory with emerging cellular roles, including its ability to elicit anti-tumour immunity. Nonetheless, how MOMP triggers inflammation and how the cell regulates this remains poorly defined. We find that upon MOMP, many proteins localised either to inner or outer mitochondrial membranes are ubiquitylated in a promiscuous manner. This extensive ubiquitylation serves to recruit the essential adaptor molecule NEMO, leading to the activation of pro-inflammatory NF-κB signalling. We show that disruption of mitochondrial outer membrane integrity through different means leads to the engagement of a similar pro-inflammatory signalling platform. Therefore, mitochondrial integrity directly controls inflammation, such that permeabilised mitochondria initiate NF-κB signalling.

Keywords: Cell Death; Inflammation; Mitochondria; NF-κB; Ubiquitin.


Conflict of interest statement

SWGT consults for Exo Therapeutics. DTH consults for Triana Biomedicines. Salary support for GS was provided by a collaborative agreement with the Merck Group and Cancer Research Horizons UK. DJM has additionally received support from Puma Biotechnology and ORIC Pharmaceuticals. The remaining authors declare no competing interests.

Figures

Figure 1
Figure 1. Mitochondrial depletion after MOMP does not require autophagy.
(A) U2OS EMPTYCRISPR and BAX/BAKCRISPR cells treated with 10 μΜ ABT-737, 2 μΜ S63845 and 20 μΜ Q-VD-OPh for 8 or 24 h. Mitochondrial depletion was assessed by blotting for several mitochondrial proteins. (B) U2OS EMPTYCRISPR and BAX/BAKCRISPR cells were treated with 10 μΜ ABT-737, 2 μΜ S63845 and 20 μΜ Q-VD-OPh for 24 h. Graphs shows presence of mtDNA relative to genomic DNA in n = 3 independent experiments, error bars represent s.e.m. (C) U2OS EMPTYCRISPR and BAX/BAKCRISPR cells were treated with 10 μΜ ABT-737, 2 μΜ S63845 and 20 μΜ Q-VD-OPh for 3 or 24 h. Nuclei were stained using Hoechst, and mitochondria with Mitotracker Green. Images are representative of three independent experiments. Scale bar is 20 μm. (D) SVEC4-10 cells treated for 1 h with 10 μΜ ABT-737, 10 μΜ S63845 and 30 μΜ Q-VD-OPh. Mitochondria were isolated using Dounce homogeniser. Lysates for blotted for ubiquitin (UBCJ2), SMAC, TOM20, HSP60 and Actin. (E) U2OS EMPTYCRISPR and BAX/BAKCRISPR cells treated for 3 h with 10 μΜ ABT-737, 2 μΜ S63845 and 20 μΜ Q-VD-OPh. Cells were stained for ubiquitin (FK2) and mitochondrial COXIV. Images are representative of three independent experiments. Images are maximum projections of Z-stacks with a scale bar of 20 μm. (F) Quantification of (E) showing the percentage of cells with mitochondrial localised ubiquitin puncta. Graph displays mean values ± s.e.m. (error bar) of n  =  3 independent experiments. (G) U2OS EMPTYCRISPR, ATG5CRISPR and ATG7CRISPR expressing YFP-Parkin were treated with 10 μΜ ABT-737, 2 μΜ S63845 and 20 μΜ Q-VD-OPh for 24 h. Mitochondrial depletion was assessed by blotting for various mitochondrial proteins. Data information: (A,D,G) blots are representative of three independent experiments. Statistics for all experiments were performed using two-way ANOVA with Tukey correction. *P < 0.05, **P < 0.01, ****P < 0.0001. Source data are available online for this figure.
Figure 2
Figure 2. Widespread ubiquitylation of mitochondrial proteins after MOMP.
(A) Volcano plot of ubiquitylated proteins in SVEC4-10 cells treated for 3 h with 10 μΜ ABT-737, 10 μΜ S63845 and 30 μΜ Q-VD-OPh. The experiment performed with n = 4 independent repeats. Statistical analysis determining significance (coloured dots) was through using Student’s t test. Plot generated in RStudio. (B) Pie chart of ubiquitylated peptides categorised into mitochondrial compartments. Categorisation of peptides was performed using MitoCarta 3.0, UniProt and ProteinAtlas. (C) Cellular distribution of all hits from the isolated ubiquitin remnant-containing peptides. Categorisation using MitoCarta 3.0, UniProt and ProteinAtlas. (D) GO-term cellular compartment analysis of proteins with increased ubiquitylation after MOMP. Statistical analysis was performed with Fisher’s exact test with corrected with false discovery rate. Graphs shows the top ten most significant hits. Source data are available online for this figure.
Figure 3
Figure 3. K63-linked ubiquitylation on mitochondria after MOMP.
(A) SVEC4-10 cells treated with for 1 or 3 h with 10 μΜ ABT-737, 10 μΜ S63845 and 30 μΜ Q-VD-OPh. Mitochondria were isolated using digitonin fractionation buffer and antibodies against ubiquitin (UBCJ2), K63- and K48-specific ubiquitin were used. Blots representative for three independent experiments. (B) U2OS EMPTYCRISPR and BAX/BAKCRISPR cells treated with 10 μΜ ABT-737, 2 μΜ S63845 and 20 μΜ Q-VD-OPh for 3 h. Stained for K63-ubiquitin and mitochondrial COXIV. Images are maximum projections of Z-stacks with a scale bar of 20 μm and are representative of three independent experiments. (C) Quantification of (B) showing the percentage of cells with mitochondrial localised K63-ubiquitin puncta. Statistics performed using two-way ANOVA with Tukey correction. (D) SVEC4-10 cells expressing doxycycline-inducible K63 or M1-UBDs. Cells were treated for 1 h with 10 μΜ ABT-737, 10 μΜ S63845 and 30 μΜ Q-VD-OPh. Images are representative of three independent experiments with a scale bar of 50 μm. (E) Quantification of (D) showing the percentage of SVEC4-10 cells with mitochondrial localised GFP-UBDs. Also includes the quantification of U2OS cells expressing doxycycline-inducible K63- or M1-UBDs treated for 3 h with 10 μΜ ABT-737, 2 μΜ S63845 and 20 μΜ Q-VD-OPh. Statistics were performed using multiple unpaired t tests. Data information: (C, E) graphs display mean values ± s.e.m. (error bars) of n  =  3 independent experiments. **P < 0.01, ***P < 0.001. ****P < 0.0001. Source data are available online for this figure.
Figure 4
Figure 4. Ubiquitin-dependent recruitment of NEMO to mitochondria is essential for NF-κB activation after MOMP.
(A) Timelapse of U2OS cells expressing GFP-NEMO. Cells were treated with 10 μΜ ABT-737, 10 μΜ S63845 and 30 μΜ Q-VD-OPh. Mitochondria and nuclei are visualised using PkMito DeepRed and Hoechst, respectively. Cells were treated for 1 h with images taken every 10 min. Image is representative for three independent experiments. Scale bar is 20 μm. (B) U2OS cells expressing GFP-NEMO treated with treated with 10 μΜ ABT-737, 10 μΜ S63845 and 30 μΜ Q-VD-OPh were quantified for mitochondrial localised GFP-NEMO puncta over time. Puncta are calculated using ImageJ/Fiji “trainable Weka segmentation plug-in”. The graph is representative of three biological repeats and shows the mean +/− s.e.m. (error bars) of five fields of view taken over time. (C) SVEC4-10 cells treated for 3 h with 10 μΜ ABT-737, 10 μΜ S63845 and 30 μΜ Q-VD-OPh. Mitochondria were isolated using Dounce homogeniser and cellular fractions were probed with relevant antibodies. Mitochondrial localised NEMO was quantified normalising to mitochondrial content defined by HSP60 signal. (D) U2OS EMPTYCRISPR and BAX/BAKCRISPR cells expressing GFP-NEMO were treated for 3 h with 10 μΜ ABT-737, 2 μΜ S63845 and 20 μΜ Q-VD-OPh. Cells were immunostained for mitochondrial COXIV. Scale bar is 20 μm. Images are maximum projections of Z-stacks and are representative for three independent experiments. (E) Quantification of (D) showing the percentage of cells with mitochondrial localised GFP-NEMO puncta. (F) U2OS cells expressing GFP-NEMO, GFP-NEMOD311N or GFP-NEMOΔZF were treated for 3 h with 10 μΜ ABT-737, 2 μΜ S63845 and 20 μΜ Q-VD-OPh. Cells were immunostained for mitochondrial TOM20 and DAPI. Scale bar is 20 μm and images are representative for three independent experiments. (G) Quantification of (F) showing the percentage of cells with mitochondrial translocation of GFP-NEMO. (H) Parental SVEC4-10 cells and SVEC4-10 cells expressing GFP-NEMO, GFP-NEMOD311N or GFP-NEMOΔZF were treated for 1 h with 10 μΜ ABT-737, 10 μΜ S63845 and 30 μΜ Q-VD-OPh. Cells were immunostained for p65 and DAPI. Scale bar is 50 μm and images are representative for three independent experiments. (I) Quantification of (H) showing the GFP+ cells with nuclear translocation of p65. Data information: (E, G, I) graphs display mean values ± s.e.m. (error bars) of n  =  3 independent experiments. Statistics are performed using two-way ANOVA with Tukey correction. **P < 0.01, ***P < 0.001. ****P < 0.0001. Source data are available online for this figure.
Figure 5
Figure 5. Ubiquitylation-induced inflammation after MOMP is independent of established mitochondrial E3 ligases.
(A) Lysates of U2OS, SVEC4-10 and SHSHY-5Y cells were blotted for Parkin and Actin. (B) SVEC4-10 EMPTYCRISPR and PINK1CRISPR cells expressing GFP-NEMO were treated for 1 h with 10 μΜ ABT-737, 10 μΜ S63845 and 30 μΜ Q-VD-OPh. Cells were immunostained for mitochondrial TOM20 and DAPI. Images are representative for three independent experiments with a scale bar of 50 μm. (C) Quantification of (B) showing the percentage of cells with mitochondrial translocation of GFP-NEMO. (D) SVEC4-10 EMPTYCRISPR, MUL1CRISPR, MARCH5CRISPR and MUL1/MARCH5CRISPR treated for 3 h with 10 μΜ ABT-737, 10 μΜ S63845 and 30 μΜ Q-VD-OPh. Lysates were blotted for p-ΙκΒα, ΙκΒα, MARCH5 and Actin. Blots are representative of three independent experiments. KO-scores of MUL1 and MARCH5 are calculated via ICE analysis. (E) SVEC4-10 EMPTYCRISPR and MUL1/MARCH5CRISPR cells expressing GFP-NEMO treated for 1 h with 10 μΜ ABT-737, 10 μΜ S63845 and 30 μΜ Q-VD-OPh. Cells were immunostained for ubiquitin (UBCJ2) and mitochondrial TOM20. Images are representative for three independent experiments with a scale bar of 50 μm. (F) Quantification of (E) showing the percentage of cells with mitochondrial localisation of GFP-NEMO and ubiquitin. (G) SVEC4-10 EMPTYCRISPR and XIAPCRISPR cells expressing GFP-NEMO were treated with 10 μΜ ABT-737, 10 μΜ S63845 and 30 μΜ Q-VD-OPh for 1 h. Cells were immunostained for ubiquitin (FK2) and mitochondrial TOM20. Images are representative for three independent experiments with a scale bar of 50 μm. (H) Quantification of (G) showing the percentage of cells with mitochondrial localisation of GFP-NEMO and ubiquitin. (I) SVEC4-10 EMPTYCRISPR and NIKCRISPR cells expressing GFP-NEMO were treated with 10 μΜ ABT-737, 10 μΜ S63845 and 30 μΜ Q-VD-OPh for 1 h. Images are immunostained with mitochondrial TOM20 and DAPI. Images are representative for three independent experiments with a scale bar of 50 μm. (J) Quantification of (I) showing the percentage of cells with mitochondrial localisation of GFP-NEMO. Data information: (C, F, H, J) graphs display mean values ± s.e.m. (error bars) of n  =  3 independent experiments. Statistics were performed using two-way ANOVA with Tukey correction. ****P < 0.0001. Source data are available online for this figure.
Figure 6
Figure 6. Mitochondrial ubiquitylation and inflammation occur upon loss of mitochondrial outer membrane integrity.
(A) SVEC4-10 cells expressing GFP-NEMO were treated for 3 h with 10 μΜ ABT-737, 10 μΜ S63845 and 30 μΜ Q-VD-OPh or 2.5 μΜ raptinal and 30 μΜ Q-VD-OPh. Cells were immunostained for ubiquitin (FK2) and mitochondrial TOM20. Images are representative of three independent experiments displayed with a 50 μm scale bar. (B) SVEC EMPTYCRISPR and BAX/BAKCRISPR cells were treated for 3 h with 10 µM ABT-737, 10 µM S63845 and 30 µM Q-VD-OPh or 2.5 µM raptinal and 30 µM Q-VD-OPh. Graphs show the percentage of cells with mitochondrial localisation of GFP-NEMO and ubiquitin. (C) SVEC4-10 EMPTYCRISPR and BAX/BAKCRISPR cells were treated for 3 h with 10 μΜ ABT-737, 10 μΜ S63845 and 30 μΜ Q-VD-OPh or 2.5 μΜ raptinal and 30 μΜ Q-VD-OPh. Cells were immunostained stained for p65 and DAPI. Images are representative of three independent experiments. Scale bar is 50 μm. (D) Quantification of (C) showing the percentage of cells with nuclear translocation of p65. (E) SVEC4-10 cells treated for 3 h with 10 μΜ ABT-737, 10 μΜ S63856 and 30 μΜ Q-VD-OPh or 2.5 μΜ raptinal and 30 μΜ Q-VD-OPh. Expression of Kc, Tnf and Actin were validated using RT-qPCR, graphs are representative for three independent experiments. Data information: (B, D) graphs display mean values ± s.e.m. (error bars) of n  =  3 independent experiments. Statistics were performed using two-way ANOVA with Dunnett correction. ****P < 0.0001. Source data are available online for this figure.
Figure EV1
Figure EV1. Ubiquitylation of mitochondria is dependent on MOMP by BAX/BAK pores, but independent of caspase activity.
(A) U2OS EMPTYCRISPR and BAX/BAKCRISPR cells were treated with 10 μΜ ABT-737, 2 μΜ S63845 with or without 20 μΜ Q-VD-OPh. Cell death was determined using Sytox Green inclusion normalised to starting confluence. Graph is representative of three independent experiments and displays mean values ± s.e.m. (error bars) of technical triplicates. (B) Lysates from U2OS EMPTYCRISPR and BAX/BAKCRISPR cells were blotted for BAX, BAK and Actin. (C) SVEC4-10 EMPTYCRISPR and BAX/BAKCRISPR cells were treated for 1 h with 10 μΜ ABT-737, 10 μΜ S63845 and 30 μΜ Q-VD-OPh. Mitochondria were isolated using digitonin fractionation buffer and blotted for ubiquitin (UBCJ2), BAX, BAK, HSP60 and Actin. (D) SVEC4-10 cells were treated for 1 h with 10 μΜ ABT-737, 10 μΜ S63845 with or without 30 μΜ Q-VD-OPh. Mitochondria were isolated using digitonin fractionation buffer and lysates were blotted for ubiquitin (UBCJ2), HSP60 and actin. (E) U2OS cells were treated for 7 h with 10 μΜ ABT-737, 2 μΜ S63845 and 20 μΜ Q-VD-OPh with or without the addition of 10 μM MG-132. Lysates were blotted for ubiquitin (UBCJ2) and GAPDH. (F) U2OS cells were treated for 24 h with 10 μΜ ABT-737, 2 μΜ S63845 and 20 μΜ Q-VD-OPh with or without the addition of 10 μM MG-132. Mitochondrial depletion was assessed by blotting for several mitochondrial proteins and GAPDH. (G) U2OS cells were treated for 7 h with 10 μΜ ABT-737, 2 μΜ S63845 and 20 μΜ Q-VD-OPh with or without the addition of 1 μΜ TAK-243. Lysates were blotted for ubiquitin (UBCJ2) and GAPDH. (H) U2OS cells were treated for 24 h with 10 μΜ ABT-737, 2 μΜ S63845 and 20 μΜ Q-VD-OPh with or without the addition of 1 μΜ TAK-243. Mitochondrial depletion was assessed by blotting for several mitochondrial proteins and GAPDH. Data information: (C, D, E, F, G, H) blots are representative of three independent experiments.
Figure EV2
Figure EV2. Mitochondrial ubiquitylation and GFP-NEMO translocation can be blocked by E1 inhibition and is independent of neddylation.
(A) SVEC4-10 cells treated for 3 h with 10 μΜ ABT-737, 10 μΜ S63845 and 30 μΜ Q-VD-OPh. Mitochondria were isolated using Dounce homogeniser and cellular fractions were probed with relevant antibodies. Mitochondrial localised NEMO was quantified normalising to mitochondrial content defined by HSP60 signal. (B) SVEC4-10 cells pre-treated with 2 μΜ TAK-243 for 1 h followed by additional 1 h treatment with 10 μΜ ABT-737, 10 μΜ S63845 and 30 μΜ Q-VD-OPh with or without 2 μΜ TAK-243. Blots are representative for four independent experiments. (C) Upper: SVEC4-10 cells expressing GFP-NEMO were pre-treated for 1 h with 2 μΜ TAK-243 followed by 1 h treatment of 10 μΜ ABT-737, 10 μΜ S63845, 30 μΜ Q-VD-OPh with or without 2 μΜ TAK-243. Cells were immunostained for TOM20 and ubiquitin (FK2). Scale bar is 50 μm and images are representative for three independent experiments. Lower: quantification showing the percentage of cells with mitochondrial localised GFP-NEMO and ubiquitin puncta. (D) SVEC4-10 cells pre-treated with 1 μΜ MLN4924 (NAE inhibitor) for 1 h followed by additional 1 h treatment with 10 μΜ ABT-737, 10 μΜ S63845 and 30 μΜ Q-VD-OPh with or without 1 μΜ MLN4924. Blots are representative for two independent experiments. (E) SVEC4-10 cells expressing GFP-NEMO pre-treated with 1 μΜ MLN4924 for 1 h followed by additional 1 h treatment with 10 μΜ ABT-737, 10 μΜ S63845 and 30 μΜ Q-VD-OPh with or without 1 μΜ MLN4924. Cells were immunostained for mitochondrial TOM20 and DAPI. Images are representative for three independent experiments and are shown with a 50 μm scale bar. (F) Quantification of (E) showing the percentage of cells with mitochondrial translocation of GFP-NEMO. Data information: graphs in (C, F) display mean values ± s.e.m. (error bars) of n  =  3 independent experiments. Statistics were performed using two-way ANOVA with Tukey correction. ****P < 0.0001.
Figure EV3
Figure EV3. Loss of NEMO cannot be rescued during CICD by expressing non-ubiquitin-binding mutants of NEMO.
(A) MEF Tnf-/-/Hoip+/+ and Tnf-/-/Hoip-/- expressing GFP-NEMO were treated for 3 h with 10 μΜ ABT-737, 5 μΜ S63845 and 30 μΜ Q-VD-OPh. Cells were immunostained for mitochondrial TOM20 and DAPI. Images are representative of three independent experiments. (B) Quantification of A showing the percentage of cells with mitochondrial translocation of GFP-NEMO. Graph displays mean values ± s.e.m. (error bars) of n  =  3 independent experiments. Statistical analysis was performed using two-way ANOVA with Tukey correction. (C) Validation of SVEC4-10, SVEC4-10 GFP-NEMO and SVEC4-10 GFP-D311N cells transfected with NTC or siNEMO. Lysates were blotted for NEMO and α-tubulin. (D) SVEC4-10, SVEC4-10 GFP-NEMO and SVEC4-10 GFP-D311N cells transfected with NTC or siNEMO were treated for 1 h with 10 μΜ ABT-737, 10 μΜ S63845 and 30 μΜ Q-VD-OPh. Cells were immunostained for p65 and DAPI. Images are representative of two independent experiments. (E) Quantification of (D) showing the percentage of cells with nuclear translocation of p65. Graph displays mean values ± s.e.m. (error bars) of n  =  2 independent experiments. ****P < 0.0001.
Figure EV4
Figure EV4. Validation of PINK1CRISPR, NIKCRISPR, MUL1/MARCH5CRISPR and XIAPCRISPR knockout cell lines.
(A) Validation of PINK1 knockout in SVEC4-10 cells with or without GFP-NEMO expression using genomic PCR and ICE (inference of CRISPR edits) analysis. (B) SVEC4-10 EMPTYCRISPR and PINK1CRISPR cells expressing YFP-Parkin were treated for 1 h with 10 μΜ ABT-737, 10 μΜ S63845 and 30 μΜ Q-VD-OPh or for 3 h with 10 μΜ CCCP. Mitochondria were immunostained with HSP60 and DAPI. Images are representative of two independent experiments and displayed with 50 μm scale bar. (C) Validation of MUL1 knockout in SVEC4-10 MUL1/MARCH5CRISPR cells using genomic PCR and ICE analysis. (D) Validation of MARCH5 knockout in SVEC4-10 MUL1/MARCH5CRISPR cells using genomic PCR and ICE analysis. (E) Validation of SVEC4-10 XIAPCRISPR cells with and without GFP-NEMO expression using western blot. Lysates were blotted for XIAP and Actin. (F) Tnf, Kc, and Ccl5 expression of SVEC4-10 EMPTYCRISPR and XIAPCRISPR cells treated with 10 μΜ ABT-737, 10 μΜ S63845 and 30 μΜ Q-VD for 3 h. Graph is representative of three independent experiments. (G) Validation of NIK knockout in GFP-NEMO expressing SVEC4-10 EMPTYCRISPR and NIKCRISPR cells. Cells were treated for 2 h with 10 μM MG-132. Lysates were blotted for NIK and actin.
Figure EV5
Figure EV5. Raptinal induces cell death independent of mitochondrial permeabilization by BAX and BAK.
(A) SVEC4-10 cells were treated for 2 h with 1 μΜ rotenone, 1 μΜ oligomycin, 5 μΜ antimycin A, 3 μΜ erastin or the combination 10 μΜ ABT-737, 10 μΜ S63845 and 30 μΜ Q-VD-OPh. Mitochondria were isolated using digitonin fractionation buffer and antibodies against ubiquitin (UBCJ2), HSP60 and GAPDH were used. (B) SVEC4-10 cells expressing GFP-NEMO were treated for 2 h with 1 μΜ rotenone, 1 μΜ oligomycin, 5 μΜ antimycin A, 3 μΜ erastin or the combination 10 μΜ ABT-737, 10 μΜ S63845 and 30 μΜ Q-VD-OPh. Cells were immunostained with mitochondrial TOM20 and DAPI for confocal microscopy. Graph shows the quantification of three independent experiments in which the percentage of cells with mitochondrial localisation of GFP-NEMO was analysed. (C) SVEC4-10 cells were treated for 2 h with 1 μΜ rotenone, 1 and 5 μΜ antimycin A or 3 μΜ erastin. ROS levels were determined using MitoSOX Red via flow cytometry. Graph displays mean values ± s.e.m. (error bars) of n  =  3 independent experiments. (D) SVEC4-10 cells were treated with 0.5, 1, 5, 10 and 20 μΜ erastin. Mitochondrial calcium was measured using Rhod2-AM via flow cytometry. Graph displays mean values ± s.e.m. (error bars) of n  =  3 independent experiments. (E) SVEC4-10 cells were treated for 2 h with 10 μΜ ABT-737, 10 μΜ S63845 and 30 μΜ Q-VD-OPh with or without 25 μM cyclosporin A. Mitochondria were isolated using digitonin fractionation buffer and antibodies against ubiquitin (UBCJ2), HSP60 and GADPH were used. (F) SVEC4-10 cells expressing GFP-NEMO were treated for 2 h with 10 μΜ ABT-737, 10 μΜ S63845 and 30 μΜ Q-VD-OPh with or without 25 μM cyclosporin A. Cells were immunostained with mitochondrial TOM20 and DAPI for confocal microscopy. Graph shows the quantification of three independent experiments showing the percentage of cells with mitochondrial localisation of GFP-NEMO, error bars represent s.e.m. (G) EMPTYCRISPR and BAX/BAKCRISPR validation of SVEC4-10 cells and SVEC4-10 cells expressing GFP-NEMO. Lysates for blotted for BAX, BAK and α-tubulin. (H) SVEC4-10 EMPTYCRISPR and SVEC4-10 BAX/BAKCRISPR cells treated with 10 μΜ ABT-737 and 10 μΜ S63845 or treated with 2.5 or 10 μΜ raptinal. Caspase-dependency of death was assessed using 30 μΜ Q-VD-OPh. Cell viability was measured using Sytox Green exclusion. Graphs are representative of two independent experiments and display the mean and s.e.m. of two replicates. (I) SVEC4-10 cells treated for 3 h with 10 μΜ ABT-737, 10 μΜ S63856 and 30 μΜ Q-VD-OPh or 2.5 μΜ raptinal and 30 μΜ Q-VD-OPh. Expression of Kc, Tnf and Actin were validated using RT-qPCR. Two repeats of Fig. 6E. Data information: (A, E) blots are representative for three independent experiments. Statistics performed using two-way ANOVA with Tukey correction. ***P < 0.001, ****P < 0.0001.

References

    1. Ader NR, Hoffmann PC, Ganeva I, Borgeaud AC, Wang C, Youle RJ, Kukulski W. Molecular and topological reorganizations in mitochondrial architecture interplay during Bax-mediated steps of apoptosis. eLife. 2019;8:e40712. - PMC - PubMed
    1. Arganda-Carreras I, Kaynig V, Rueden C, Eliceiri KW, Schindelin J, Cardona A, Sebastian Seung H. Trainable Weka Segmentation: a machine learning tool for microscopy pixel classification. Bioinformatics. 2017;33:2424–2426. - PubMed
    1. Bock FJ, Tait SWG. Mitochondria as multifaceted regulators of cell death. Nat Rev Mol Cell Biol. 2020;21:85–100. - PubMed
    1. Braschi E, Zunino R, McBride HM. MAPL is a new mitochondrial SUMO E3 ligase that regulates mitochondrial fission. EMBO Rep. 2009;10:748–754. - PMC - PubMed
    1. Brokatzky D, Dorflinger B, Haimovici A, Weber A, Kirschnek S, Vier J, Metz A, Henschel J, Steinfeldt T, Gentle IE, et al. A non-death function of the mitochondrial apoptosis apparatus in immunity. EMBO J. 2019;38:e100907. - PMC - PubMed