. 2024 Feb;6(2):304-322.
doi: 10.1038/s42255-024-00983-3. Epub 2024 Feb 9.

Transcriptional programming of translation by BCL6 controls skeletal muscle proteostasis

Affiliations

Transcriptional programming of translation by BCL6 controls skeletal muscle proteostasis

Krithika Ramachandran et al. Nat Metab. 2024 Feb.

Abstract

Skeletal muscle is dynamically controlled by the balance of protein synthesis and degradation. Here we discover an unexpected function for the transcriptional repressor B cell lymphoma 6 (BCL6) in muscle proteostasis and strength in mice. Skeletal muscle-specific Bcl6 ablation in utero or in adult mice results in over 30% decreased muscle mass and force production due to reduced protein synthesis and increased autophagy, while it promotes a shift to a slower myosin heavy chain fibre profile. Ribosome profiling reveals reduced overall translation efficiency in Bcl6-ablated muscles. Mechanistically, tandem chromatin immunoprecipitation, transcriptomic and translational analyses identify direct BCL6 repression of eukaryotic translation initiation factor 4E-binding protein 1 (Eif4ebp1) and activation of insulin-like growth factor 1 (Igf1) and androgen receptor (Ar). Together, these results uncover a bifunctional role for BCL6 in the transcriptional and translational control of muscle proteostasis.


Conflict of interest statement

Competing interests

The authors declare no competing interests.

Figures

Extended Data Fig. 1 |
Extended Data Fig. 1 |. Bcl6 controls the development of skeletal muscle mass.
(a) qPCR expression of Bcl6 and myogenic markers in primary myoblasts and myotubes relative to the housekeeping gene Rn45s (n = 4 per group). Myoblast vs myotube P-value for Bcl6 = 0.0124, Mb = 0.0153, Mef2c = 0.0146 by unpaired, two-tailed t-test with Welch correction. (b) Western blot and densitometry of BCL6 and total (Memcode) protein in primary myoblasts and myotubes (n = 4/group). Myoblast vs myotube P = 0.0036 by unpaired, two-tailed t-test with Welch correction. (c) Western blot and densitometry of BCL6 and Actin protein in heart from Bcl6fl/fl and Bcl6MKO mice (n = 3/group). (d) Total body weight, fat, and lean mass in n = 7 Bcl6fl/fl and n = 10 Bcl6MKO female mice at 8 weeks of age. Bcl6fl/fl vs Bcl6MKO lean mass P = 0.0184 by unpaired, two-tailed t-test with Welch correction. (e) Tissue weights of quadriceps (quad), gastrocnemius (gastroc), tibialis anterior (TA), extensor digitorum longus (EDL) and soleus from female Bcl6fl/fl and Bcl6MKO mice at 16 weeks of age (n = 7/group). Unpaired, two-tailed t-test with Welch correction was performed and all p-values can be found in the source data file. All data are represented as mean ± SEM. * p < 0.05, ** p < 0.01 and *** p < 0.001.
Extended Data Fig. 2 |
Extended Data Fig. 2 |. Inducible deletion of Bcl6 in adult mice results in muscle loss.
(a, b) Serial measurements of total body, lean, and fat mass in (a) n = 6 Cre+ oil, n = 9 Cretmx and n = 9 Bcl6i-MKO male and (b) n = 6 Cre+oil, n = 8 Cretmx and n = 8 Bcl6i-MKO female mice starting at 8 weeks of age prior to (pre) and up to 12 weeks after treatment. Two-way ANOVA with Tukey’s multiple comparisons test was performed. (c, d) Weights of quadriceps (quad), gastrocnemius (gastroc), tibialis anterior (TA), extensor digitorum longus (EDL) and soleus from Cre+ oil, Cretmx and Bcl6i-MKO (c) male and (d) female mice 12 weeks after treatment (n = same as (a,b)). One-way ANOVA with Dunnett’s multiple comparisons test was performed. (e) Tissue weights in n = 4 ad lib chow fed and n = 5 48-hour fasted C57BL/6 male mice. (f) qPCR of Bcl6 normalized to 36b4 in muscles from fed and 48-hour fasted mice (n = 3/group). (g) Western blot and densitometry of BCL6 and Actin in n = 4 fed and n = 5 from 48 hour fasted mouse quadriceps. Unpaired, two-tailed t-test with Welch correction was performed in (e-g). (h) Bcl6 levels in published cancer-associated cachexia syndrome (CACS) models. GEO accession numbers are listed. Control vs C26 colon cancer P = 0.0008 by unpaired, two-tailed t-test with Welch correction (n = 3/group). Boxplot shows min to max values with line at the mean. (i) Bcl6 expression in C2C12 myotubes exposed to 33% colon-26 carcinoma (C26) conditioned versus control media for 8 hours (n = 3/group; unpaired, two-tailed t-test with Welch correction was performed) and corresponding protein blots after 8 or 24 hours. (j) Bcl6 expression in C2C12 myotubes treated with cytokines (n = 3/group), growth hormone (n = 2/group) and glucocorticoids (n = 3/group) for 8 hours. Unpaired, two-tailed t-test with Welch correction and one-way ANOVA with Dunnett’s multiple comparisons were performed. Exact p-values can be found in the source data file. All data in (a-g) and (i-j) are represented as mean ± SEM. δ p < 0.05, δδ p < 0.01 for Cre+ oil vs Cretmx; # p < 0.05, ## p < 0.01, ### p < 0.001 for Cre+ oil vs Bcl6i-MKO; * p < 0.05, ** p < 0.01, *** p < 0.001 for Cretmx vs Bcl6i-MKO or fed vs fasted or vehicle vs treated myotubes.
Extended Data Fig. 3 |
Extended Data Fig. 3 |. Bcl6 controls an oxidative to glycolytic shift in myofibres.
(a) Representative fluorescent antibody-stained images of four myosin heavy chain isoforms in quadriceps from Cre tmx and Bcl6i-MKO mice (left). MYH7 (type 1 fiber) is blue, MYH2 (type 2a fiber) is green, MYH1 (type 2x fiber) is black, and MYH4 (type 2b fiber) is red. Quantification of fiber types (right) expressed as percentage of total (n = 3/group). Cre tmx vs Bcl6i-MKO type 2a fiber P = 0.0374 by unpaired, two-tailed t-test with Welch correction. (b) qPCR DNA ratios of mitochondrial genes Cox1 and Cytb over nuclear genes Gcg and Hbb in quadriceps from Bcl6fl/fl and Bcl6MKO males (n = 7/group). (c) Western blot and densitometry of VDAC and total (Licor) protein in quadriceps from n = 6 Bcl6fl/fl and n = 7 Bcl6MKO males. (d) Protein levels of mitochondrial complex subunits and total (Memcode) protein in quadriceps from Bcl6fl/fl and Bcl6MKO mice. Western blot (left) and protein densitometry (right) are shown. (n = 4/group) Bcl6fl/fl vs Bcl6MKO complex II P = 0.0139 by unpaired, two-tailed t-test with Welch correction. (e, f) Cross-sectional areas of specific fiber types determined from fluorescent antibody-stained sections in quadriceps from (e) Bcl6fl/fl and Bcl6MKO mice (n = 3/group) and (f) Cre tmx and Bcl6i-MKO mice (n = 3/group). Type 2b fiber in Bcl6fl/fl vs Bcl6MKO P = 0.003 and in Cre tmx vs Bcl6i-MKO P = 0.0385 by unpaired, two-tailed t-test with Welch correction. All data are represented as mean ± SEM. * p < 0.05, ** p < 0.01.
Extended Data Fig. 4 |
Extended Data Fig. 4 |. Muscle loss due to Bcl6 deletion is associated with reduced muscle function.
(a, b) Absolute (left) and lean body mass normalized (right) forelimb grip strength measured in (a) 13-week old n = 7 Bcl6fl/fl and n = 10 Bcl6MKO female mice and (b) n = 6 Cre+ oil, n = 8 Cre tmx and n = 8 Bcl6i-MKO female mice twelve weeks after tamoxifen or oil treatment. Whiskers in the boxplot show min to max values with line at the median and box representing the first to third quartile values. (c) Maximum tetanic force for the tibialis anterior (TA) muscle from 13-week old n = 3 Bcl6fl/fl and n = 2 Bcl6MKO female mice (P-value for maximum force = 0.0311 by unpaired, two-tailed t-test with Welch correction). (d, e) Distance and time run on a treadmill to exhaustion in (d) 13-week old n = 15 Bcl6fl/fl and n = 14 Bcl6MKO male mice and (e) Cre tmx and Bcl6i-MKO female mice twelve weeks after tamoxifen treatment (n = 12/group). (f, g) Light phase, dark phase and total activity in (f) 13-week old Bcl6fl/fl and Bcl6MKO male mice (n = 5/group) and (g) Cre tmx and Bcl6i-MKO male mice 1.5 weeks after tamoxifen treatment (n = 5/group). All data in (c-g) are represented as mean ± SEM. * p< 0.05.
Extended Data Fig. 5 |
Extended Data Fig. 5 |. BCL6 directly controls the expression of anabolic regulators.
(a) Principal component analysis of RNA-seq from n = 5 Bcl6i-MKO and n = 4 tamoxifen-treated controls (Cre tmx) or n = 4 corn oil-treated controls (Cre+ oil). (b) Venn diagram depicting overlap between differentially expressed (DE) genes in muscle Stat5 knockout (Stat5MKO) mice (GEO series GSE14710) compared to muscle Bcl6i-MKO mice. (c) Quadrant plot of log2 fold change in gene expression in Stat5MKO/controls versus Bcl6i-MKO/Cre tmx controls. Spearman correlation coefficient rs = 0.03. (d) Scatterplot (left) of normalized H3K27ac tag counts and boxplot (right) showing quantification of H3K27ac tag densities within 1kb of BCL6 peaks in Cre tmx and Bcl6i-MKO quadriceps (n = 3/group; P = 3.5e−10 by unpaired, two-tailed Mann Whitney test). Whiskers in the boxplot show min to max values with line at the median and box representing the first to third quartile values. (e) Receiver operator curve (ROC) of the association between differential expression in Bcl6-ablated muscle and BCL6 binding peaks. (f) UCSC browser tracks of RNAseq in quadriceps from Cre+ oil, Cre tmx and Bcl6i-MKO mice, H3K27ac ChIP-seq in quadriceps from Cre tmx and Bcl6i-MKO mice 1 week after oil or tamoxifen treatment, nascent RNA-seq in quadriceps from mice treated with DMSO or FX1 for 3 hours, and BCL6 ChIP-seq track in quadriceps from C57BL/6 animals along the Mstn, Ar, and Smox genes. (g) qPCR expression of Bcl6, Akt1, Eif4ebp1, Igf1 and Ar in quadriceps from males (n = 5/group) and females (n = 4 Bcl6fl/fl and n = 5 Bcl6MKO mice). Two-way ANOVA followed by Tukey’s multiple comparisons test was performed and all individual p-values can be found in the source data file. (h, i) Western blot and densitometry of (h) BCL6 and actin (i) 4EBP1 and total protein (licor) in quadriceps from male and female n = 3 Bcl6fl/fl and n = 4 Bcl6MKO mice. For BCL6, P(male Bcl6fl/fl vs Bcl6MKO) = 0.005, P(male Bcl6fl/fl vs female Bcl6MKO) = 0.005, P(male Bcl6MKO vs female Bcl6fl/fl) = 0.0299, P(female Bcl6fl/fl vs Bcl6MKO) = 0.0305 and for 4EBP1, P(male Bcl6fl/fl vs Bcl6MKO) = 0.0034, P(male Bcl6fl/fl vs female Bcl6MKO) = 0.0199 by two-way ANOVA followed by Tukey’s multiple comparisons. All data in (g-i) are represented as mean ± SEM. * p < 0.05, ** p < 0.01 and *** p < 0.001.
Extended Data Fig. 6 |
Extended Data Fig. 6 |. Loss of Bcl6 reduces the rate of muscle protein synthesis.
(a) Heatmap of ribosome protected fragment (RPF) sizes in sequencing libraries of tamoxifen-treated Bcl6i-MKOmRiboTag and mRiboTag mice. (b) Pie chart distribution of mapped RPF reads. (c) Empirical cumulative distribution frequency (Ecdf) plots of the translation efficiencies (natural logarithm of TE) in quadriceps for all genes. Bcl6i-MKO mRiboTag vs mRiboTag P = 2.2e-16 by two-sided Kolmogorov-Smirnov testing (d) Metagene distribution plot showing normalized ribo-seq RPF reads from the TSS to TTS for all genes (left) and genes with increased TE (right). (e) Western blot and densitometry of ubiquitin protein and actin in quadriceps from Cre tmx and Bcl6i-MKO males 1.5 weeks after tamoxifen treatment (n = 4/group). (f) EIF4E co-immunoprecipitation and western blots for EIF4G (top) and 4EBP1 (bottom) in gastrocnemius from Cre tmx and Bcl6i-MKO males 1 week after tamoxifen treatment (n = 2/group). (g) Western blot and densitometry of p4EBP1, Non-phospho 4EBP1, Total 4EBP1, and total (Memcode) protein in quadriceps from 10 week old Bcl6fl/fl and Bcl6MKO males (n = 4/group). P(Bcl6fl/fl vs Bcl6MKO) for p4EBP1 = 0.0009, total 4EBP1 = 0.0004, and nonP 4EBP1 = 0.0002 by unpaired, two-tailed t-test with Welch correction. (h) qPCR of protein synthesis and degradation regulators in n = 4 Cre+ oil, n = 4 Cre tmx and n = 5 Bcl6i-MKO male mice 7 days after treatment. One-way ANOVA with Dunnett’s multiple comparisons test showed that P(Cre+ oil vs Bcl6i-MKO) for Eif4ebp1 = 0.0086, Mstn = 0.0018, Igf1 = 0.0332 and Ar = 0.0420; P(Cre tmx vs Bcl6i-MKO) for Eif4ebp1 = 0.0163, Mstn = 0.0011, Igf1 = 0.0140 and Ar = 0.0330. (i, j) Analysis of Eif4ebp1 knockdown efficiency in muscles (n = 3 mice/group for scramble and Eif4ebp1 shRNA1 and n = 2 mice/group for Eif4ebp1 shRNA2). (i) qPCR of Eif4ebp1 and (j) western blot and densitometry of 4EBP1 in Cre tmx and Bcl6i-MKO male mice transduced with scramble (black border), Eif4ebp1 shRNA1 (green border), or Eif4ebp1 shRNA2 (yellow border) and treated with tamoxifen one week after viral infection. Tissues were analyzed eight weeks later. All bar graph data in (e, g-j) are represented as mean ± SEM. # p < 0.05, ## p < 0.01 for Cre+ oil vs Bcl6i-MKO and * p < 0.05, ** p < 0.01, *** p < 0.001 for Cretmx vs Bcl6i-MKO and Bcl6fl/fl vs Bcl6MKO.
Extended Data Fig. 7 |
Extended Data Fig. 7 |. Chronic Bcl6 loss evokes compensatory signaling to maintain muscle mass.
(a) SUnSET analysis of puromycin incorporation into quadriceps (top) in Cre tmx and Bcl6i-MKO mice 12 weeks after tamoxifen treatment. Puromycin labeling relative to total protein (Licor) by densitometry (bottom) (n = 3/group; P = 0.0017 by unpaired, two-tailed t-test with Welch correction). (b) Western blot and densitometry in quadriceps from Cre tmx and Bcl6i-MKO males 15 weeks after tamoxifen treatment for LC3, 3 days after colchicine or vehicle treatment. (n = 3/group; Two-way ANOVA followed by Tukey’s multiple comparisons test was performed. P (Veh-Cre tmx vs Col-Cre tmx) = 0.0174; P (Veh-Cre tmx vs Col-Bcl6i-MKO) = 0.0005; P (Veh-Bcl6i-MKO vs Col-Bcl6i-MKO) = 0.0083.) Flux is the difference in average LC3-II levels in colchicine minus vehicle (bottom right). (c) Western blot and densitometry of ubiquitin and total (Licor) protein in quadriceps from Cre tmx and Bcl6i-MKO males 12 weeks after tamoxifen treatment (n = 4/group). (d) Quadrant plot of log2 fold change in gene expression in Bcl6i-MKO/Cre tmx 12 weeks after tamoxifen treatment (chronic) versus Bcl6iMKO/Cre tmx 1 week after tamoxifen treatment (acute). (e) Ontology analysis of differential genes unique in chronic Bcl6 deletion. Cumulative hypergeometric statistical testing was used. (f) Log p-value versus Pearson correlation plotted for causal transcription factors identified by IMAGE that were unique to either acute or chronic Bcl6 deletion. Pink = high, green = medium, and gray = low confidence factors. Factors in acute dataset are shown as circles and factors in chronic are squares. (g) Causal transcription factors with opposing Pearson correlations to gene expression in acute versus chronic Bcl6 deletion. Acute = green circle, chronic = orange square. (h-l) Western blot and densitometry of (h) pSMAD1/5/8, Total SMAD1, and total (Licor) protein, (i) pFOXO1, Total FOXO1, and Actin, (j) p4EBP1, Non-phospho 4EBP1, Total 4EBP1, and Actin, (k) pAKT, Total AKT, and Actin and (l) pS6, Total S6, and Actin in quadriceps from Cre tmx and Bcl6i-MKO males 12 week after tamoxifen treatment (n = 4/group). Unpaired, two-tailed t-test with Welch correction and all individual p-values can be found in the source data file. All bar graph data in (a-c, h-l) are represented as mean ± SEM. * p < 0.05 and ** p < 0.01.
Fig. 1 |
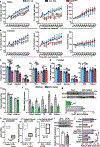
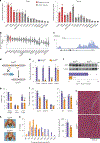
Fig. 1 |. Bcl6 controls the development of skeletal muscle mass.
a, qPCR expression of Bcl6 in C57BL/6 male and female mouse tissues relative to the housekeeping gene 36b4 (n = 4 per group). b, RNA-seq data for BCL6 in 19 different human tissues from the GTEx database. The box plot shows the minimum to maximum tags per million values; the white bar indicates the median, and the grey rectangle represents the first to third quartile values. N is different for each tissue. c, ChIP–seq track for H3K27ac in quadriceps along the Bcl6 gene revealed a super-enhancer. d, Schematic of mouse skeletal muscle-specific in utero Bcl6 deletion model. Created with BioRender.com. e, qPCR expression of Bcl6 relative to the housekeeping gene 36b4 in quadriceps, gastrocnemius, soleus and heart from Bcl6fl/fl and Bcl6MKO mice (n = 5 per group). Unpaired, two-tailed t-test with Welch correction was performed. f, Western blot and densitometry of BCL6 and tubulin protein in quadriceps from n = 4 Bcl6fl/fl and n = 5 Bcl6MKO mice. Bcl6fl/fl versus Bcl6MKO P = 0.0077 by unpaired, two-tailed t-test with Welch correction. g, Total body weight, fat and lean mass in n = 10 Bcl6fl/fl and n = 6 Bcl6MKO male mice at 8 weeks of age. Unpaired, two-tailed t-test with Welch correction was performed. h, Representative image of lower limb muscles from Bcl6fl/fl and Bcl6MKO mice. i, Tissue weights of quadriceps, gastrocnemius, TA, EDL and soleus from n = 8 Bcl6fl/fl and n = 6 Bcl6MKO male mice at 16 weeks of age. Unpaired, two-tailed t-test with Welch correction was performed. j, H&E staining of representative TA muscle from 13-week-old male Bcl6fl/fl and Bcl6MKO mice. Scale bar, 300 μm. k, Myofibre CSAs determined from H&E-stained sections of TA from Bcl6fl/fl and Bcl6MKO mice (n = 4 per group). Bcl6fl/fl versus Bcl6MKO P = 0.0095 by unpaired, two-tailed t-test with Welch correction. All data are represented as the mean ± s.e.m. **P < 0.01 and ***P < 0.001. BAT, brown adipose tissue; PgAT, perigonadal adipose tissue; Quad, quadriceps; ScAT, subcutaneous adipose tissue; Skm, skeletal muscle.
Fig. 2 |
Fig. 2 |. Rapid muscle loss following muscle Bcl6 deletion in adult mice.
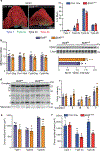
a, Schematic of tamoxifen-inducible model for Bcl6 deletion in adult mice. Created with BioRender.com. b, qPCR expression of Bcl6 relative to the housekeeping gene 36b4 in quadriceps, gastrocnemius, soleus and heart from n = 2 Cre-positive oil-treated (Cre+ oil), n = 3 Cre-negative tamoxifen-treated (Cre tmx) and n = 3 Cre-positive tamoxifen-treated (Bcl6i-MKO) males 1 week after treatment. One-way analysis of variance (ANOVA) with Dunnett’s multiple-comparisons test showed that in quadriceps, P(Cre+ oil versus Cre tmx) = 0.0194, P(Cre+ oil versus Bcl6i-MKO) = 0.0011, P(Cre tmx versus Bcl6i-MKO) = 0.0356; in gastrocnemius, P(Cre+ oil versus Cre tmx) = 0.0090, P(Cre+ oil versus Bcl6i-MKO) = 0.0345, P(Cre tmx versus Bcl6i-MKO) = 0.0015; in soleus, P(Cre+ oil versus Bcl6i-MKO) = 0.0009, P(Cre tmx versus Bcl6i-MKO) = 0.0042. c, Western blot and densitometry of BCL6, actin, total (Licor) protein in quadriceps (left, short exposure; middle, long exposure) and heart (right) from n = 2 Cre+ oil, n = 3 Cre tmx and n = 4 Bcl6i-MKO males 1 week after tamoxifen or oil treatment. One-way ANOVA with Dunnett’s multiple-comparisons test showed that P(Cre+ oil versus Bcl6i-MKO) = 0.0498 and P(Cre tmx versus Bcl6i-MKO) = 0.0240. d, Serial measurements of total body weight, lean and fat mass in n = 10 Cre+ oil, n = 10 Cre tmx and n = 13 Bcl6i-MKO male mice starting at 12 weeks of age before (pre) and up to 12 weeks after treatment. Two-way ANOVA with Tukey’s multiple-comparisons test was performed. e, Tissue weights of quadriceps, gastrocnemius, TA, EDL and soleus from Cre+ oil, Cre tmx and Bcl6i-MKO male mice 12 weeks after treatment (n same as d). One-way ANOVA with Dunnett’s multiple-comparisons test was performed. f, Laminin staining of representative TA muscle from Cre tmx and Bcl6i-MKO male mice 6 weeks after tamoxifen treatment. Scale bar, 200 μm. g, Myofibre CSAs determined from laminin-stained sections (n = 3 per group; P = 0.0025 by unpaired, two-tailed t-test with Welch correction). All data are represented as the mean ± s.e.m. δP < 0.05, δδP < 0.01 for Cre+ oil versus Cre tmx; #P < 0.05, ##P < 0.01, ###P < 0.001 for Cre+ oil versus Bcl6i-MKO; *P < 0.05, **P < 0.01, ***P < 0.001 for Cre tmx versus Bcl6i-MKO.
Fig. 3 |
Fig. 3 |. Bcl6 controls an oxidative to glycolytic shift in myofibres.
ac, Representative fluorescent antibody-stained images of four myosin heavy chain isoforms in quadriceps (a), soleus (b) and EDL (c) from Bcl6fl/fl and Bcl6MKO mice. MYH7 (type 1 fibre) is blue, MYH2 (type 2a fibre) is green, MYH1 (type 2x fibre) is black and MYH4 (type 2b fibre) is red. Quantification of fibre types is expressed as percentage of the total shown on the right (a, n = 3 per group; b and c, n = 2 Bcl6fl/fl and n = 3 Bcl6MKO mice). Bcl6fl/fl versus Bcl6MKO P value for type 1 fibre in quad = 0.0041, type 1 fibre in soleus = 0.0315, type 2a fibre in soleus = 0.0002, type 2b fibre in soleus = 0.0088 and type 1 fibre in EDL = 0.0266 by unpaired, two-tailed t-test with Welch correction. d, qPCR expression of oxidative and glycolytic genes relative to the housekeeping gene 36b4 in EDL, quadriceps and soleus from Bcl6fl/fl and Bcl6MKO mice (n = 4 per group). Bcl6fl/fl versus Bcl6MKO; EDL: P value for Tnni1 = 0.0175, Tnnt1 = 0.02, Myh7 = 0.0019, Tnnt3 = 0.0334; Bcl6fl/fl versus Bcl6MKO; quadriceps: P value for Tnni1 = 0.0147, Tnnt1 = 0.0238, Myh7 = 0.0174, Tnni2 = 0.0001, Tnnt3 = 0.0021, Myh4 = 0.00008; Bcl6fl/fl versus Bcl6MKO; soleus: P value for Tnni1 = 0.0012, Tnnt1 = 0.0125, Myh7 = 0.0267, Tnni2 = 0.0242, Tnnt3 = 0.0042 by unpaired, two-tailed t-test with Welch correction. All data are represented as the mean ± s.e.m. *P < 0.05, **P < 0.01 and ***P < 0.001.
Fig. 4 |
Fig. 4 |. Bcl6 enhances skeletal muscle force production.
a,b, Absolute (left) and lean body mass normalized (right) forelimb grip strength measured in n = 10 Bcl6fl/fl and n = 6 Bcl6MKO male mice at 12 weeks of age (P value for absolute grip strength = 0.00007 by unpaired, two-tailed t-test with Welch correction) (a) and n = 6 Cre+ oil, n = 9 Cre tmx and n = 9 Bcl6i-MKO male mice 12 weeks after tamoxifen or oil treatment (b). One-way ANOVA with Dunnett’s multiple-comparisons test for absolute grip strength showed that P(Cre+ oil versus Bcl6iMKO) = 0.0390 and P(Cre tmx versus Bcl6i-MKO) = 0.0001. Whiskers in the box plot show the minimum to maximum values, the line indicates the median and the box represents the first to third quartile values. c,d, Maximum tetanic force (left) and specific force (right) for TA muscle from 13-week-old Bcl6fl/fl and Bcl6MKO male mice (n = 4 per group; P value for max force = 0.00004 by unpaired, two-tailed t-test with Welch correction) (c) and n = 5 Cre tmx and n = 4 Bcl6i-MKO male mice 6 weeks after tamoxifen treatment (P value for maximum force = 0.00003 by unpaired, two-tailed t-test with Welch correction) (d). e,f, Fatigue curves showing the decline in force production by the TA muscle from 13-week-old Bcl6fl/fl and Bcl6MKO male mice (n = 4 per group; P value for fatigue < 1 × 10⁻¹⁵ by two-way ANOVA) (e) and n = 5 Cre tmx and n = 4 Bcl6i-MKO male mice 6 weeks after tamoxifen treatment (P value for fatigue = 0.0088 by two-way ANOVA) (f) over 25 consecutive bouts of isometric contraction. Relative fatigue calculated by dividing each value by the initial force is shown at the bottom. All data are represented as the mean ± s.e.m. #P < 0.05 for Cre+ oil versus Bcl6i-MKO and **P < 0.01, ***P < 0.001 for Cre tmx versus Bcl6i-MKO.
Fig. 5 |
Fig. 5 |. BCL6 directly controls the expression of anabolic regulators.
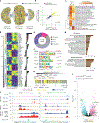
a, Venn diagram depicting DE muscle genes between n = 5 Bcl6i-MKO and n = 4 tamoxifen-treated controls (Cre tmx) or n = 4 corn oil-treated controls (Cre+ oil). DE genes identified in both are in the centre. DE genes specific to Bcl6i-MKO and Cre tmx (right) or Bcl6i-MKO and Cre+ oil (left) are also shown. b, Quadrant plot of log2 fold change in gene expression for common DE genes in Bcl6i-MKO/Cre tmx versus log2 fold change in Bcl6i-MKO/Cre+ oil. Spearman correlation coefficient rs = 0.96. c, Ontology analysis of DE downregulated (left column) and upregulated (right column) genes in Bcl6i-MKO mice compared to both controls. Cumulative hypergeometric statistical test was used. d, Heat map of FPKM values for selected genes in muscle samples from Bcl6i-MKO and Cre tmx mice. Colours represent expression from maximum (yellow) to minimum (blue) for each gene. Log2 fold change in expression for Bcl6i-MKO samples versus Cre+ oil controls are also shown (right). e, Pie chart showing genomic distribution of BCL6 binding sites in C57BL/6 mouse quadriceps. f, Top motifs enriched near BCL6 peaks and P values calculated with cumulative hypergeometric statistical testing. g, Top biological process (top) and mouse phenotype (bottom) ontologies for genes near BCL6 peaks. Cumulative hypergeometric statistical testing was used. h, Integrated RNA-seq and ChIP–seq analysis using Cistrome-GO depicting the likelihood that a gene is regulated by BCL6 (rank product score). Genes with log2 fold change expression > 1 in Bcl6i-MKO/Cre tmx and annotated BCL6 binding sites are shown. i, Volcano plot showing upregulated (pink) and downregulated (light blue) BCL6 target genes from nascent RNA-seq in C57BL/6 mice exposed to the BCL6 inhibitor FX-1 (50 mg per kg body weight) compared to vehicle-treated controls for 3 h (n = 5 per group). Wald test was used to calculate the P values. j, UCSC browser tracks of RNA-seq in quadriceps from Cre+ oil, Cre tmx and Bcl6i-MKO mice, H3K27ac ChIP–seq in quadriceps from Cre tmx and Bcl6i-MKO mice 1 week after oil or tamoxifen treatment, nascent RNA-seq in quadriceps from mice treated with DMSO or FX-1 for 3 h, and BCL6 ChIP–seq track in quadriceps from C57BL/6 animals along the Eif4ebp1 (left) and Igf1 (right) genes.
Fig. 6 |
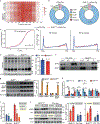
Fig. 6 |. Loss of Bcl6 reduces the rate of muscle protein synthesis.
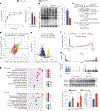
a, Temporal profile for alanine labelling (MPE, moles percent excess) in quadriceps of Cre tmx and Bcl6i-MKO mice following 2H-saline injection 1 week after tamoxifen treatment (n = 4 Cre tmx mice for days 0, 1 and 2 and n = 5 Cre tmx mice for days 4 and 7; n = 4 Bcl6i-MKO for day 0 and n = 5 Bcl6i-MKO for days 1, 2, 4 and 7); P value on day 2 = 0.0064 by unpaired, two-tailed t-test with Welch correction. Calculated rates of muscle protein synthesis on the right (n = 5 per group). P = 0.0319 by unpaired, two-tailed t-test with Welch correction. b, SUnSET analysis of puromycin incorporation into quadriceps in Cre tmx and Bcl6i-MKO mice 1.5 weeks after tamoxifen treatment. Puromycin labelling relative to total protein (Memcode) by densitometry (right; n = 3 per group; P = 0.0315 by unpaired, two-tailed t-test with Welch correction). c, Schematic of Bcl6i-MKOmRiboTag mouse model and Ribo-seq procedure. Created with BioRender.com. d, Quadrant plot showing log2 fold change of RPFs versus log2 fold change of mRNA for Bcl6i-MKOmRiboTag/mRiboTag quadriceps 3 weeks after tamoxifen treatment. e, Volcano plot of TE. Significantly upregulated TE genes (yellow), downregulated TE genes (blue), known mRNAs with 5′ TOP motifs (pink) and non-significantly altered genes (grey) are plotted (n = 4 per group). Wald test was used to calculate the P values. f, Metagene distribution plot showing normalized Ribo-seq RPF reads from the TSS to transcription termination site (TTS) for genes with reduced TE. g, GO for transcripts with significantly altered TE. Cumulative hypergeometric statistical test was used. h, Browser tracks showing mRNA RPKM (top) and normalized RPF density (bottom) in quadriceps from mRiboTag and Bcl6i-MKOmRiboTag mice along Lamc1 and Col1a1 genes. i, Western blot and densitometry of LC3 and total protein (Licor) in quadriceps from Cre tmx and Bcl6i-MKO males 1.5 weeks after tamoxifen and following colchicine or vehicle treatment (n = 3 per group). Two-way ANOVA followed by Tukey’s multiple-comparisons test was performed. Flux is the difference in average LC3-II levels in colchicine minus vehicle (bottom right). Data in a, b and i are represented as the mean ± s.e.m. *P < 0.05 and **P < 0.01. NS, not significant.
Fig. 7 |
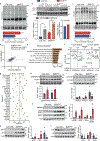
Fig. 7 |. BCL6 controls translation in skeletal muscle.
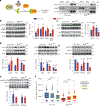
a, Left: schematic of EIF4E’s interaction with 4EBP1 and EIF4G. Right: EIF4E co-immunoprecipitation and western blots for EIF4G (top), 4EBP1 (middle) and EIF4E (bottom) in quadriceps from Cre tmx and Bcl6i-MKO males 1 week after tamoxifen treatment (n = 2 per group). b, Western blot and densitometry of p4EBP1, non-phospho-4EBP1, total 4EBP1 and actin protein in gastrocnemius from n = 3 Cre tmx and n = 4 Bcl6i-MKO males 1 week after treatment. Cre tmx versus Bcl6i-MKO P value for p4EBP1 = 0.0188, total 4EBP1 = 0.0319, ratio = 0.0258 and non-phospho-4EBP1 = 0.0426 by unpaired, two-tailed t-test with Welch correction. c,d, Western blot and densitometry of myostatin, AR (c), IGF-1–AKT signalling (d; pAKT, AKT, pS6, S6, pFOXO1, FOXO1) and actin or total (Licor, Memcode) protein in quadriceps from n = 3 Cre tmx and n = 4 Bcl6i-MKO males 1 week after treatment. Cre tmx versus Bcl6i-MKO P value for AR = 0.0133, pAKT = 0.0383, total AKT = 0.0016, pS6 = 0.048 and pFOXO1 = 0.0126 by unpaired, two-tailed t-test with Welch correction. e, Western blot and densitometry of pSMAD1/pSMAD5/pSMAD8, total SMAD1 and total (Licor) protein in quadriceps from Cre tmx and Bcl6i-MKO males 1 week after treatment (n = 4 per group). f, Myofibre CSAs determined from skeletal muscle of Cre tmx and Bcl6i-MKO mice infected with MyoAAV4As encoding scramble (Scrmb) or Eif4ebp1 shRNAs and then treated with tamoxifen. CSAs of 2,000 myofibres per mouse were determined 8 weeks later (n = 3 mice per group for scramble and Eif4ebp1 shRNA1 and n = 2 mice per group for Eif4ebp1 shRNA2). Whiskers in the box plot show 5–95th percentile values, the line indicates the median, and the box represents the first to third quartile values. Two-way ANOVA followed by Tukey’s multiple-comparisons test was performed. P value < 1 × 10⁻¹⁵ for Scrmb-Cre tmx versus shRNA2-Cre tmx, Scrmb-Cre tmx versus Scrmb-Bcl6i-MKO, Scrmb-Cre tmx versus shRNA1-Bcl6i-MKO, Scrmb-Cre tmx versus shRNA2-Bcl6i-MKO, shRNA1-Cre tmx versus shRNA2-Cre tmx, shRNA1-Cre tmx versus Scrmb-Bcl6i-MKO, shRNA1-Cre tmx versus shRNA1-Bcl6i-MKO, shRNA1-Cre tmx versus shRNA2-Bcl6i-MKO, shRNA2-Cre tmx versus Scrmb-Bcl6i-MKO, shRNA2-Cre tmx versus shRNA1-Bcl6i-MKO, shRNA2-Cre tmx versus shRNA2-Bcl6i-MKO, Scrmb-Bcl6i-MKO versus shRNA1-Bcl6i-MKO, Scrmb-Bcl6i-MKO versus shRNA2-Bcl6i-MKO and shRNA1-Bcl6i-MKO versus shRNA2-Bcl6i-MKO. All data are represented as the mean ± s.e.m. *P < 0.05, **P < 0.01 and ****P < 0.0001.
Fig. 8 |
Fig. 8 |. Model for BCL6-mediated control of skeletal muscle proteostasis.
BCL6-mediated transcriptional regulation controls the expression of atrogenic regulators to establish and maintain skeletal muscle mass. BCL6 directly represses Eif4ebp1 and possibly Mstn, while it directly activates Igf1 and Ar. Loss of Bcl6 in muscle acutely reduces cap-dependent translation and anabolic signalling, resulting in reduced protein synthesis, increased autophagy and skeletal muscle atrophy. Created with BioRender.com.

References

    1. Sartori R, Romanello V & Sandri M Mechanisms of muscle atrophy and hypertrophy: implications in health and disease. Nat. Commun. 12, 330 (2021). - PMC - PubMed
    1. Cohen S, Nathan JA & Goldberg AL Muscle wasting in disease: molecular mechanisms and promising therapies. Nat. Rev. Drug Discov. 14, 58–74 (2015). - PubMed
    1. Saxton RA & Sabatini DM mTOR signaling in growth, metabolism, and disease. Cell 169, 361–371 (2017). - PubMed
    1. Bodine SC et al. Identification of ubiquitin ligases required for skeletal muscle atrophy. Science 294, 1704–1708 (2001). - PubMed
    1. Brunet A et al. Akt promotes cell survival by phosphorylating and inhibiting a Forkhead transcription factor. Cell 96, 857–868 (1999). - PubMed

Substances