

SHBG Levels Do Not Correlate with Insulin Levels in PCOS with Appropriate Fasting Insulin Sensitivity
- PMID: 38337532
- PMCID: PMC10856642
- DOI: 10.3390/jcm13030838
SHBG Levels Do Not Correlate with Insulin Levels in PCOS with Appropriate Fasting Insulin Sensitivity
Abstract
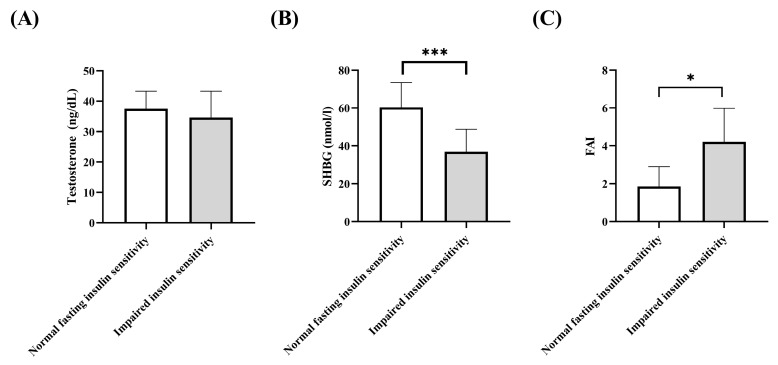
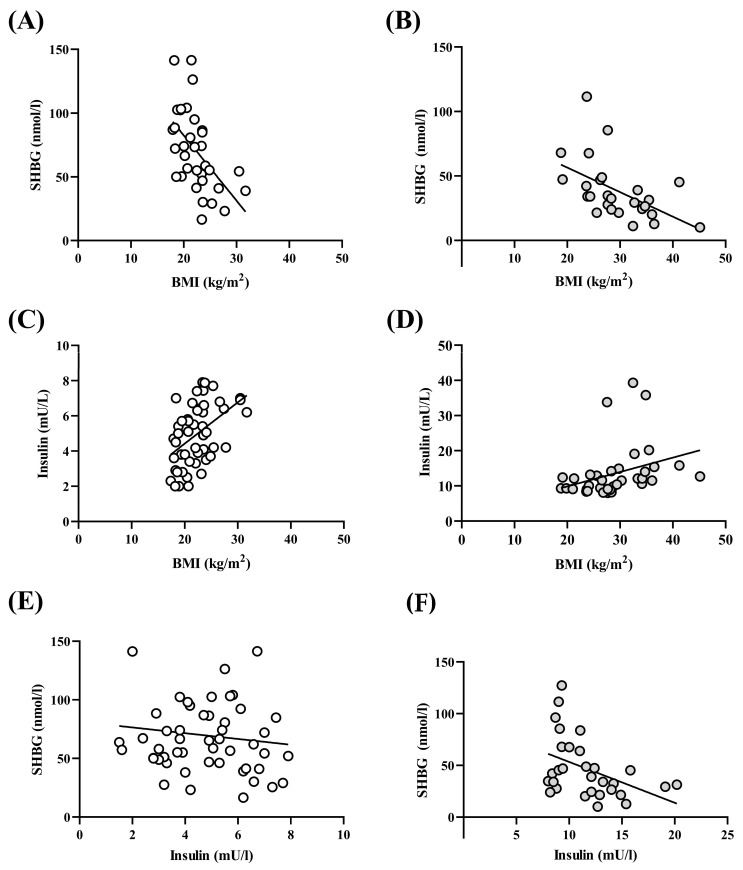
Introduction: There are several phenotypes of polycystic ovarian syndrome (PCOS), and the different phenotypes may differ metabolically. Methods: In the present retrospective study, women with PCOS having normal fasting insulin sensitivity (n = 88) were compared with women with PCOS showing impaired insulin sensitivity (n = 46) using the HPCOS (Hungarian Polycystic ovarian syndrome) database. Results: The impaired insulin sensitivity group has significantly higher body mass index (BMI) and HOMA index than the normal fasting insulin sensitivity group (BMI (kg/m2): 22.0 vs. 28.1, p < 0.0001, HOMA index: 0.96 vs. 2.38, p < 0.0001). The sex hormone binding globulin (SHBG) level was significantly lower, and the free androgen index proved itself significantly higher in the impaired insulin sensitivity group (p < 0.05). Linear regression analysis showed a negative association of BMI with SHBG levels in both groups, while BMI had a positive correlation with insulin concentrations in both groups. However, the SHBG levels were negatively associated with insulin concentrations in the impaired insulin sensitivity group, but this inverse association could not be observed in the normal fasting insulin sensitivity group. Conclusions: The inverse linear correlation of SHBG with HOMA index and serum insulin level is not evident in all PCO syndrome phenotypes, thus SHBG has limited applicability for characterizing carbohydrate metabolism and serum insulin sensitivity.
Keywords: SHBG; insulin resistance; insulin sensitivity; polycystic ovarian syndrome.
Conflict of interest statement
The authors declare no conflicts of interest.
Figures
Similar articles
-
The Cutoff Value of Low Sex Hormone-Binding Globulin and Its Predictive Role in Impaired Glucose Metabolism Among Chinese Women with Polycystic Ovarian Syndrome.Metab Syndr Relat Disord. 2021 Sep;19(7):378-385. doi: 10.1089/met.2020.0071. Epub 2021 May 4. Metab Syndr Relat Disord. 2021. PMID: 33945333
-
Diurnal variation of sex hormone binding globulin and insulin-like growth factor binding protein-1 in women with polycystic ovary syndrome.Clin Endocrinol (Oxf). 1995 Aug;43(2):159-65. doi: 10.1111/j.1365-2265.1995.tb01910.x. Clin Endocrinol (Oxf). 1995. PMID: 7554310
-
Evaluation of the Efficacy of Sex Hormone-Binding Globulin in Insulin Resistance Assessment Based on HOMA-IR in Patients with PCOS.Reprod Sci. 2021 Sep;28(9):2504-2513. doi: 10.1007/s43032-021-00535-0. Epub 2021 Mar 15. Reprod Sci. 2021. PMID: 33721297
-
Sex hormone-binding globulin and female reproductive function.J Steroid Biochem Mol Biol. 1995 Jun;53(1-6):529-31. doi: 10.1016/0960-0760(95)00108-c. J Steroid Biochem Mol Biol. 1995. PMID: 7626505 Review.
-
Childhood, adolescent, and adulthood adiposity are associated with risk of PCOS: a Mendelian randomization study with meta-analysis.Hum Reprod. 2023 Jun 1;38(6):1168-1182. doi: 10.1093/humrep/dead053. Hum Reprod. 2023. PMID: 37015099 Free PMC article.
Cited by
-
Changes in Prolactin and Insulin Resistance in PCOS Patients Undergoing Metformin Treatment: A Retrospective Study.J Clin Med. 2024 Dec 20;13(24):7781. doi: 10.3390/jcm13247781. J Clin Med. 2024. PMID: 39768704 Free PMC article.
References
Grants and funding
LinkOut - more resources
Full Text Sources
Miscellaneous
