. 2024 Jan 30;16(3):405.
doi: 10.3390/nu16030405.

Maternal Diet Associates with Offspring Bone Mineralization, Fracture Risk and Enamel Defects in Childhood and Influences the Prenatal Effect of High-Dose Vitamin D Supplementation

Affiliations

Maternal Diet Associates with Offspring Bone Mineralization, Fracture Risk and Enamel Defects in Childhood and Influences the Prenatal Effect of High-Dose Vitamin D Supplementation

Min Kim et al. Nutrients. .

Abstract

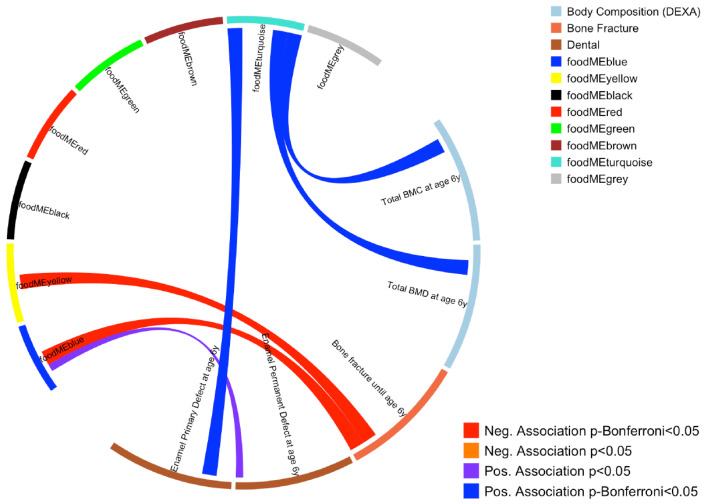
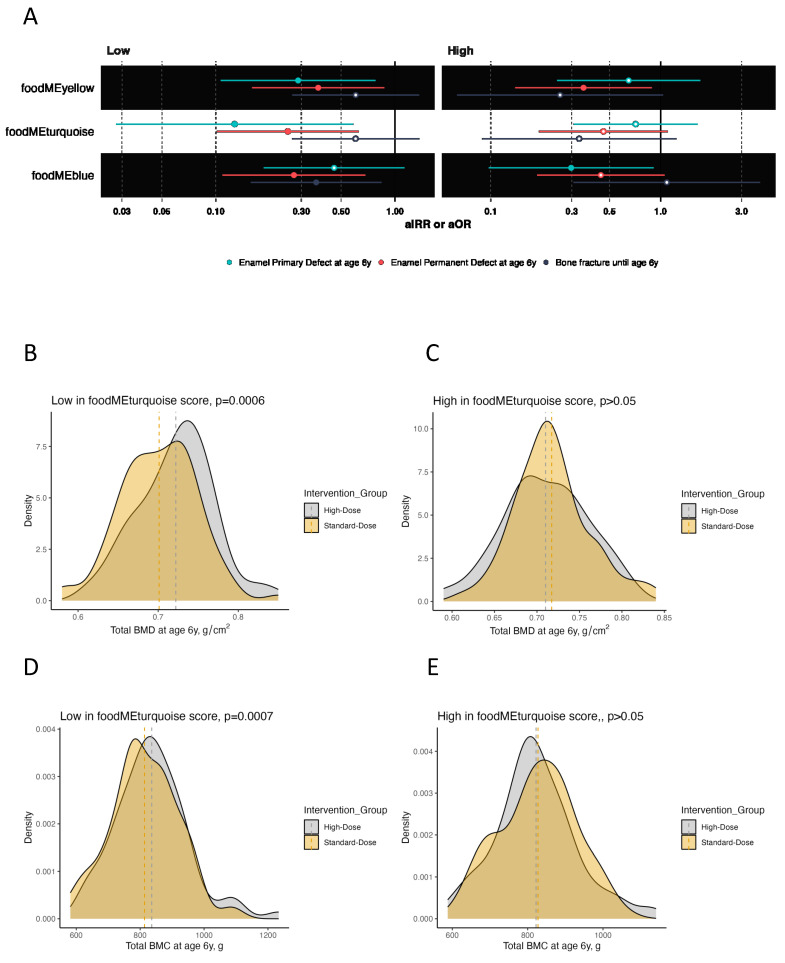
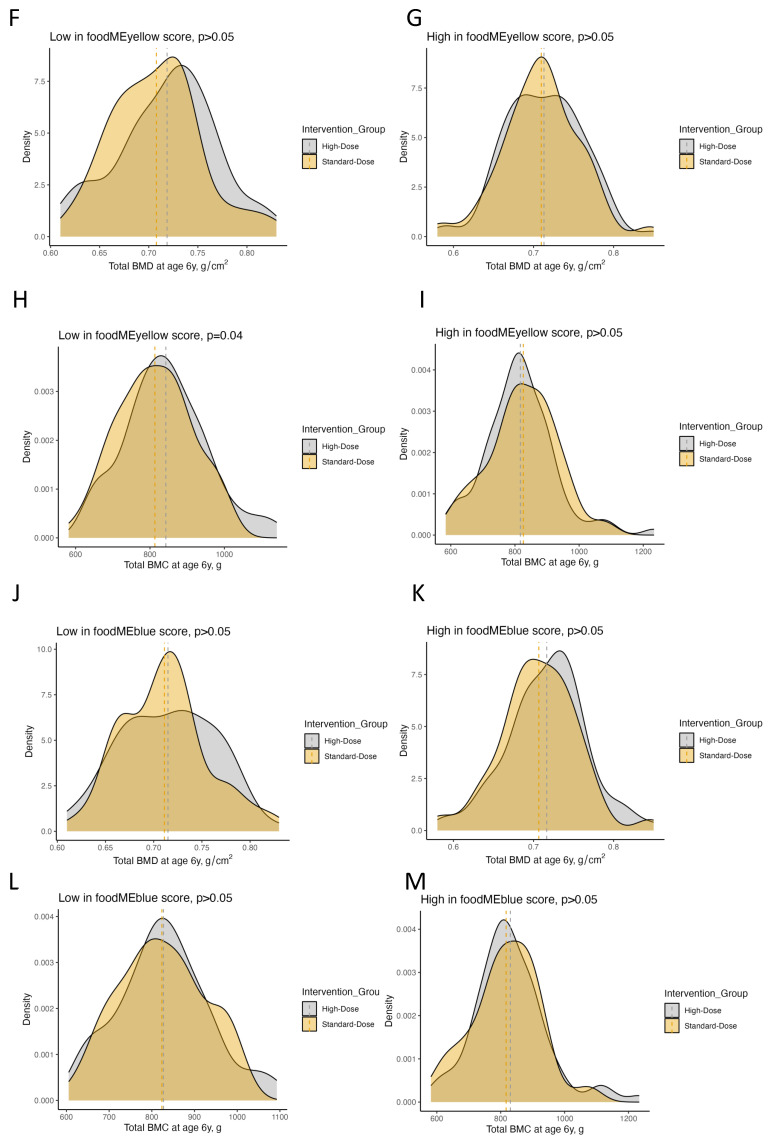
We previously demonstrated a beneficial effect of high-dose vitamin D in pregnancy on offspring bone and dental health. Here, we investigated the effect of maternal dietary patterns during pregnancy on the risk of bone fractures, bone mineralization and enamel defects until age 6 years in the offspring. Further, the influence of diet on the effect of high-dose vitamin D was analyzed in the COPSAC2010 mother-child cohort including 623 mother-child pairs. A weighted network analysis on FFQs revealed three specific maternal dietary patterns that associated (Bonferroni p < 0.05) with both offspring bone and dental health. The effect of prenatal high-dose (2800 IU/day) vs. standard-dose (400 IU/day) vitamin D on offspring bone mineral content (adjusted mean difference (aMD): 33.29 g, 95% CI: 14.48-52.09, p < 0.001), bone mineral density (aMD: 0.02 g/cm2 (0.01-0.04), p < 0.001), fracture risk (adjusted incidence rate ratio: 0.36 (0.16-0.84), p = 0.02), and enamel defects in primary (adjusted odds ratio (aOR): 0.13 (0.03-0.58), p < 0.01) and permanent molars (aOR: 0.25; (0.10-0.63), p < 0.01) was most pronounced when mothers had lower intake of fruit, vegetables, meat, eggs, sweets, whole grain, offal and fish. This study suggests that prenatal dietary patterns influence offspring bone and dental development, and should be considered in order to obtain the full benefits of vitamin D to enhance personalized supplementation strategy.

Keywords: bone health; dental health; pregnancy diet; vitamin D.


Conflict of interest statement

All authors declare no potential, perceived, or real conflicts of interest regarding the content of this manuscript.

Figures

Figure 1
Figure 1
Circos plot showing association between maternal dietary patterns during pregnancy (food modules derived from FFQ WGCNA) and offspring bone and dental outcomes. Blue line represents a positive association at Bonferroni p < 0.05 level, purple line represents a positive association at nominal p < 0.05 level. Red line represents a negative association at Bonferroni p < 0.05 level.
Figure 2
Figure 2
Heatmap of the three food modules which were found to associate with at least one bone or dental outcome and food items. Correlation key: blue represents positive Pearson’s correlations (p < 0.05), red represents negative Pearson’s correlations (p < 0.05) and grey presents non-significant correlations.
Figure 3
Figure 3
Maternal gestation week 24 metabolome vs. food modules. (A,C,E,G,I,K,M,N) Volcano plot showing a summary of linear regression between metabolite level and food module. Each dot represents a metabolite; different colors indicate metabolic super-pathways in which metabolites are involved. The x-axis indicates a change in metabolite level (per SD) with food module score, while the y-axis indicates association strength in terms of log10 of p-value. (B,D,F,H,J,L) Pathway enrichment analysis based on metabolites with Bonferroni p < 0.05. The y-axis indicates the metabolic sub-pathway name, while the x-axis indicates the logarithm of the enriched factor in each pathway. The bubble size and color indicate the p value. There was no enrichment analysis for two food modules, grey and turquoise, as no metabolite was found to associate at Bonferroni p < 0.05 level.
Figure 3
Figure 3
Maternal gestation week 24 metabolome vs. food modules. (A,C,E,G,I,K,M,N) Volcano plot showing a summary of linear regression between metabolite level and food module. Each dot represents a metabolite; different colors indicate metabolic super-pathways in which metabolites are involved. The x-axis indicates a change in metabolite level (per SD) with food module score, while the y-axis indicates association strength in terms of log10 of p-value. (B,D,F,H,J,L) Pathway enrichment analysis based on metabolites with Bonferroni p < 0.05. The y-axis indicates the metabolic sub-pathway name, while the x-axis indicates the logarithm of the enriched factor in each pathway. The bubble size and color indicate the p value. There was no enrichment analysis for two food modules, grey and turquoise, as no metabolite was found to associate at Bonferroni p < 0.05 level.
Figure 4
Figure 4
Plots showing the effect of high-dose vitamin D supplementation during pregnancy on offspring bone and dental outcomes at age 6 years stratified by low vs. high food module scores in for turquoise, yellow and blue food modules. (A) Forrest plot showing estimates for bone fracture frequency in terms of adjusted incidence rate risk (aIRR) and enamel defect status (no/yes) until age 6 years in terms of adjusted odds ratio (aOR). (BM) Density plots showing the distribution of BMC and BMD in the high-dose and standard-dose vitamin D supplementation groups stratified by low vs. high food module scores. Abbreviations: BMC, bone mineral content; BMD, bone mineral density.
Figure 4
Figure 4
Plots showing the effect of high-dose vitamin D supplementation during pregnancy on offspring bone and dental outcomes at age 6 years stratified by low vs. high food module scores in for turquoise, yellow and blue food modules. (A) Forrest plot showing estimates for bone fracture frequency in terms of adjusted incidence rate risk (aIRR) and enamel defect status (no/yes) until age 6 years in terms of adjusted odds ratio (aOR). (BM) Density plots showing the distribution of BMC and BMD in the high-dose and standard-dose vitamin D supplementation groups stratified by low vs. high food module scores. Abbreviations: BMC, bone mineral content; BMD, bone mineral density.

Similar articles

Cited by

References

    1. DeLuca H.F. Overview of general physiologic features and functions of vitamin D. Am. J. Clin. Nutr. 2004;80:1689S–1696S. doi: 10.1093/ajcn/80.6.1689S. - DOI - PubMed
    1. Koussoulakou D.S., Margaritis L.H., Koussoulakos S.L. A curriculum vitae of teeth: Evolution, generation, regeneration. Int. J. Biol. Sci. 2009;5:226–243. doi: 10.7150/ijbs.5.226. - DOI - PMC - PubMed
    1. Schroth R.J., Christensen J., Morris M., Gregory P., Mittermuller B.A., Rockman-Greenberg C. The Influence of Prenatal Vitamin D Supplementation on Dental Caries in Infants. J. Can. Dent. Assoc. 2020;86:k13. - PubMed
    1. Schroth R.J., Lavelle C., Tate R., Bruce S., Billings R.J., Moffatt M.E. Prenatal vitamin D and dental caries in infants. Pediatrics. 2014;133:e1277–e1284. doi: 10.1542/peds.2013-2215. - DOI - PubMed
    1. van der Tas J.T., Elfrink M.E.C., Heijboer A.C., Rivadeneira F., Jaddoe V.W.V., Tiemeier H., Schoufour J.D., Moll H.A., Ongkosuwito E.M., Wolvius E.B., et al. Foetal, neonatal and child vitamin D status and enamel hypomineralization. Community Dent. Oral. Epidemiol. 2018;46:343–351. doi: 10.1111/cdoe.12372. - DOI - PMC - PubMed