

Biochemical Profiling of Urine Metabolome in Premature Infants Based on LC-MS Considering Maternal Influence
- PMID: 38337695
- PMCID: PMC10857068
- DOI: 10.3390/nu16030411
Biochemical Profiling of Urine Metabolome in Premature Infants Based on LC-MS Considering Maternal Influence
Abstract
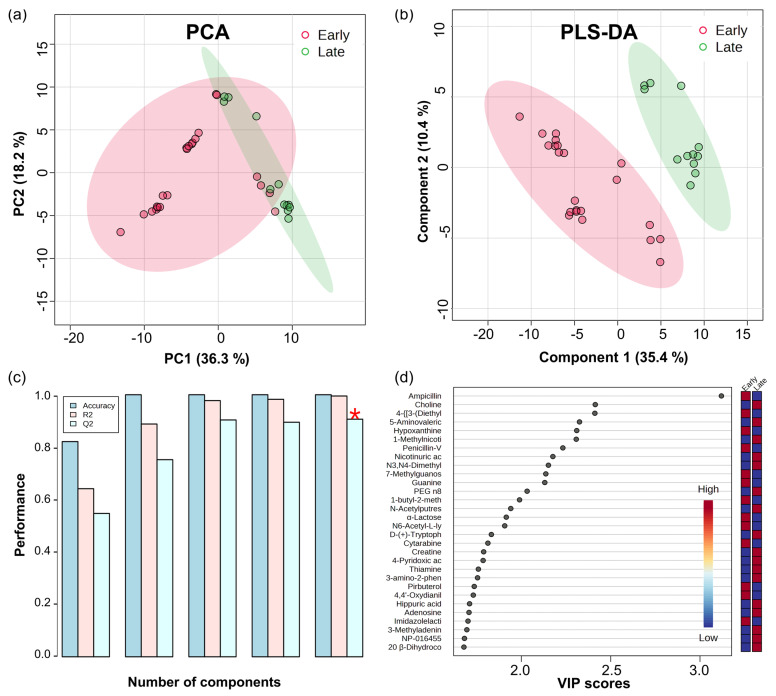
In this study, Liquid Chromatography-Mass Spectrometry (LC-MS)-based metabolomics profiling was conducted to elucidate the urinary profiles of premature infants during early and late postnatal stages. As a result, we discovered significant excretion of maternal drugs in early-stage infants and identified crucial metabolites like hormones and amino acids. These findings shed light on the maternal impact on neonatal metabolism and underscore the beneficial effects of breastfeeding on the metabolism of essential amino acids in infants. This research not only enhances our understanding of maternal-infant nutritional interactions and their long-term implications for preterm infants but also offers critical insights into the biochemical characteristics and physiological mechanisms of preterm infants, laying a groundwork for future clinical studies focused on neonatal development and health.
Keywords: LC−MS; amino acid; human milk; maternal nutrition; metabolomics; neurotransmitter; premature infant.
Conflict of interest statement
The authors declare no conflict of interest. S.C. and J.-M.P. are employees of Basil Biotech. This paper reflects the views of the scientists and not the company.
Figures


Similar articles
-
Validation and Application of Biocrates AbsoluteIDQ® p180 Targeted Metabolomics Kit Using Human Milk.Nutrients. 2019 Jul 26;11(8):1733. doi: 10.3390/nu11081733. Nutrients. 2019. PMID: 31357543 Free PMC article.
-
Targeted LC-MS/MS profiling of bile acids reveals primary/secondary bile acid ratio as a novel biomarker for necrotizing enterocolitis.Anal Bioanal Chem. 2024 Jan;416(1):287-297. doi: 10.1007/s00216-023-05017-7. Epub 2023 Nov 8. Anal Bioanal Chem. 2024. PMID: 37938412 Free PMC article.
-
Targeted urine metabolomics in preterm neonates with intraventricular hemorrhage.J Chromatogr B Analyt Technol Biomed Life Sci. 2019 Jan 1;1104:240-248. doi: 10.1016/j.jchromb.2018.11.024. Epub 2018 Nov 22. J Chromatogr B Analyt Technol Biomed Life Sci. 2019. PMID: 30530117
-
Targeting human urinary metabolome by LC-MS/MS: a review.Bioanalysis. 2018 Apr 1;10(7):489-516. doi: 10.4155/bio-2017-0285. Epub 2018 Mar 21. Bioanalysis. 2018. PMID: 29561651 Review.
-
The evolution of methods for urinary steroid metabolomics in clinical investigations particularly in childhood.J Steroid Biochem Mol Biol. 2018 Jul;181:28-51. doi: 10.1016/j.jsbmb.2018.02.013. Epub 2018 Feb 23. J Steroid Biochem Mol Biol. 2018. PMID: 29481855 Review.
References
-
- Dewey K.G. Protecting Infants through Human Milk. Springer; Boston, MA, USA: 2004. Impact of Breastfeeding on Maternal Nutritional Status; pp. 91–100. - PubMed
-
- Khalili Doroodzani A., Dobaradaran S., Zarei S., Raeisi A., Mahmoodi M., Rahmani E., Nabipour I., Saeedi R., Mahmudpour M., Akbarzadeh S., et al. Maternal and fetal exposure to metal (loid)s, maternal nutrition status, and impact on prenatal growth in an energy rich zone and an urban area along the Persian Gulf. Environ. Pollut. 2022;309:119779. doi: 10.1016/j.envpol.2022.119779. - DOI - PubMed
MeSH terms
Grants and funding
LinkOut - more resources
Full Text Sources
Medical
Research Materials
