. 2024 Jan 23;25(3):1389.
doi: 10.3390/ijms25031389.

Multiplexed Imaging Mass Cytometry Analysis in Preclinical Models of Pancreatic Cancer

Affiliations

Multiplexed Imaging Mass Cytometry Analysis in Preclinical Models of Pancreatic Cancer

Marco Erreni et al. Int J Mol Sci. .

Abstract

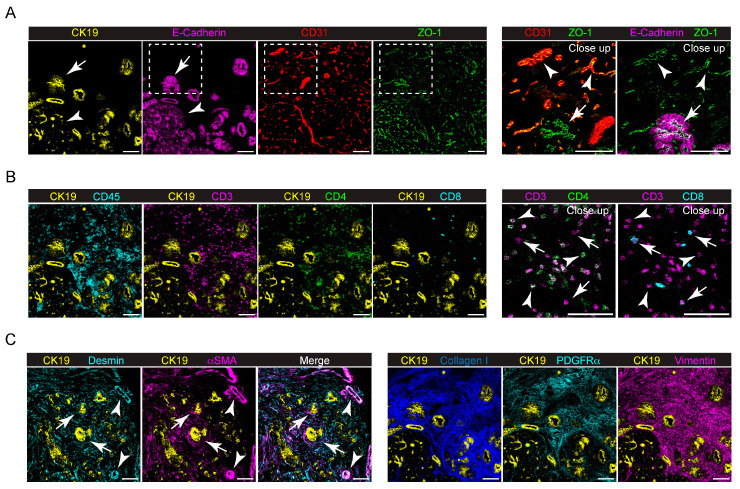
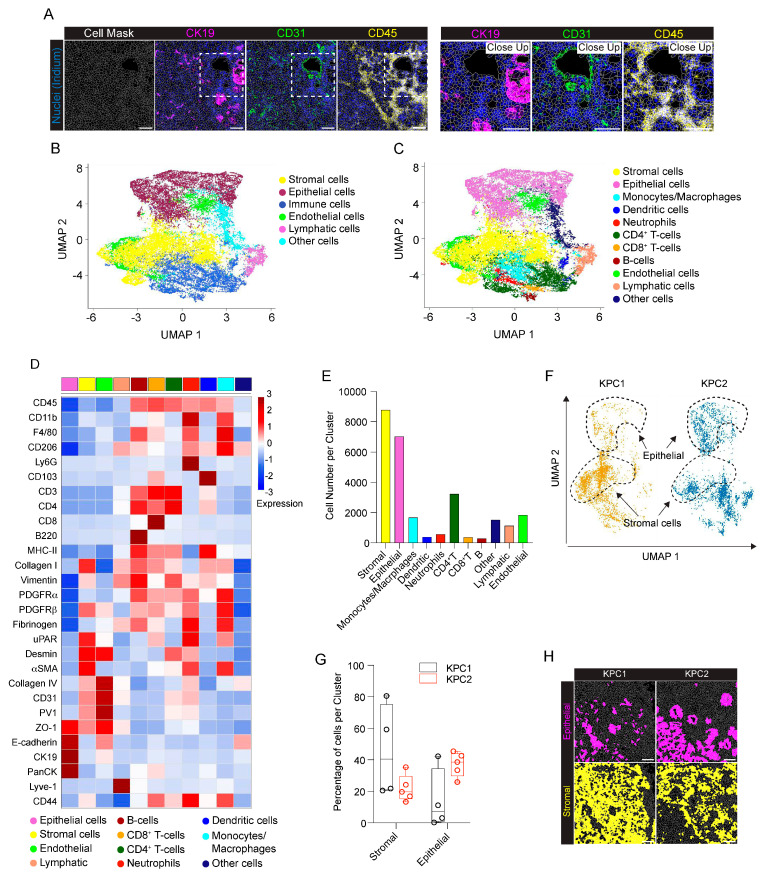
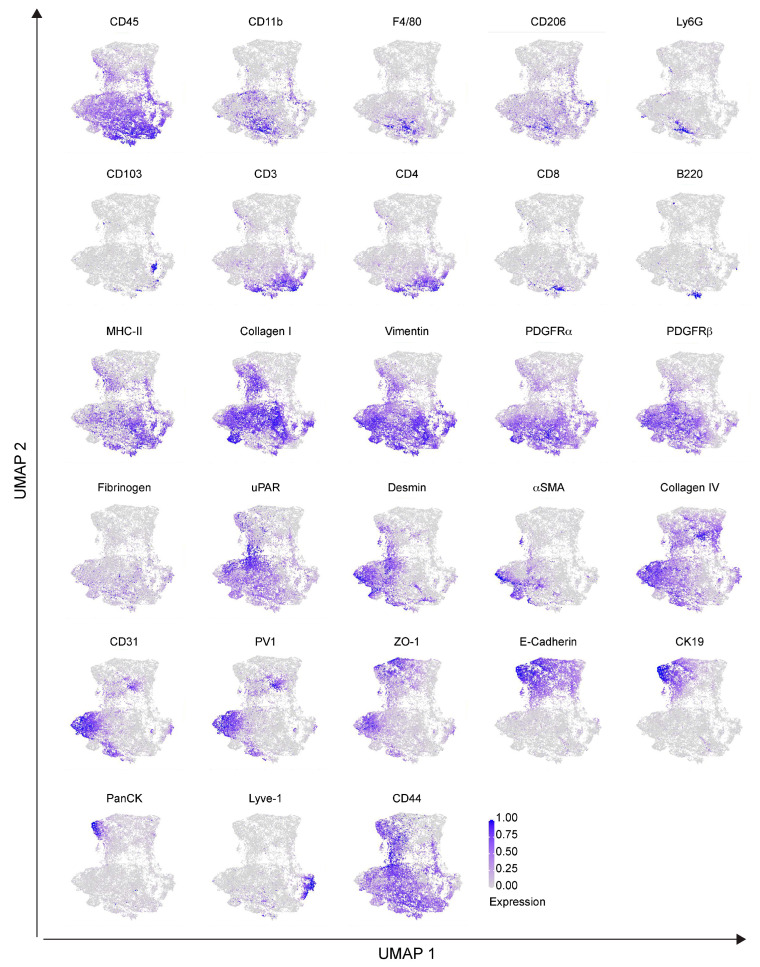
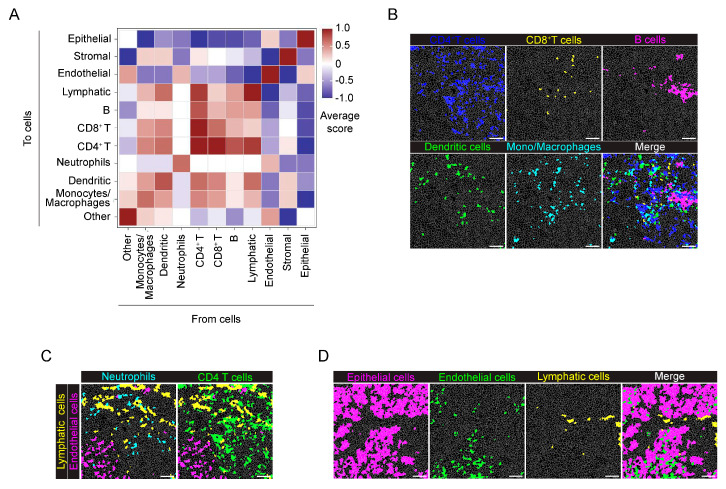
Pancreatic ductal adenocarcinoma (PDAC) is one of the most lethal cancers. PDAC is characterized by a complex tumor microenvironment (TME), that plays a pivotal role in disease progression and resistance to therapy. Investigating the spatial distribution and interaction of TME cells with the tumor is the basis for understanding the mechanisms underlying disease progression and represents a current challenge in PDAC research. Imaging mass cytometry (IMC) is the major multiplex imaging technology for the spatial analysis of tumor heterogeneity. However, there is a dearth of reports of multiplexed IMC panels for different preclinical mouse models, including pancreatic cancer. We addressed this gap by utilizing two preclinical models of PDAC: the genetically engineered, bearing KRAS-TP53 mutations in pancreatic cells, and the orthotopic, and developed a 28-marker panel for single-cell IMC analysis to assess the abundance, distribution and phenotypes of cells involved in PDAC progression and their reciprocal functional interactions. Herein, we provide an unprecedented definition of the distribution of TME cells in PDAC and compare the diversity between transplanted and genetic disease models. The results obtained represent an important and customizable tool for unraveling the complexities of PDAC and deciphering the mechanisms behind therapy resistance.

Keywords: PDAC; imaging mass cytometry; multiplexed imaging; pancreatic cancer; preclinical models.


Conflict of interest statement

The authors declare no conflicts of interest.

Figures

Figure 1
Figure 1
Expression of different markers at the tumor–stroma interface of the orthotopic PDAC model detected by IMC. (A) Left panel, representative images showing the extracted signal contributions of Collagen I (yellow), Desmin (blue), CD31 (green), αSMA (cyan) and ZO–1 (magenta). White arrowheads indicate blood vessels (CD31+, green) colocalizing with Desmin+ and αSMA+ cells. Right panel, representative images showing the signal contributions of CD31+ (green), LYVE1+ (yellow) and ZO–1+ cells. White arrowheads, lymphatic vessels; white arrows, blood vessels. (B) Upper, left, representative images showing the signal contributions of ZO–1+ (magenta), CD45+ (yellow), CD3+ (magenta), CD4+ (green) and CD8+ (cyan) cells. Upper, right, close up images of the yellow dashed inset showing the different localizations of CD3+ (magenta) and CD4+ (green) cells (white arrows) compared to CD3+ (magenta) and CD8+ (cyan) cells (white arrowheads). Lower, representative images showing the localization of B220+ (yellow), CD103+ (cyan), CD11b+ (green), F4/80+ (magenta) and Ly6G+ (yellow) cells. The dashed white line delineates stromal–rich (S) and tumor–cell–rich (T) regions. Bar, 100 μm.
Figure 2
Figure 2
IMC analysis of the orthotopic PDAC model. (A) Representative images (left) and close up images (right) of cell segmentation in the tumor core and margin. The cell contour (gray) is overlaid on the IMC acquisition of nuclei (Ir, blue) and ZO−1+ tumor cells (magenta), CD31+ endothelial cells (green) and CD45+ immune cells (yellow). Bar 100 µm. (B) UMAP representation, over all the acquired images, of tumor core and tumor margin cells annotated into 6 phenotypic clusters, as in the legend. The dashed black lines indicate cells mainly associated with the stromal tissue surrounding the tumor mass. (C) The same UMAP representations as in panel (B) showing the detailed annotation of immune cell subpopulations: monocytes/macrophages, dendritic cells, neutrophils, CD4+ T cells, CD8+ T cells and B cells. Colors as in the legend. The dashed black lines indicate cells mainly associated with the stromal tissue surrounding the tumor mass. (D) Heatmap of the mean signal intensity of single markers among the different clusters over all the acquired images. (E) Abundance of cells per phenotypic cluster for the tumor core and tumor margin. Dots represent single ROIs. Colors as in the legend. (F) Abundance of cells in the immune clusters for the tumor core and tumor margin. Dots represent single ROIs. Colors as in the legend. (G) Representative images showing the tissue localization of segmented cells (gray contours) belonging to epithelial (magenta), immune (blue), stromal (yellow), macrophage (green), B cell (yellow) and neutrophil (cyan) clusters in the tumor core and tumor margin. Bar, 100 μm. n= 3 to 6 ROIs for each mouse (n = 4). Total acquired ROIs: core, n = 8; margin, n = 9. (E,F) Two-way ANOVA plus Šídák’s multiple comparisons test. * p < 0.05, *** p < 0.001.
Figure 3
Figure 3
Single marker expression in the orthotopic PDAC model. Single markers’ normalized expression in all the segmented cells from the orthotopic model represented on UMAP. n = 3 to 6 ROIs for each mouse (n = 4). Total acquired ROIs: core: n = 8; margin: n = 9.
Figure 4
Figure 4
Neighborhood analysis of the orthotopic PDAC model. (A) The heatmap shows the average proximity score for each pair of cell phenotypic clusters, averaged over all the acquired ROIs (8 ROIs). Positive (red) or negative (blue) values indicate that a specific pair of phenotypes is neighboring significantly more often or significantly less often, respectively, than expected from randomized placement, as described in Section 4. A 30 μm radius is considered for cell−to−cell proximity. (B) Tumor margin, as in panel (A), averaged over all the acquired ROIs (9 ROIs). A 30 μm radius is considered for cell−to−cell proximity. (C) Representative images showing the distribution of cells belonging to the monocyte/macrophage (cyan), CD8+ T cell (yellow), dendritic cell (green), neutrophil (cyan), CD4+ T cell (blue) and B cell (yellow) clusters with the tumor cell (magenta) cluster over the cell mask, in the tumor core and margin. (D) Representative images showing the arrangement of cells belonging to the endothelial (magenta) and lymphatic (cyan) clusters in relation to the stromal cluster (yellow) in the tumor core and tumor margin, white arrows: Endothelial, green arrowss: Lymphaic. Bar, 100 μm. n = 3 to 6 ROIs for each mouse (n = 4). Total acquired ROIs: core: n = 8; margin: n = 9.
Figure 5
Figure 5
Expression of different markers in the KPC genetic model detected by IMC. (A) Left, representative images showing the extracted signal contributions of CK19+ (yellow), E−cadherin+ (magenta), CD31+ (red) and ZO−1+ (green) cell signals. Right, close−up of the white dashed boxes showing the colocalization of ZO−1+ cells with CD31+ (white arrowheads) and E−cadherin (white arrows). (B) Left, representative images showing CK19+ (yellow) cell distribution with CD45+ (cyan), CD3+ (magenta), CD4+ (green) and CD8+ (cyan) cell signals in the KPC model. Right, the close−up shows the identification of CD3+ CD4+ (white arrowheads) and CD3+ CD8+ (white arrows) cells. (C) Left, representative images showing the colocalization of CK19+ (yellow), Desmin+ (cyan) and αSMA+ (magenta) cells in KPC. White arrowheads indicate Desmin+ and αSMA+ cells surrounding CK19+ tumor cells. White arrows indicate Desmin+ and αSMA+ cells surrounding tumor vessels. Right, expression of Collagen I (blue), PDGFRα+ (cyan) and Vimentin+ (magenta) cells in KPC, surrounding CK19+ tumor cells (yellow). Bar, 100 μm.
Figure 6
Figure 6
IMC analysis of the genetic KPC model. (A) Representative images of cell segmentation in the KPC model. The cell mask (gray lines) is overlaid to the IMC acquisition of nuclei (Ir, blue) and CK19+ tumor cells (magenta), CD31+ endothelial cells (green) and CD45+ immune cells (yellow). Right, close up images of the white dashed region in A. Bar, 100 μm. (B) UMAP representation of the KPC model segmented cells annotated as 6 phenotypic clusters. Colors as in the legend. (C) Detailed annotation of immune cell subpopulations, namely monocytes/macrophages, dendritic cells, neutrophils, CD4+ T cells, CD8+ T cells and B cells (colors as in the legend) represented on the same UMAP reduction as in panel (B). (D) Heatmap of the average expression of the single markers among the different clusters, over all the acquired images. (E) The bar plot shows the number of annotated cells for every identified cluster. Colors as in the legend. (F) UMAP representation of segmented cells of two different ROIs from KPC1 and KPC2 mice. Black−dashed lines delimit the regions corresponding to the localization of epithelial (top) and stromal (bottom) phenotypic clusters. (G) The box plot shows the difference in the number of cells in the stromal and epithelial clusters between KPC1 and KPC2 mice. Dots represent single ROIs. Colors as in the legend. Stromal: p = 0.12; epithelial: p = 0.13, two−way ANOVA plus Šídák’s multiple comparisons test. (H) Representative images of the different distribution of cells belonging to epithelial (magenta) and stromal (yellow) clusters in KPC1 and KPC2 mice. Scalebar: 100 μm. n = 4 to 5 ROIs for each mouse (n = 2). Total acquired ROIs: KPC1, n = 4; KPC2, n = 5.
Figure 7
Figure 7
Single marker expression in the genetic KPC model. UMAP representation of single markers’ normalized expression in all the segmented cells from the KPC model. n = 4 to 5 ROIs for each mouse (n = 2). Total acquired ROIs: KPC1, n = 4; KPC2, n = 5.
Figure 8
Figure 8
Neighborhood analysis of the genetic KPC model. (A) The heatmap shows the proximity score for each pair of cell phenotypic clusters, averaged over all the acquired ROIs (n = 9). Positive (red) or negative (blue) values indicate that a specific pair of phenotypic classes is neighboring significantly more or significantly less often, respectively, than expected from randomized placement. A 30 μm radius was considered for cell−to−cell proximity. (B) Representative images showing the localization of cells belonging to the CD4+ T cell (blue), CD8+ T cell (yellow), B cell (magenta), dendritic (green) cell and monocyte/macrophage (cyan) clusters over the cell mask (gray lines). The merged image highlights the close proximity of these immune cell clusters. (C) Representative images showing the localization of cells belonging to lymphatic (yellow), endothelial (magenta), neutrophil (cyan) and CD4+ T cell (green) clusters over the cell mask. (D) Representative images showing the localization of cells belonging to epithelial (magenta), endothelial (green) and lymphatic (yellow) clusters over the cell mask. Gray lines depict single cell contours. Bar, 100 μm. n = 4 to 5 ROIs for each mouse (n = 2). Total acquired ROIs: KPC1, n = 4; KPC2, n = 5.

Similar articles

Cited by

References

    1. Ho W.J., Jaffee E.M., Zheng L. The tumour microenvironment in pancreatic cancer—Clinical challenges and opportunities. Nat. Rev. Clin. Oncol. 2020;17:527–540. doi: 10.1038/s41571-020-0363-5. - DOI - PMC - PubMed
    1. Sherman M.H., Beatty G.L. Tumor Microenvironment in Pancreatic Cancer Pathogenesis and Therapeutic Resistance. Annu. Rev. Pathol. 2023;18:123–148. doi: 10.1146/annurev-pathmechdis-031621-024600. - DOI - PMC - PubMed
    1. Halbrook C.J., Lyssiotis C.A., Pasca di Magliano M., Maitra A. Pancreatic cancer: Advances and challenges. Cell. 2023;186:1729–1754. doi: 10.1016/j.cell.2023.02.014. - DOI - PMC - PubMed
    1. von Ahrens D., Bhagat T.D., Nagrath D., Maitra A., Verma A. The role of stromal cancer-associated fibroblasts in pancreatic cancer. J. Hematol. Oncol. 2017;10:76. doi: 10.1186/s13045-017-0448-5. - DOI - PMC - PubMed
    1. Bulle A., Lim K.H. Beyond just a tight fortress: Contribution of stroma to epithelial-mesenchymal transition in pancreatic cancer. Signal Transduct. Target. Ther. 2020;5:249. doi: 10.1038/s41392-020-00341-1. - DOI - PMC - PubMed

MeSH terms