. 2024 Jan 30;25(3):1713.
doi: 10.3390/ijms25031713.

Asynchronous Pattern of MAPKs' Activity during Aging of Different Tissues and of Distinct Types of Skeletal Muscle

Affiliations

Asynchronous Pattern of MAPKs' Activity during Aging of Different Tissues and of Distinct Types of Skeletal Muscle

Nechama Gilad et al. Int J Mol Sci. .

Abstract

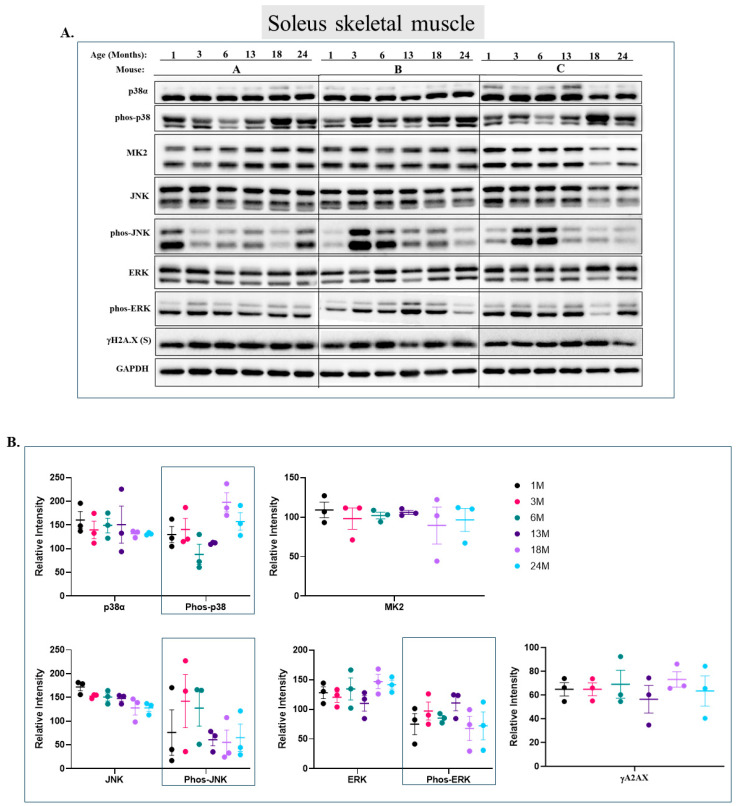
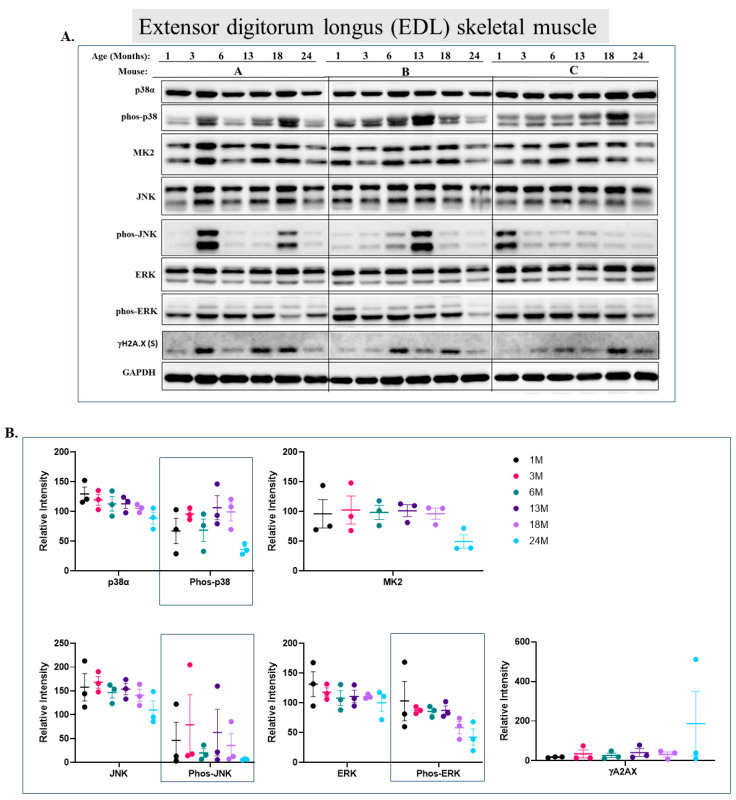
The MAPK p38α was proposed to be a prominent promoter of skeletal muscle aging. The skeletal muscle tissue is composed of various muscle types, and it is not known if p38α is associated with aging in all of them. It is also not known if p38α is associated with aging of other tissues. JNK and ERK were also proposed to be associated with aging of several tissues. Nevertheless, the pattern of p38α, JNK, and ERK activity during aging was not documented. Here, we documented the levels of phosphorylated/active p38α, Erk1/2, and JNKs in several organs as well as the soleus, tibialis anterior, quadriceps, gastrocnemius, and EDL muscles of 1-, 3-, 6-, 13-, 18-, and 24-month-old mice. We report that in most tissues and skeletal muscles, the MAPKs' activity does not change in the course of aging. In most tissues and muscles, p38α is in fact active at younger ages. The quadriceps and the lungs are exceptions, where p38α is significantly active only in mice 13 months old or older. Curiously, levels of active JNK and ERKs are also elevated in aged lungs and quadriceps. RNA-seq analysis of the quadriceps during aging revealed downregulation of proteins related to the extra-cellular matrix (ECM) and ERK signaling. A panel of mRNAs encoding cell cycle inhibitors and senescence-associated proteins, considered to be aging markers, was not found to be elevated. It seems that the pattern of MAPKs' activation in aging, as well as expression of known 'aging' components, are tissue- and muscle type-specific, supporting a notion that the process of aging is tissue- and even cell-specific.

Keywords: ERK; JNK; MAPKs; p38.


Conflict of interest statement

The authors declare no conflict of interest.

Figures

Figure 1
Figure 1
Marginal elevation in phosphorylation of p38α, but not of ERKs and JNK, in the gastrocnemius during aging. (A) Western blot analysis of protein lysates prepared from the gastrocnemius of wild-type mice, collected at the indicated age and tested with the indicated antibodies. Three mice were sacrificed at each age and were marked A, B, and C. (B) Relative intensity of Western blots presented in panel A, as measured by ImageJ and normalized to the levels of GAPDH. Statistical analysis revealed no significant differences.
Figure 2
Figure 2
p38γ and p38α seem to undergo massive post-translational modifications during aging of skeletal muscle. Protein lysates prepared from gastrocnemius of the mice marked A in Figure 1A were analyzed by Western blot that was probed with a mix of anti-phos-p38 plus anti-p38γ (upper panel) or p38α (lower panel) antibodies and then with a mix of fluorescent secondary antibodies that mark p38γ or p38α in red and phosphorylated p38 in green (see details in Section 4).
Figure 3
Figure 3
p38α and Erk1/2 are strongly activated in the quadriceps during aging. (A) Western blot analysis of protein lysates prepared from the quadriceps of wild-type mice, collected at the indicated age and tested with the indicated antibodies. Three mice were sacrificed at each age and were marked A, B, and C. (B) Relative intensity of Western blot results presented in panel A, as measured by ImageJ and normalized to the levels of GAPDH. Statistical significance of the differences of expression levels between 1- and 24-month-old and between 1- and 18-month-old mice was determined by an unpaired two-tailed t-test using GRAPHPAD PRISM software (v9.5.1) (ns = non-significant. Asterisks (*) p-value < 0.05).
Figure 3
Figure 3
p38α and Erk1/2 are strongly activated in the quadriceps during aging. (A) Western blot analysis of protein lysates prepared from the quadriceps of wild-type mice, collected at the indicated age and tested with the indicated antibodies. Three mice were sacrificed at each age and were marked A, B, and C. (B) Relative intensity of Western blot results presented in panel A, as measured by ImageJ and normalized to the levels of GAPDH. Statistical significance of the differences of expression levels between 1- and 24-month-old and between 1- and 18-month-old mice was determined by an unpaired two-tailed t-test using GRAPHPAD PRISM software (v9.5.1) (ns = non-significant. Asterisks (*) p-value < 0.05).
Figure 4
Figure 4
Phosphorylation levels of p38α, ERKs, and JNK are essentially constant in the soleus during aging. (A) Western blot analysis of protein lysates prepared from soleus skeletal muscle of wild-type mice, collected at the indicated age and tested with the indicated antibodies. Three mice were sacrificed at each age and were marked A, B, and C. (B) Relative intensity of Western blot results presented in panel A, as measured by ImageJ and normalized to the levels of GAPDH. Statistical analysis revealed no significant differences.
Figure 5
Figure 5
Phosphorylation levels of p38α, ERKs, and JNK are essentially constant in the tibialis anterior during aging. (A) Western blot analysis of protein lysates prepared from the tibialis anterior of wild-type mice, collected at the indicated age and tested with the indicated antibodies. Three mice were sacrificed at each age and were marked A, B, and C. (B) Relative intensity of Western blot results presented in panel A, as measured by ImageJ and normalized to the levels of GAPDH. Statistical analysis revealed no significant differences.
Figure 6
Figure 6
Phosphorylation levels of p38α and ERKs are essentially constant in the EDL during aging. (A) Western blot analysis of protein lysates prepared from the EDL of wild-type mice, collected at the indicated age and tested with the indicated antibodies. Three mice were sacrificed at each age and were marked A, B, and C. (B) Relative intensity of Western blot results presented in panel A, as measured by ImageJ and normalized to the levels of GAPDH. Statistical analysis revealed no significant differences.
Figure 7
Figure 7
Phosphorylation of p38α, JNK, and Erk1/2 is enhanced in the lungs during aging. (A) Western blot analysis of protein lysates prepared from the lungs of wild-type mice, collected at the indicated age and tested with the indicated antibodies. Three mice were sacrificed at each age and were marked A, B, and C. (B) Relative intensity of Western blot results presented in panel A, as measured by ImageJ and normalized to the levels of GAPDH. Statistical significance of the differences of expression levels between 1- and 24-month-old and between 1- and 18-month-old mice was determined by an unpaired two-tailed t-test using GRAPHPAD PRISM software (v9.5.1) (ns = non-significant. Asterisks (*) mark p-value < 0.05).
Figure 7
Figure 7
Phosphorylation of p38α, JNK, and Erk1/2 is enhanced in the lungs during aging. (A) Western blot analysis of protein lysates prepared from the lungs of wild-type mice, collected at the indicated age and tested with the indicated antibodies. Three mice were sacrificed at each age and were marked A, B, and C. (B) Relative intensity of Western blot results presented in panel A, as measured by ImageJ and normalized to the levels of GAPDH. Statistical significance of the differences of expression levels between 1- and 24-month-old and between 1- and 18-month-old mice was determined by an unpaired two-tailed t-test using GRAPHPAD PRISM software (v9.5.1) (ns = non-significant. Asterisks (*) mark p-value < 0.05).
Figure 8
Figure 8
Phosphorylation levels of p38α, JNK, and ERKs are essentially constant in the heart during aging. (A) Western blot analysis of protein lysates prepared from the hearts of wild-type mice, collected at the indicated age and tested with the indicated antibodies. Three mice were sacrificed at each age and were marked A, B, and C. (B) Relative intensity of Western blot results presented in panel A, as measured by ImageJ then normalized to the levels of GAPDH. Statistical analysis revealed no significant differences.
Figure 8
Figure 8
Phosphorylation levels of p38α, JNK, and ERKs are essentially constant in the heart during aging. (A) Western blot analysis of protein lysates prepared from the hearts of wild-type mice, collected at the indicated age and tested with the indicated antibodies. Three mice were sacrificed at each age and were marked A, B, and C. (B) Relative intensity of Western blot results presented in panel A, as measured by ImageJ then normalized to the levels of GAPDH. Statistical analysis revealed no significant differences.
Figure 9
Figure 9
Phosphorylation levels of p38α, JNK, and ERKs are essentially constant in the brain during aging. (A) Western blot analysis of protein lysates prepared from the brains of wild-type mice, collected at the indicated age and tested with the indicated antibodies. Three mice were sacrificed at each age and were marked A, B, and C. (B) Relative intensity of Western blot results presented in panel A, as measured by ImageJ then normalized to the levels of GAPDH. Statistical analysis revealed no significant differences.
Figure 9
Figure 9
Phosphorylation levels of p38α, JNK, and ERKs are essentially constant in the brain during aging. (A) Western blot analysis of protein lysates prepared from the brains of wild-type mice, collected at the indicated age and tested with the indicated antibodies. Three mice were sacrificed at each age and were marked A, B, and C. (B) Relative intensity of Western blot results presented in panel A, as measured by ImageJ then normalized to the levels of GAPDH. Statistical analysis revealed no significant differences.
Figure 10
Figure 10
Phosphorylation levels of p38α, JNK, and ERKs are essentially constant in the kidney during aging. (A) Western blot analysis of protein lysates prepared from the kidneys of wild-type mice, collected at the indicated age and tested with the indicated antibodies. Three mice were sacrificed at each age and were marked A, B, and C. (Note: ERK and phos-ERK were probed on the same membrane with a stripping step). (B) Relative intensity of Western blot results presented in panel A, as measured by ImageJ then normalized to the levels of GAPDH. Statistical analysis revealed no significant differences.
Figure 10
Figure 10
Phosphorylation levels of p38α, JNK, and ERKs are essentially constant in the kidney during aging. (A) Western blot analysis of protein lysates prepared from the kidneys of wild-type mice, collected at the indicated age and tested with the indicated antibodies. Three mice were sacrificed at each age and were marked A, B, and C. (Note: ERK and phos-ERK were probed on the same membrane with a stripping step). (B) Relative intensity of Western blot results presented in panel A, as measured by ImageJ then normalized to the levels of GAPDH. Statistical analysis revealed no significant differences.
Figure 11
Figure 11
Phosphorylation levels of p38α, JNK, and ERKs are essentially constant in the spleen during aging. (A) Western blot analysis of protein lysates prepared from the spleens of wild-type mice, collected at the indicated age and tested with the indicated antibodies. Three mice were sacrificed at each age and were marked A, B, and C. (B) Relative intensity of Western blot results presented in panel A, as measured by ImageJ then normalized to the levels of GAPDH. Statistical analysis revealed no significant differences.
Figure 11
Figure 11
Phosphorylation levels of p38α, JNK, and ERKs are essentially constant in the spleen during aging. (A) Western blot analysis of protein lysates prepared from the spleens of wild-type mice, collected at the indicated age and tested with the indicated antibodies. Three mice were sacrificed at each age and were marked A, B, and C. (B) Relative intensity of Western blot results presented in panel A, as measured by ImageJ then normalized to the levels of GAPDH. Statistical analysis revealed no significant differences.
Figure 12
Figure 12
Phosphorylation of JNK, but not of p38α or Erk1/2, is elevated in liver during aging. (A) Western blot analysis of protein lysates prepared from the livers of wild-type mice, collected at the indicated age and tested with the indicated antibodies. Two mice were sacrificed at each age and were marked A and B. (B) Relative intensity of Western blot results presented in panel A, as measured by ImageJ then normalized to the levels of GAPDH. Statistical analysis revealed no significant differences.
Figure 12
Figure 12
Phosphorylation of JNK, but not of p38α or Erk1/2, is elevated in liver during aging. (A) Western blot analysis of protein lysates prepared from the livers of wild-type mice, collected at the indicated age and tested with the indicated antibodies. Two mice were sacrificed at each age and were marked A and B. (B) Relative intensity of Western blot results presented in panel A, as measured by ImageJ then normalized to the levels of GAPDH. Statistical analysis revealed no significant differences.
Figure 13
Figure 13
Aging-dependent changes in mRNA expression levels of quadriceps muscle can be grouped into 6 clusters. (A). Heat map of 6 different clusters into which affected mRNA molecules were grouped according to changes in expression kinetics for 1-, 6-, and 24-month-old mice. RNA was prepared from the quadriceps and analyzed by RNA-seq. Results at each time point are the average of 3 experimental repeats. (BF). Enrichment analysis of genes in each of the 6 clusters shown in panel (A) using GeneAnalytics (Ben-Ari Fuchs et al. [62]). Enriched pathways with a high score (corrected p-value < 0.0001) are shown. The score is -log2(corrected p-value), i.e., the lower the bar, the lower the corrected p-value. A list of genes of each cluster is provided in Supplementary Table S1.
Figure 13
Figure 13
Aging-dependent changes in mRNA expression levels of quadriceps muscle can be grouped into 6 clusters. (A). Heat map of 6 different clusters into which affected mRNA molecules were grouped according to changes in expression kinetics for 1-, 6-, and 24-month-old mice. RNA was prepared from the quadriceps and analyzed by RNA-seq. Results at each time point are the average of 3 experimental repeats. (BF). Enrichment analysis of genes in each of the 6 clusters shown in panel (A) using GeneAnalytics (Ben-Ari Fuchs et al. [62]). Enriched pathways with a high score (corrected p-value < 0.0001) are shown. The score is -log2(corrected p-value), i.e., the lower the bar, the lower the corrected p-value. A list of genes of each cluster is provided in Supplementary Table S1.
Figure 14
Figure 14
Analysis of differentially regulated genes revealed many groups of downregulated genes in aging, mostly related to ECM components. (A). Up and downregulated differentially expressed genes (DEGs) from the quadriceps of 1- vs. 24-month-old mice were analyzed using GeneAnalytics (Ben-Ari Fuchs et al. [62]). Enriched pathways with high score (corrected p-value < 0.0001) are shown. Pathways enriched in downregulated DEGs are colored blue, pathways enriched in upregulated DEGs are colored red. The score is −log2(corrected p-value), i.e., the lower the bar, the lower the corrected p-value. A list of genes is provided in Supplementary Table S2. (B). Normal counts of the mRNA molecules encoding the indicated collagens of quadriceps of 1- (black) and 24- (red) month-old mice, as revealed via RNA-seq analysis (results are the average and standard deviation of 3 mice that were tested at each time point). (C). Fold change (measures in 24-month divided by measures in 1-month-old mice) of the levels of the same mRNA molecules shown in panel (A,D,E). Normal counts of mRNA molecules encoding fibronectin 1 (FN (C) or fibrillin 1 (FBN1) (D) of quadriceps of wild-type mice aged 1, 6, and 24 months, as revealed via RNA-seq analysis (results shown are the average and standard deviation of 3 mice that were tested at each time point) (ns = non-significant. Asterisks (*) mark p-value < 0.05 (**) mark p-value < 0.01).
Figure 15
Figure 15
Aged skeletal muscle expresses higher levels of mRNAs encoding atrophy-associated proteins and Pax7 as compared to young mice. (AD). Normalized counts of mRNA molecules encoding Dkk3 (A), Murf-1 (B), Atrogin-1 (C), and Pax7 (D) in the quadriceps of 1-, 6-, and 24-month-old mice, as revealed via RNA-seq analysis (results are the average and standard deviation of measures from 3 mice). (ns = non-significant. Asterisks (*) mark p-value < 0.05 (**) mark p-value < 0.01).
Figure 16
Figure 16
Aged skeletal muscle does not express higher levels than young mice of senescence-associated genes and genes encoding cell cycle inhibitors. (AC). Normal counts of mRNA molecules encoding Caspase 3 (A), γH2AX1 (B), and p21 (C) in quadriceps of 1-, 6-, and 24-month-old mice, as revealed via RNA-seq analysis (results are the average and standard deviation of measures from 3 mice) (ns = non-significant).

References

    1. Moqri M., Herzog C., Poganik J.R., Justice J., Belsky D.W., Higgins-Chen A., Moskalev A., Fuellen G., Cohen A.A., Bautmans I., et al. Biomarkers of aging for the identification and evaluation of longevity interventions. Cell. 2023;186:3758–3775. doi: 10.1016/j.cell.2023.08.003. - DOI - PMC - PubMed
    1. Harman D. The aging process. Proc. Natl. Acad. Sci. USA. 1981;78:7124–7128. doi: 10.1073/pnas.78.11.7124. - DOI - PMC - PubMed
    1. Harman D. Aging: Overview. Ann. N. Y. Acad. Sci. 2001;928:1–21. doi: 10.1111/j.1749-6632.2001.tb05631.x. - DOI - PubMed
    1. Kennedy B.K., Berger S.L., Brunet A., Campisi J., Cuervo A.M., Epel E.S., Franceschi C., Lithgow G.J., Morimoto R.I., Pessin J.E., et al. Geroscience: Linking aging to chronic disease. Cell. 2014;159:709–713. doi: 10.1016/j.cell.2014.10.039. - DOI - PMC - PubMed
    1. Barnes P.J., Burney P.G.J., Silverman E.K., Celli B.R., Vestbo J., Wedzicha J.A., Wouters E.F.M. Chronic obstructive pulmonary disease. Nat. Rev. Dis. Primers. 2015;1:15076. doi: 10.1038/nrdp.2015.76. - DOI - PubMed