. 2024 Feb 1;25(3):1774.
doi: 10.3390/ijms25031774.

Molecular Mechanisms and Therapeutic Implications of Human Pericyte-like Adipose-Derived Mesenchymal Stem Cells in an In Vitro Model of Diabetic Retinopathy

Affiliations

Molecular Mechanisms and Therapeutic Implications of Human Pericyte-like Adipose-Derived Mesenchymal Stem Cells in an In Vitro Model of Diabetic Retinopathy

Aleksandra Agafonova et al. Int J Mol Sci. .

Abstract

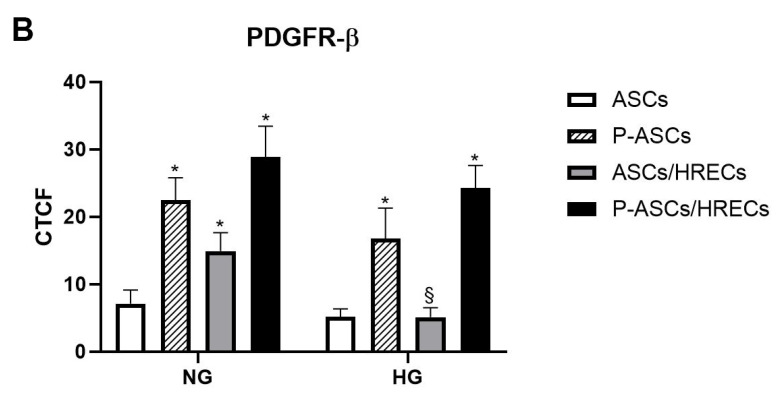
The blood-retinal barrier (BRB) is strongly compromised in diabetic retinopathy (DR) due to the detachment of pericytes (PCs) from retinal microvessels, resulting in increased permeability and impairment of the BRB. Western blots, immunofluorescence and ELISA were performed on adipose mesenchymal stem cells (ASCs) and pericyte-like (P)-ASCs by co-cultured human retinal endothelial cells (HRECs) under hyperglycemic conditions (HG), as a model of DR. Our results demonstrated that: (a) platelet-derived growth factor receptor (PDGFR) and its activated form were more highly expressed in monocultured P-ASCs than in ASCs, and this expression increased when co-cultured with HRECs under high glucose conditions (HG); (b) the transcription factor Nrf2 was more expressed in the cytoplasmic fraction of ASCs and in the P-ASC nuclear fraction, under normal glucose and, even more, under HG conditions; (c) cytosolic phospholipase A2 activity and prostaglandin E2 release, stimulated by HG, were significantly reduced in P-ASCs co-cultured with HRECs; (d) HO-1 protein content was significantly higher in HG-P-ASCs/HRECs than P-ASCs/HRECs; and (e) VEGF-A levels in media from HG-co-cultures were reduced in P-ASCs/HRECs with respect to ASCs/HRECs. The data obtained highlighted the potential of autologous differentiated ASCs in future clinical applications based on cell therapy to counteract the damage induced by DR.

Keywords: adipose mesenchymal stem cells; blood–retinal barrier; cell-based therapy; cytosolic phospholipase A2; diabetic retinopathy; human retinal endothelial cells; hyperglycemia; inflammation; pericyte-like differentiation; vascular endothelial growth factor.


Conflict of interest statement

The authors declare no conflicts of interest. The funders had no role in the design of the study; in the collection, analyses or interpretation of data; in the writing of the manuscript; or in the decision to publish the results.

Figures

Figure 1
Figure 1
α-SMA immunostaining under different culture conditions of human ASCs and P-ASCs. (A) Microphotographs showing α-SMA expression levels (red) in ASCs or P-ASCs cultured alone (first two columns of photographs on the left) or in direct co-cultures with HRECs (last two columns of photographs on the right), or with HRECs, under NG or HG conditions. Blue fluorescence (DAPI counterstaining) indicates cell nuclei. Scale bar = 50 µm. Arrows: high levels of α-SMA expression. (B) Histograms showing fluorescence quantification data for α-SMA under the same conditions as above. Bars represent corrected total cell fluorescence (CTCF) mean values ± SD, obtained from at least three independent experiments. Statistically significant differences, determined by one-way ANOVA, followed by Dunnett’s multiple comparison test, are indicated as follows: * p < 0.05 vs. ASCs, at the same glucose concentrations; § p < 0.05 of each sample vs. the corresponding NG condition. Under NG conditions, the basal α-SMA expression in ASCs is increased when cultured in the pericyte medium. A further increase can be noticed when HRECs are also present, especially for P-ASCs, showing the typical filamentous pattern (arrows). A similar trend, although at slightly lower values, can be observed after glucose addition (HG). The lowest value is detectable in P-ASC monocultures.
Figure 2
Figure 2
PDGFR-β immunostaining under different culture conditions of human ASCs and P-ASCs. (A) Microphotographs showing PDGFR-β expression levels (green) in ASCs or P-ASCs cultured alone (first two columns of photographs on the left) or in direct co-cultures with HRECs (last two columns of photographs on the right), or with HRECs, under NG or HG conditions. Blue fluorescence (DAPI counterstaining) indicated cell nuclei. Scale bar = 50 µm. Arrows: high levels of PDGFR-β expression. (B) Histograms showing fluorescence quantification data for PDGFR-β under the same conditions as above. Bars represent corrected total cell fluorescence (CTCF) mean values ± SD, obtained from at least three independent experiments. Statistically significant differences, determined by one-way ANOVA, followed by Dunnett’s multiple comparison test, are indicated as follows: * p < 0.05 vs. ASCs, at the same glucose concentrations; § p < 0.05 of each sample vs. the corresponding NG condition.
Figure 2
Figure 2
PDGFR-β immunostaining under different culture conditions of human ASCs and P-ASCs. (A) Microphotographs showing PDGFR-β expression levels (green) in ASCs or P-ASCs cultured alone (first two columns of photographs on the left) or in direct co-cultures with HRECs (last two columns of photographs on the right), or with HRECs, under NG or HG conditions. Blue fluorescence (DAPI counterstaining) indicated cell nuclei. Scale bar = 50 µm. Arrows: high levels of PDGFR-β expression. (B) Histograms showing fluorescence quantification data for PDGFR-β under the same conditions as above. Bars represent corrected total cell fluorescence (CTCF) mean values ± SD, obtained from at least three independent experiments. Statistically significant differences, determined by one-way ANOVA, followed by Dunnett’s multiple comparison test, are indicated as follows: * p < 0.05 vs. ASCs, at the same glucose concentrations; § p < 0.05 of each sample vs. the corresponding NG condition.
Figure 3
Figure 3
Evaluation of PDGFR-β/p-PDGFR-β in human adipose-derived mesenchymal stem cells (ASCs) and in human pericyte-like ASCs (P-ASCs) co-cultured with human retinal endothelial cells (HRECs) (indirect co-cultures). Data were gathered using Western blot analysis from samples that were cultured either under normal glucose (NG), mannitol (M) or high glucose (HG) acute conditions. Immunoblot analyses were performed on ASC and P-ASC lysates using specific antibodies against PDGFR-β and activated PDGFR-β (phosphorylated, p-PDGFR-β). β actin was used to verify the equal loading of 30 μg of protein per lane. Image J software (version 1.52a, NIH, Bethesda, MD, USA) was used to carry out densitometric analysis of the immunoblots, indicating the protein quantification of each band (in arbitrary densitometry units, a.d.u.). p-PDGFR-β/PDGFR-β ratios are reported in the graph. The bars represent means ± SD of three independent experiments performed in triplicate. Statistically significant differences determined by one-way ANOVA, followed by Dunnett’s multiple comparison test, are indicated as follows: * p < 0.05 vs. ASC monocultures in NG and HG; # p < 0.05 vs. P-ASC monocultures in NG and HG; § p < 0.05 vs. ASC/HREC co-cultures in NG and HG; p < 0.05 vs. P-ASCs/HRECs co-cultures in NG.
Figure 4
Figure 4
Evaluation of Nrf2 in the cytoplasm and nuclei of human adipose-derived mesenchymal stem cells (ASCs) and in human pericyte-like ASCs (P-ASCs) co-cultured with human retinal endothelial cells (HRECs) (indirect co-cultures). Data were gathered using Western blot analysis from samples that were cultured either under normal glucose (NG) or acute high glucose (HG) conditions. β-Actin and Lamin B1 were used to verify the equal loading of 30 μg of protein per lane in cytoplasm and nuclei, respectively. Image J software was used to carry out densitometric analysis of the immunoblots, indicating protein quantification of each band (in arbitrary densitometry units, a.d.u.). Quantitative analysis of Nrf2 was normalized to β-Actin and Lamin. The bars represent means ± SD of three independent experiments performed in triplicate. Statistically significant differences, determined by one-way ANOVA, followed by Dunnett’s multiple comparisons test, are indicated as follows: * p < 0.05 vs. cytoplasmic fraction of ASCs/HRECs in NG; # p < 0.05 vs. nuclear fraction of ASCs/HRECs in NG or HG; § p < 0.05 vs. corresponding nuclear fractions in NG.
Figure 5
Figure 5
Heme Oxygenase-1 (HO-1) immunocytochemical expression in human ASC and P-ASC cultures under NG and HG conditions. (A) Microphotographs showing immunocytochemical HO-1 expression levels (green) in ASCs or P-ASCs cultured alone (first two columns of photographs on the left) or in direct co-cultures with HRECs (last two columns of photographs on the right), or with HRECs (ASCs/HRECs, P-ASCs/HRECs) under NG or acute HG conditions. Blue fluorescence (DAPI counterstaining) indicates cell nuclei. Scale bar = 50 µm. Arrows: high levels of HO-1 expression. (B) Histograms show the cell fluorescence quantification for HO-1 immunostaining under the same conditions as indicated above. Bars represent the corrected total cell fluorescence (CTCF) mean values ± SD, obtained from three independent experiments performed in triplicate. Statistically significant differences, determined by one-way ANOVA, followed by Dunnett’s multiple comparison test, are indicated as follows: * p < 0.05 vs. ASCs, at the same glucose concentrations; § p < 0.05 of each sample vs. the corresponding NG conditions. Overall, increased HO-1 expression can be observed under high glucose (HG) conditions, particularly when ASCs or P-ASCs are co-cultured with HRECs (arrows).
Figure 6
Figure 6
Evaluation of mRNA levels of cytokines related to inflammation in human adipose-derived mesenchymal stem cells (ASCs) and in human pericyte-like ASCs (P-ASCs) co-cultured with human retinal endothelial cells (HRECs) (indirect co-cultures). Data were gathered using qRT-PCR analysis from samples that were cultured either under normal glucose (NG), mannitol (M) or high glucose (HG) conditions. (A) tumor necrosis factor alpha (TNF-α) mRNA levels; (B) interleukin (IL)-1β mRNA levels; (C) IL-10 levels; (D) metalloproteases (MMP)-9 mRNA levels; (E) angiopoietin-2 (ANG-2) levels. The bars represent means ± SD of three independent experiments performed in triplicate. Statistically significant differences determined by one-way ANOVA, followed by Dunnett’s multiple comparisons test, are indicated as follows: * p < 0.05 vs. the same cultures in NG; # p < 0.05 vs. ASCs in HG.

References

    1. Cogan D.G. Retinal Vascular Patterns: IV. Diabetic Retinopathy. Arch. Ophthalmol. 1961;66:366. doi: 10.1001/archopht.1961.00960010368014. - DOI - PubMed
    1. Hammes H.-P., Lin J., Renner O., Shani M., Lundqvist A., Betsholtz C., Brownlee M., Deutsch U. Pericytes and the Pathogenesis of Diabetic Retinopathy. Diabetes. 2002;51:3107–3112. doi: 10.2337/diabetes.51.10.3107. - DOI - PubMed
    1. Nawaz M., Fatima F., Vallabhaneni K.C., Penfornis P., Valadi H., Ekström K., Kholia S., Whitt J.D., Fernandes J.D., Pochampally R., et al. Extracellular Vesicles: Evolving Factors in Stem Cell Biology. Stem Cells Int. 2016;2016:1–17. doi: 10.1155/2016/1073140. - DOI - PMC - PubMed
    1. Skubis A., Gola J., Sikora B., Hybiak J., Paul-Samojedny M., Mazurek U., Łos M. Impact of Antibiotics on the Proliferation and Differentiation of Human Adipose-Derived Mesenchymal Stem Cells. Int. J. Mol. Sci. 2017;18:2522. doi: 10.3390/ijms18122522. - DOI - PMC - PubMed
    1. Hsiao S.T., Lokmic Z., Peshavariya H., Abberton K.M., Dusting G.J., Lim S.Y., Dilley R.J. Hypoxic Conditioning Enhances the Angiogenic Paracrine Activity of Human Adipose-Derived Stem Cells. Stem Cells Dev. 2013;22:1614–1623. doi: 10.1089/scd.2012.0602. - DOI - PMC - PubMed

MeSH terms

Substances