

T-Cell Receptor Sequences Identify Combined Coxsackievirus- Streptococci Infections as Triggers for Autoimmune Myocarditis and Coxsackievirus- Clostridia Infections for Type 1 Diabetes
- PMID: 38339075
- PMCID: PMC10855694
- DOI: 10.3390/ijms25031797
T-Cell Receptor Sequences Identify Combined Coxsackievirus- Streptococci Infections as Triggers for Autoimmune Myocarditis and Coxsackievirus- Clostridia Infections for Type 1 Diabetes
Abstract
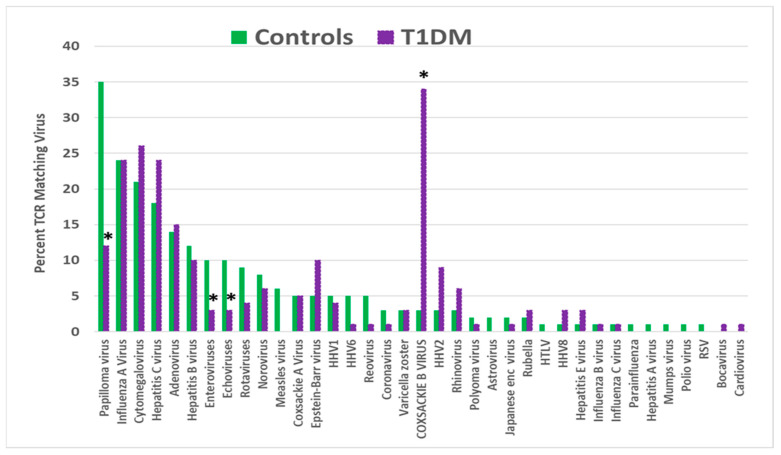
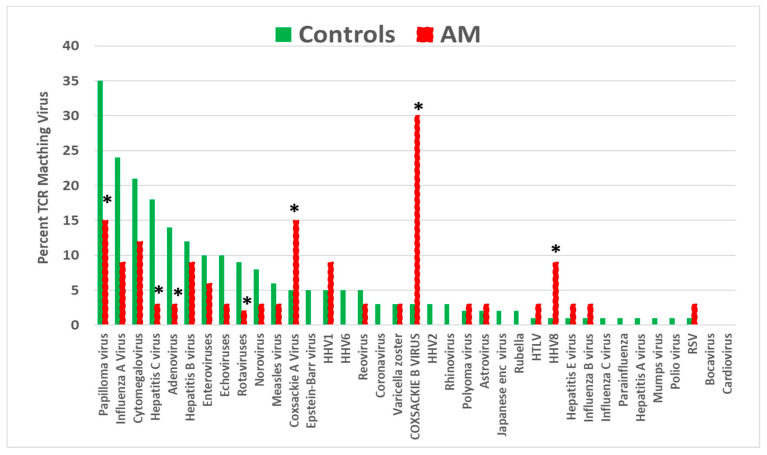
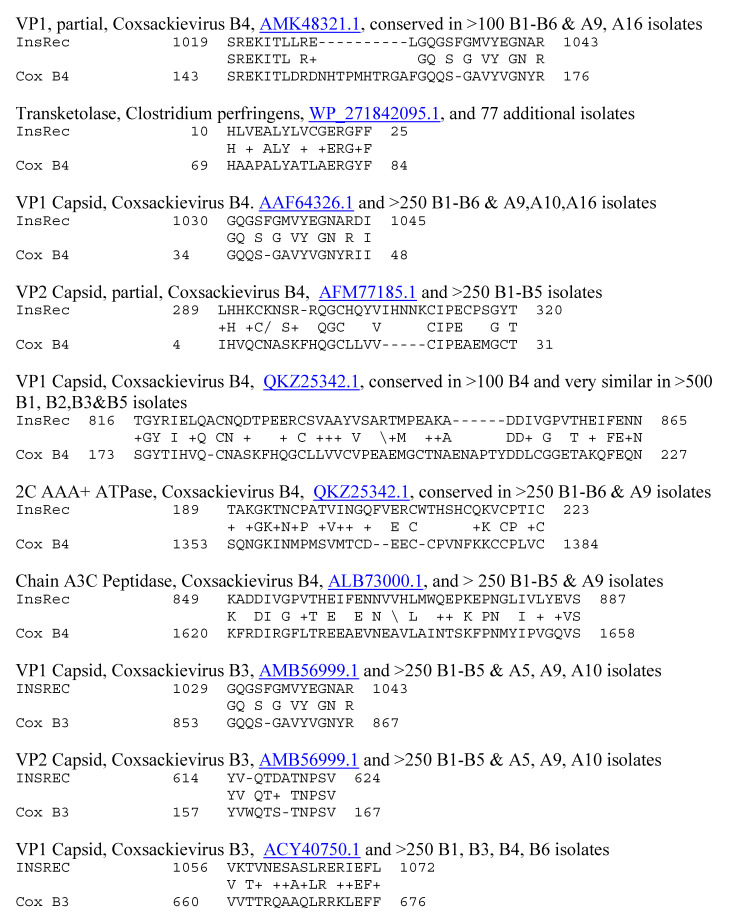
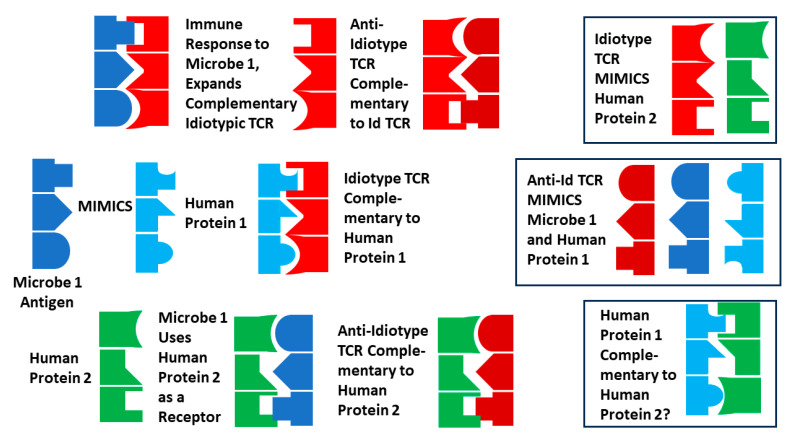
Recent research suggests that T-cell receptor (TCR) sequences expanded during human immunodeficiency virus and SARS-CoV-2 infections unexpectedly mimic these viruses. The hypothesis tested here is that TCR sequences expanded in patients with type 1 diabetes mellitus (T1DM) and autoimmune myocarditis (AM) mimic the infectious triggers of these diseases. Indeed, TCR sequences mimicking coxsackieviruses, which are implicated as triggers of both diseases, are statistically significantly increased in both T1DM and AM patients. However, TCRs mimicking Clostridia antigens are significantly expanded in T1DM, whereas TCRs mimicking Streptococcal antigens are expanded in AM. Notably, Clostridia antigens mimic T1DM autoantigens, such as insulin and glutamic acid decarboxylase, whereas Streptococcal antigens mimic cardiac autoantigens, such as myosin and laminins. Thus, T1DM may be triggered by combined infections of coxsackieviruses with Clostridia bacteria, while AM may be triggered by coxsackieviruses with Streptococci. These TCR results are consistent with both epidemiological and clinical data and recent experimental studies of cross-reactivities of coxsackievirus, Clostridial, and Streptococcal antibodies with T1DM and AM antigens. These data provide the basis for developing novel animal models of AM and T1DM and may provide a generalizable method for revealing the etiologies of other autoimmune diseases. Theories to explain these results are explored.
Keywords: Clostridia; Streptococci; T-cell receptors; anti-idiotype; antigen complementarity; autoimmune myocarditis; autoimmunity; coxsackievirus; diabetes; insulin; laminin; mimicry; myosin; synergism.
Conflict of interest statement
The author declares no conflict of interest.
Figures


Similar articles
-
Clostridia and Enteroviruses as Synergistic Triggers of Type 1 Diabetes Mellitus.Int J Mol Sci. 2023 May 6;24(9):8336. doi: 10.3390/ijms24098336. Int J Mol Sci. 2023. PMID: 37176044 Free PMC article.
-
T Cell Receptor Sequences Amplified during Severe COVID-19 and Multisystem Inflammatory Syndrome in Children Mimic SARS-CoV-2, Its Bacterial Co-Infections and Host Autoantigens.Int J Mol Sci. 2023 Jan 10;24(2):1335. doi: 10.3390/ijms24021335. Int J Mol Sci. 2023. PMID: 36674851 Free PMC article.
-
Antigenic complementarity between coxsackie virus and streptococcus in the induction of rheumatic heart disease and autoimmune myocarditis.Autoimmunity. 2009 Jan;42(1):1-16. doi: 10.1080/08916930802208540. Autoimmunity. 2009. PMID: 18608177 Review.
-
Streptococcus-induced myocarditis in mice.Autoimmunity. 2001;34(3):193-7. doi: 10.3109/08916930109007384. Autoimmunity. 2001. PMID: 11908777 Review. No abstract available.
-
Investigation of enterovirus infections, autoimmune factors and HLA genotypes in patients with T1DM.Minerva Endocrinol. 2014 Mar;39(1):67-74. Minerva Endocrinol. 2014. PMID: 24513606
Cited by
-
Gut Microbiota Secondary Metabolites: Key Roles in GI Tract Cancers and Infectious Diseases.Biomedicines. 2025 Jan 3;13(1):100. doi: 10.3390/biomedicines13010100. Biomedicines. 2025. PMID: 39857684 Free PMC article. Review.
-
Special Issue: "New Trends in Diabetes, Hypertension, and Cardiovascular Diseases-2nd Edition".Int J Mol Sci. 2025 Jan 7;26(2):449. doi: 10.3390/ijms26020449. Int J Mol Sci. 2025. PMID: 39859164 Free PMC article.
References
-
- Moise L., Beseme S., Tassone R., Liu R., Kibria F., Terry F., Martin W., De Groot A.S. T cell epitope redundancy: Cross-conservation of the TCR face between pathogens and self and its implications for vaccines and autoimmunity. Expert Rev. Vaccines. 2016;15:607–617. doi: 10.1586/14760584.2016.1123098. - DOI - PubMed
-
- Moise L., Terry F., Gutierrez A.H., Tassone R., Losikoff P., Gregory S.H., Bailey-Kellogg C., Martin W.D., De Groot A.S. Smarter vaccine design will circumvent regulatory T cell-mediated evasion in chronic HIV and HCV infection. Front. Microbiol. 2016;5:502. doi: 10.3389/fmicb.2014.00502. - DOI - PMC - PubMed
MeSH terms
Substances
LinkOut - more resources
Full Text Sources
Medical
Miscellaneous
