

Rosavin Alleviates LPS-Induced Acute Lung Injure by Modulating the TLR-4/NF-κB/MAPK Singnaling Pathways
- PMID: 38339153
- PMCID: PMC10856478
- DOI: 10.3390/ijms25031875
Rosavin Alleviates LPS-Induced Acute Lung Injure by Modulating the TLR-4/NF-κB/MAPK Singnaling Pathways
Abstract
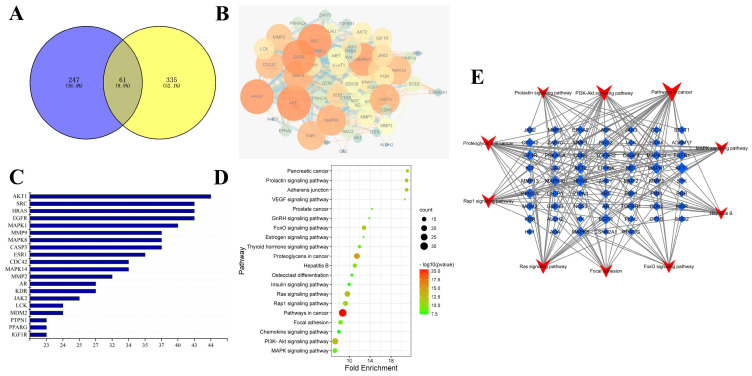
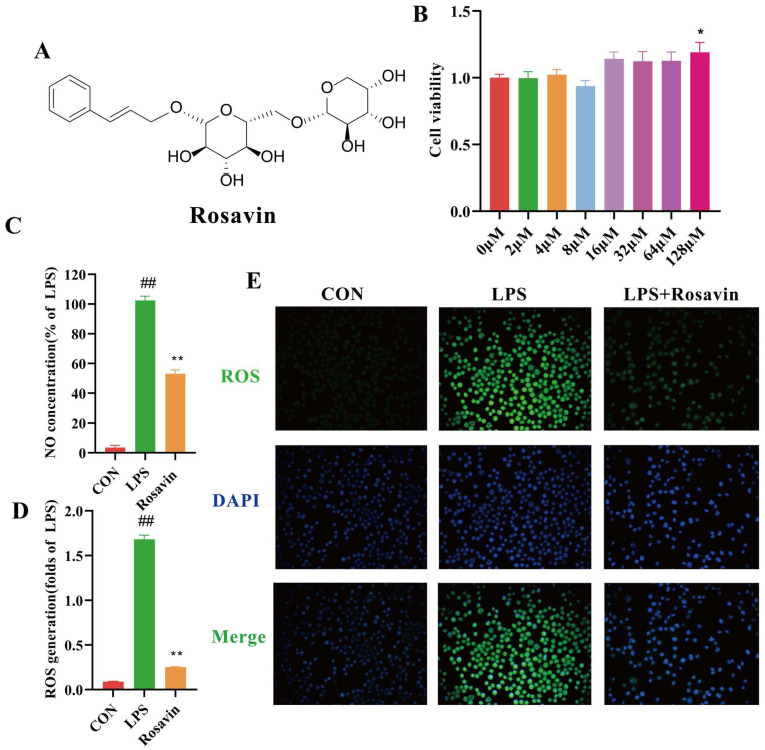
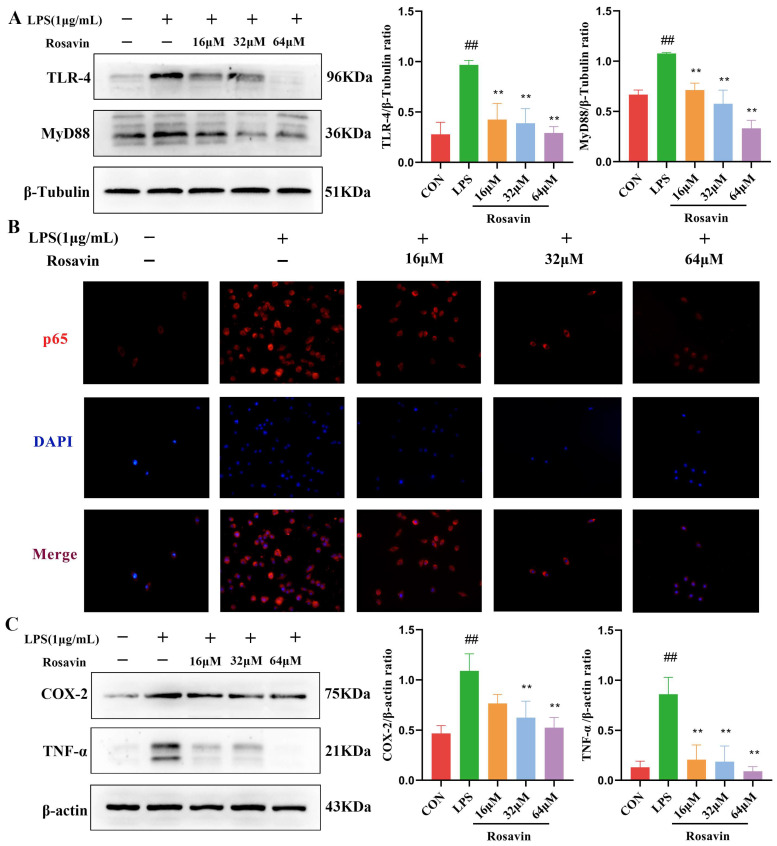
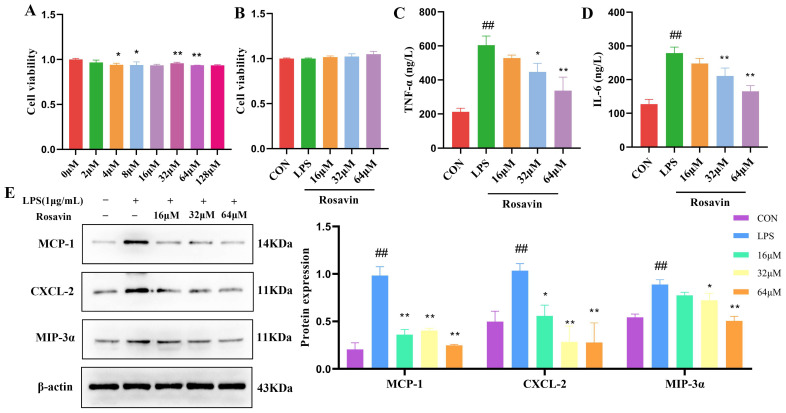
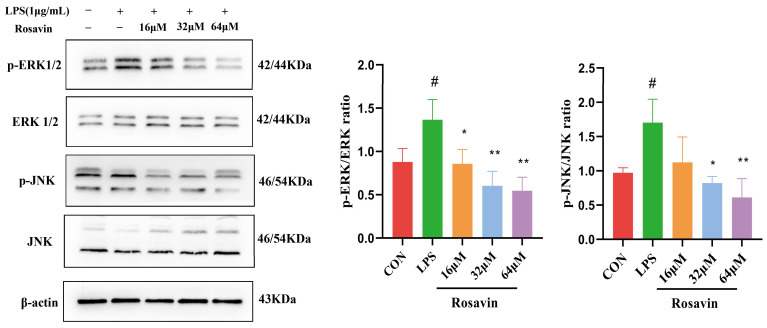
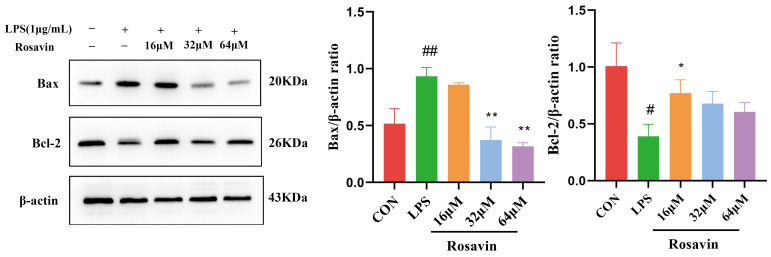
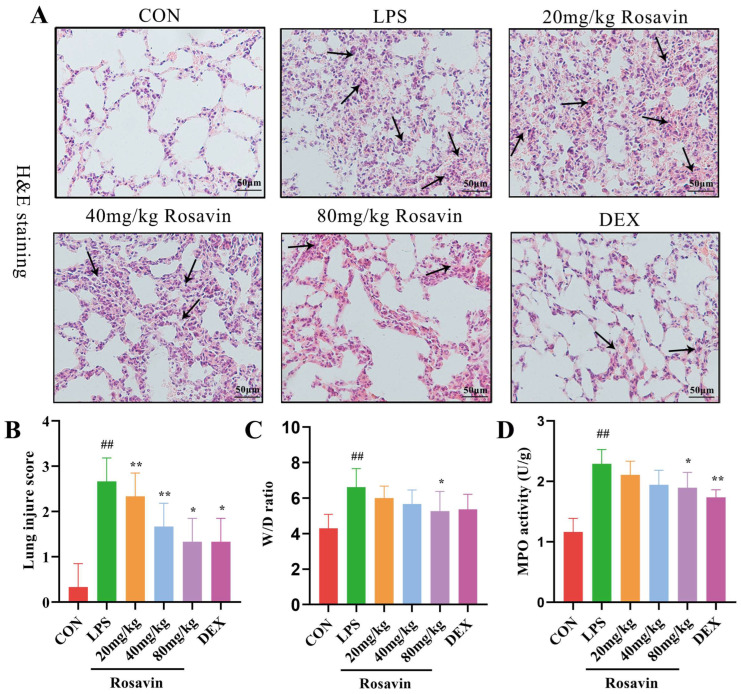
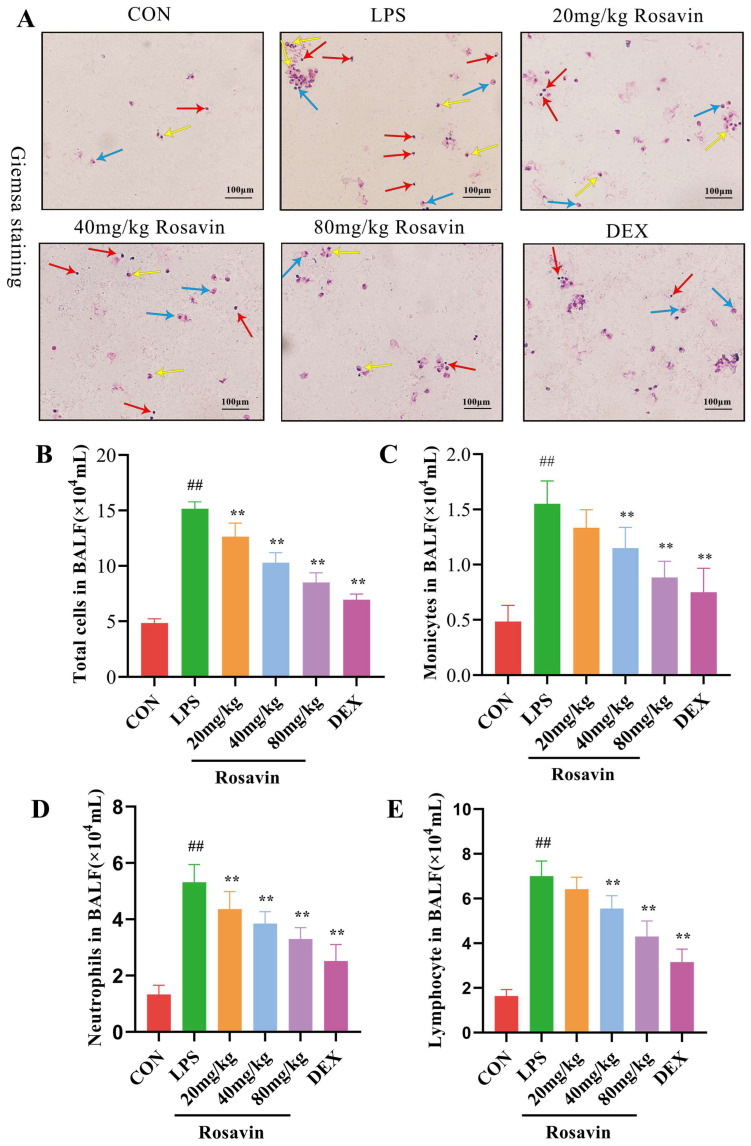
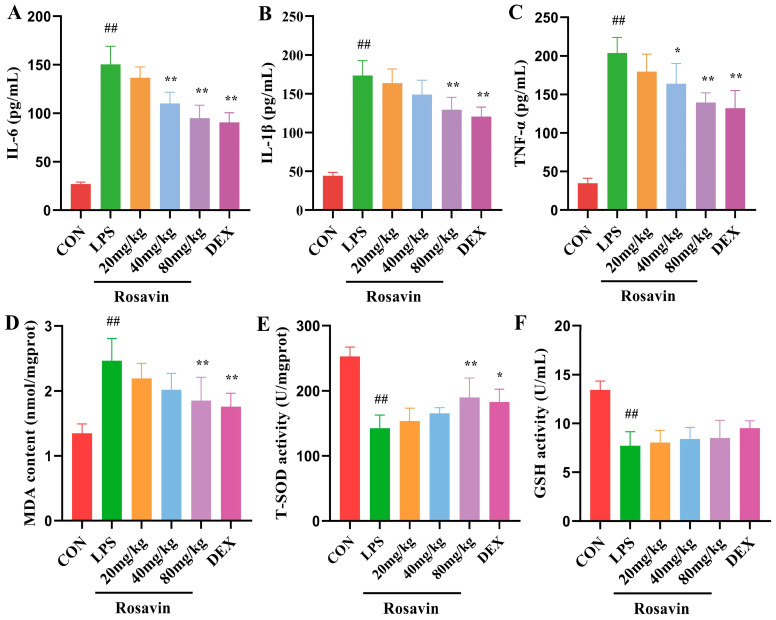
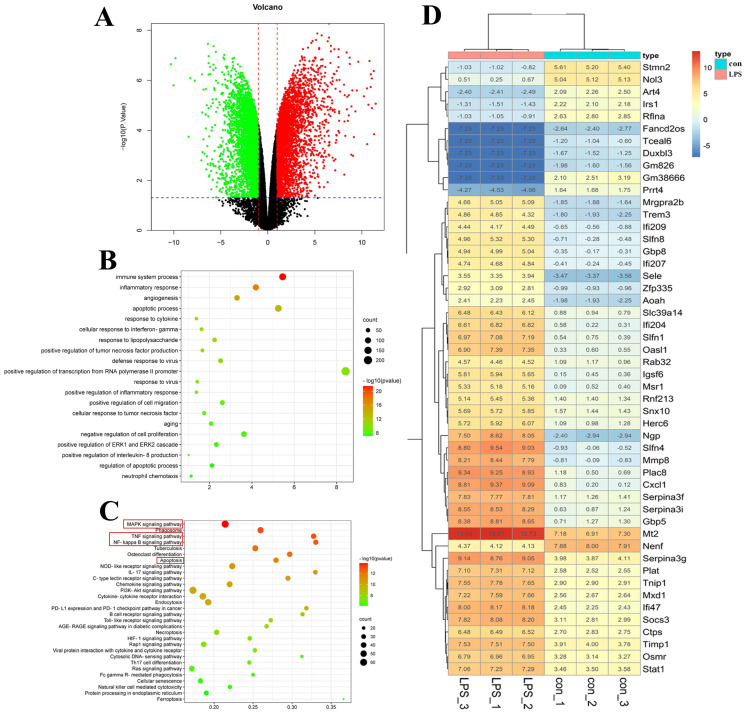
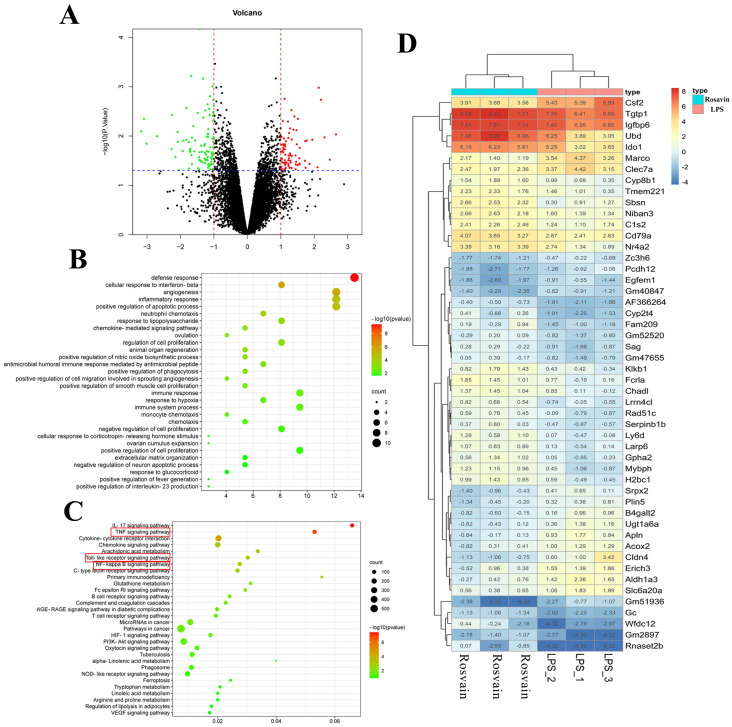
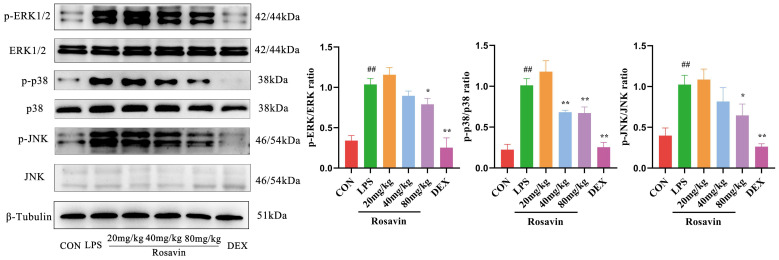
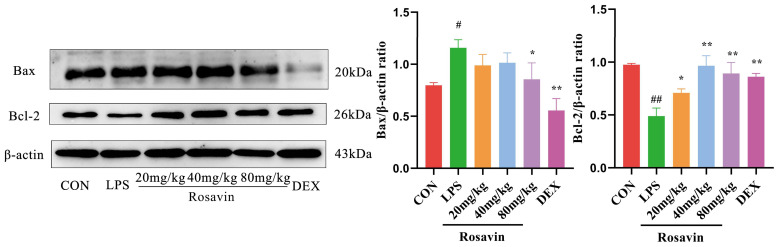
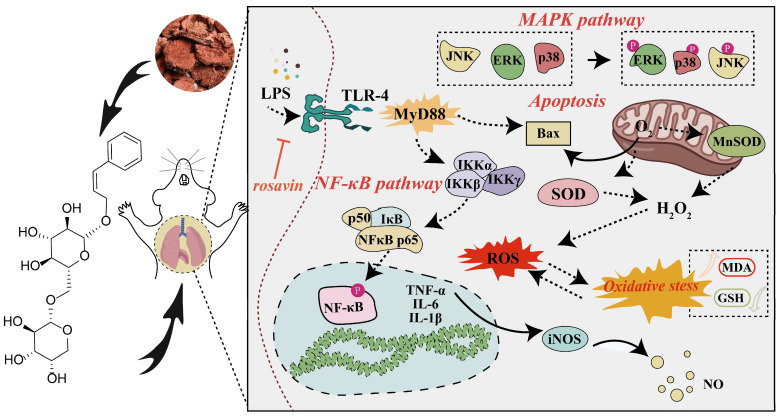
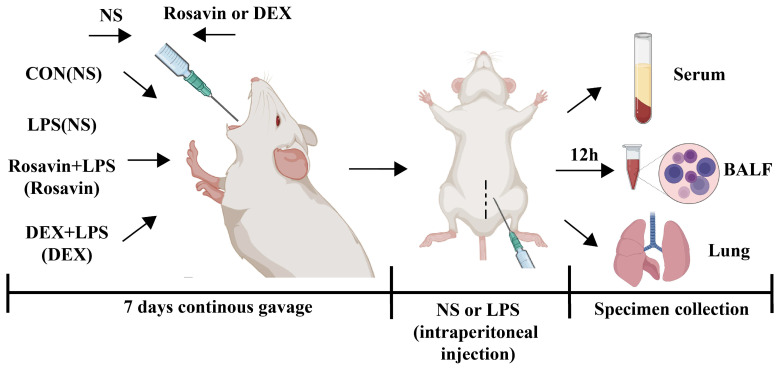
Acute lung injury (ALI) is a serious inflammatory disease with high morbidity and mortality. Rosavin is an anti-inflammatory and antioxidant phenylpropanoid and glucoside, which is isolated from Rhodiola rosea L. However, its potential molecular mechanisms and whether it has protective effects against lipopolysaccharide (LPS)-induced ALI remain to be elucidated. To assess the in vitro anti-inflammatory effects and anti-lung injury activity of rosavin, RAW264.7 and A549 cells were stimulated using 1 μg/mL LPS. Rosavin attenuated LPS-induced activation of the TLR-4/NF-κB signaling pathway in RAW264.7 cells and inhibited LPS-induced release of inflammatory factors in A549 cells. A mouse model of acute lung injury was constructed by intraperitoneal injection of 5 mg/kg LPS to observe the therapeutic effect of rosavin. Transcriptomics analysis and Western blot assays were utilized to verify the molecular mechanism, rosavin (20, 40, and 80 mg/kg) dose-dependently ameliorated histopathological alterations, reduced the levels of inflammatory factors, and inhibited the TLR-4/NF-κB/MAPK signaling pathway and apoptosis activation. Rosavin is a promising therapeutic candidate for acute lung injury by inhibiting the TLR-4/NF-κB/MAPK pathway.
Keywords: TLR-4/NF-κB/MAPK pathway; acute lung injury; anti-inflammatory; network pharmacology; rosavin; transcriptome sequencing.
Conflict of interest statement
The authors declare no conflicts of interest.
Figures

Similar articles
-
Total glycosides of Rhodiola rosea L. attenuate LPS-induced acute lung injury by inhibiting TLR4/NF-κB pathway.Biomed Pharmacother. 2023 Feb;158:114186. doi: 10.1016/j.biopha.2022.114186. Epub 2022 Dec 30. Biomed Pharmacother. 2023. PMID: 36587557
-
23-O-acetylshengmanol-3-O-α-L-arabinoside alleviates lipopolysaccharide-induced acute lung injury through inhibiting IκB/NF-κB and MAPK/AP-1 signaling pathways.J Ethnopharmacol. 2023 Jan 10;300:115725. doi: 10.1016/j.jep.2022.115725. Epub 2022 Sep 14. J Ethnopharmacol. 2023. PMID: 36115602
-
Dexmedetomidine attenuates lipopolysaccharide induced acute lung injury in rats by inhibition of caveolin-1 downstream signaling.Biomed Pharmacother. 2019 Oct;118:109314. doi: 10.1016/j.biopha.2019.109314. Epub 2019 Aug 10. Biomed Pharmacother. 2019. PMID: 31545263
-
Ulinastatin Protects Against LPS-Induced Acute Lung Injury By Attenuating TLR4/NF-κB Pathway Activation and Reducing Inflammatory Mediators.Shock. 2018 Nov;50(5):595-605. doi: 10.1097/SHK.0000000000001104. Shock. 2018. PMID: 29324628
-
Therapeutic Promises of Bioactive Rosavin: A Comprehensive Review with Mechanistic Insight.Chem Biodivers. 2024 Jul;21(7):e202400286. doi: 10.1002/cbdv.202400286. Epub 2024 Jun 25. Chem Biodivers. 2024. PMID: 38752614 Review.
Cited by
-
A Comprehensive Review of the Phytochemistry and Therapeutic Efficacy of Viola yedoensis Makino.Molecules. 2025 Apr 25;30(9):1922. doi: 10.3390/molecules30091922. Molecules. 2025. PMID: 40363729 Free PMC article. Review.
-
Comprehensive profiling of Rhodiola rosea roots and corresponding products: phytochemical insights and modulation of neuroinflammation in BV2 microglial cell model.Front Pharmacol. 2025 Jul 2;16:1608767. doi: 10.3389/fphar.2025.1608767. eCollection 2025. Front Pharmacol. 2025. PMID: 40672359 Free PMC article.
-
Comprehensive machine learning models for predicting therapeutic targets in type 2 diabetes utilizing molecular and biochemical features in rats.Front Endocrinol (Lausanne). 2024 May 24;15:1384984. doi: 10.3389/fendo.2024.1384984. eCollection 2024. Front Endocrinol (Lausanne). 2024. PMID: 38854687 Free PMC article.
-
Qingwen Hufei Granules Attenuate Lipopolysaccharide-Induced Acute Lung Injury by Suppressing NLRP3 Inflammasome-Dependent Pyroptosis.J Inflamm Res. 2025 Aug 4;18:10425-10443. doi: 10.2147/JIR.S523490. eCollection 2025. J Inflamm Res. 2025. PMID: 40787259 Free PMC article.
-
Integrated Multi-Level Investigation of Friend Leukemia Integration 1 Transcription Factor as a Novel Immune-Inflammatory Biomarker in Rheumatoid Arthritis: Bridging Bioinformatics, Clinical Cohorts, and Mechanistic Validation.J Inflamm Res. 2025 Mar 3;18:3105-3123. doi: 10.2147/JIR.S507941. eCollection 2025. J Inflamm Res. 2025. PMID: 40059948 Free PMC article.
References
-
- Ding Z., Zhong R., Yang Y., Xia T., Wang W., Wang Y., Xing N., Luo Y., Li S., Shang L., et al. Systems pharmacology reveals the mechanism of activity of Ge-Gen-Qin-Lian decoction against LPS-induced acute lung injury: A novel strategy for exploring active components and effective mechanism of TCM formulae. Pharmacol. Res. 2020;156:104759. doi: 10.1016/j.phrs.2020.104759. - DOI - PubMed
-
- Huang C.-Y., Deng J.-S., Huang W.-C., Jiang W.-P., Huang G.-J. Attenuation of Lipopolysaccharide-Induced Acute Lung Injury by Hispolon in Mice, Through Regulating the TLR4/PI3K/Akt/mTOR and Keap1/Nrf2/HO-1 Pathways, and Suppressing Oxidative Stress-Mediated ER Stress-Induced Apoptosis and Autophagy. Nutrients. 2020;12:1742. doi: 10.3390/nu12061742. - DOI - PMC - PubMed
-
- Qian Y., Wang Z., Lin H., Lei T., Zhou Z., Huang W., Wu X., Zuo L., Wu J., Liu Y., et al. TRIM47 is a novel endothelial activation factor that aggravates lipopolysaccharide-induced acute lung injury in mice via K63-linked ubiquitination of TRAF2. Signal Transduct. Target. Ther. 2022;7:148. doi: 10.1038/s41392-022-00953-9. - DOI - PMC - PubMed
MeSH terms
Substances
Grants and funding
- No. ZX09735-005/The National Science and Technology Major Project for "Significant New Drugs Creation"
- No. 82004061/the National Natural Science Foundation of China
- 2022ZD008/Xinjiang Production and Construction Corps Guiding Science and Technology Plan
- CXPY202220/Youth Innovative Talent Cultivation Projects of Shihezi University
LinkOut - more resources
Full Text Sources
