. 2024 Feb 1;16(3):633.
doi: 10.3390/cancers16030633.

Identification of Hypoxia Prognostic Signature in Glioblastoma Multiforme Based on Bulk and Single-Cell RNA-Seq

Affiliations

Identification of Hypoxia Prognostic Signature in Glioblastoma Multiforme Based on Bulk and Single-Cell RNA-Seq

Yaman B Ahmed et al. Cancers (Basel). .

Abstract

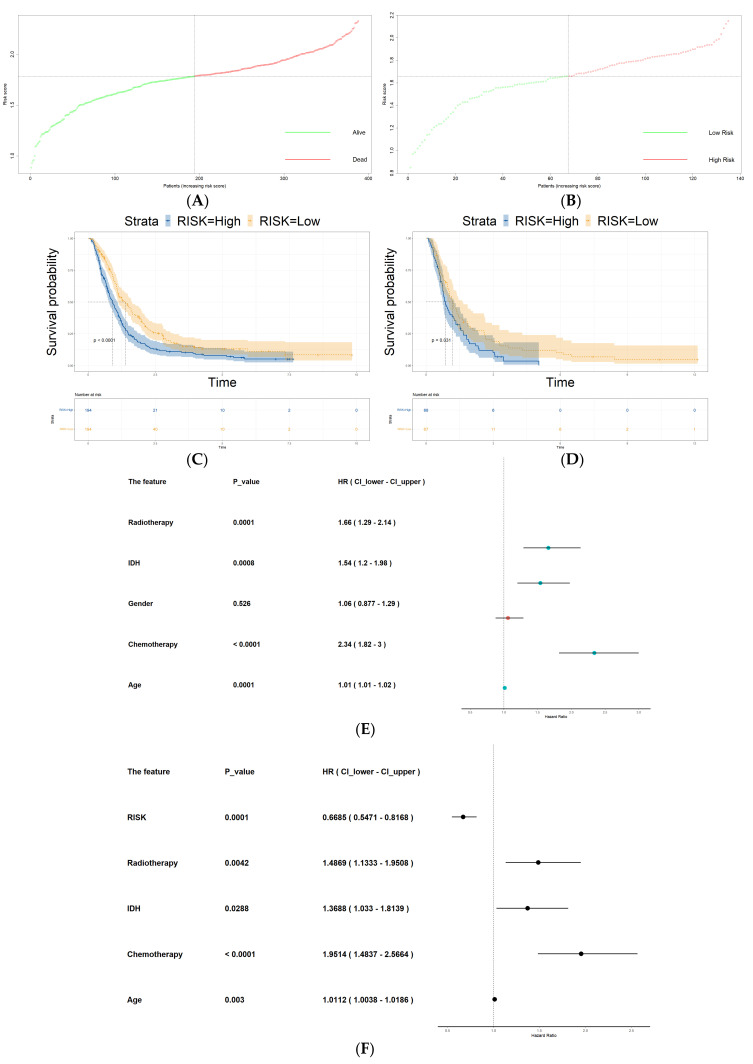
Glioblastoma (GBM) represents a profoundly aggressive and heterogeneous brain neoplasm linked to a bleak prognosis. Hypoxia, a common feature in GBM, has been linked to tumor progression and therapy resistance. In this study, we aimed to identify hypoxia-related differentially expressed genes (DEGs) and construct a prognostic signature for GBM patients using multi-omics analysis. Patient cohorts were collected from publicly available databases, including the Gene Expression Omnibus (GEO), the Chinese Glioma Genome Atlas (CGGA), and The Cancer Genome Atlas-Glioblastoma Multiforme (TCGA-GBM), to facilitate a comprehensive analysis. Hypoxia-related genes (HRGs) were obtained from the Molecular Signatures Database (MSigDB). Differential expression analysis revealed 41 hypoxia-related DEGs in GBM patients. A consensus clustering approach, utilizing these DEGs' expression patterns, identified four distinct clusters, with cluster 1 showing significantly better overall survival. Machine learning techniques, including univariate Cox regression and LASSO regression, delineated a prognostic signature comprising six genes (ANXA1, CALD1, CP, IGFBP2, IGFBP5, and LOX). Multivariate Cox regression analysis substantiated the prognostic significance of a set of three optimal signature genes (CP, IGFBP2, and LOX). Using the hypoxia-related prognostic signature, patients were classified into high- and low-risk categories. Survival analysis demonstrated that the high-risk group exhibited inferior overall survival rates in comparison to the low-risk group. The prognostic signature showed good predictive performance, as indicated by the area under the curve (AUC) values for one-, three-, and five-year overall survival. Furthermore, functional enrichment analysis of the DEGs identified biological processes and pathways associated with hypoxia, providing insights into the underlying mechanisms of GBM. Delving into the tumor immune microenvironment, our analysis revealed correlations relating the hypoxia-related prognostic signature to the infiltration of immune cells in GBM. Overall, our study highlights the potential of a hypoxia-related prognostic signature as a valuable resource for forecasting the survival outcome of GBM patients. The multi-omics approach integrating bulk sequencing, single-cell analysis, and immune microenvironment assessment enhances our understanding of the intricate biology characterizing GBM, thereby potentially informing the tailored design of therapeutic interventions.

Keywords: CP; IGFBP2; LOX; bioinformatics; glioblastoma multiforme; hypoxia.


Conflict of interest statement

The authors declare no conflicts of interest.

Figures

Figure 1
Figure 1
Flowchart of this study.
Figure 2
Figure 2
DEGs identification in different datasets of GBM. (A) Volcano diagrams of DEGs from the GBM vs. normal tissues in (A) GSE4290 dataset and (B) GSE68848 dataset. (C) Venn diagram showing the shared differential expressed genes in GSE4290 and GSE68848 datasets. (D) Venn diagram showing the 41 hypoxia-related genes (HRG) that are differentially expressed. (E) The pairwise correlation of the gene expression in the combined TCGA-GBM and CGGA693 (training set) before (black line) and after (red line) batch correction.
Figure 2
Figure 2
DEGs identification in different datasets of GBM. (A) Volcano diagrams of DEGs from the GBM vs. normal tissues in (A) GSE4290 dataset and (B) GSE68848 dataset. (C) Venn diagram showing the shared differential expressed genes in GSE4290 and GSE68848 datasets. (D) Venn diagram showing the 41 hypoxia-related genes (HRG) that are differentially expressed. (E) The pairwise correlation of the gene expression in the combined TCGA-GBM and CGGA693 (training set) before (black line) and after (red line) batch correction.
Figure 3
Figure 3
Construction of the prognostic risk score model based on a 3-hypoxia-gene signature in GBM. (A,B) Lambda and Lasso coefficients plots. (C,D) Univariate survival analysis of the 6 significant LASSO genes. (D) Multivariate Cox regression analysis of significant univariate genes.
Figure 4
Figure 4
Construction of the HRG risk score model based on the significant 3-hypoxia-gene signature. Heatmap showing gene expression of IGFBP2, CP, and LOX in (A) training set and (B) validation set. (C,D) ROC curves based on 1-year, 3-year, and 5-year OS in training set and validation set. (E,F) Dot plot showing the relationship between the risk score value, survival time, and living status in training set and validation set, respectively.
Figure 5
Figure 5
Survival validation of the HRG risk score model. (A,B) Dot plot showing the optimum cut-off of risk score based on median number of patients in training set and validation set, respectively. (C,D) Kaplan–Meier plots of OS showing significant worse survival in high-risk group in training set and validation set, respectively. (E) Univariate and (F) multivariate analysis of the combined datasets showing HRG risk score as an independent predictor of survival in GBM patients.
Figure 6
Figure 6
Bioinformatics analyses of DEGs between high-risk and low-risk patients. (A) Volcano plots of DEGs from high-risk vs. low-risk groups. (B) GO functions of the upregulated DEGs in high-risk patients. (C) GO functions of the downregulated DEGs in high-risk patients. (D) Circos plot showing the results of KEGG pathway enrichment analysis.
Figure 6
Figure 6
Bioinformatics analyses of DEGs between high-risk and low-risk patients. (A) Volcano plots of DEGs from high-risk vs. low-risk groups. (B) GO functions of the upregulated DEGs in high-risk patients. (C) GO functions of the downregulated DEGs in high-risk patients. (D) Circos plot showing the results of KEGG pathway enrichment analysis.
Figure 7
Figure 7
Tumor microenvironment analysis of CGGA patients. (A) Heatmap showing TME analysis and its relationship with other clinical and genomic variables. (B) Immune cell analysis based on TIMER algorithm between high- and low-risk patients. (C) Results of ESTIMATE algorithm showing significantly higher ESTIMATE, immune, and stromal scores in high-risk patients.
Figure 8
Figure 8
Results of single-cell RNA-seq analysis. (A) Single-cell analysis of GSE131928 showing singles of enrichment of CP, IGFBP2, and LOX genes in MES-like malignant cells. (B) Heatmap of the 3 HRGs according to the anatomical location of tumor sample using Ivy Glioblastoma Atlas showing that the expression of the 3 HRGs is highly related to the perinecrotic and pseudopalisading zones, while CP and IGFBP2 were also enriched toward the cellular zone and LOX was enriched toward the vascular zones.

Similar articles

Cited by

References

    1. Grochans S., Cybulska A.M., Simińska D., Korbecki J., Kojder K., Chlubek D., Baranowska-Bosiacka I. Epidemiology of Glioblastoma Multiforme—Literature Review. Cancers. 2022;14:2412. doi: 10.3390/cancers14102412. - DOI - PMC - PubMed
    1. Park J.H., Lee H.K. Current Understanding of Hypoxia in Glioblastoma Multiforme and Its Response to Immunotherapy. Cancers. 2022;14:1176. doi: 10.3390/cancers14051176. - DOI - PMC - PubMed
    1. Wang A., Zhang G. Differential gene expression analysis in glioblastoma cells and normal human brain cells based on GEO database. Oncol. Lett. 2017;14:6040–6044. doi: 10.3892/ol.2017.6922. - DOI - PMC - PubMed
    1. Subramanian A., Tamayo P., Mootha V.K., Mukherjee S., Ebert B.L., Gillette M.A., Paulovich A., Pomeroy S.L., Golub T.R., Lander E.S., et al. Gene set enrichment analysis: A knowledge-based approach for interpreting genome-wide expression profiles. Proc. Natl. Acad. Sci. USA. 2005;102:15545–15550. doi: 10.1073/pnas.0506580102. - DOI - PMC - PubMed
    1. Winter S.C., Buffa F.M., Silva P., Miller C., Valentine H.R., Turley H., Shah K.A., Cox G.J., Corbridge R.J., Homer J.J., et al. Relation of a Hypoxia Metagene Derived from Head and Neck Cancer to Prognosis of Multiple Cancers. Cancer Res. 2007;67:3441–3449. doi: 10.1158/0008-5472.CAN-06-3322. - DOI - PubMed