

On the Question of CO's Ability to Induce HO-1 Expression in Cell Culture: A Comparative Study Using Different CO Sources
- PMID: 38340055
- PMCID: PMC10949199
- DOI: 10.1021/acschembio.3c00750
On the Question of CO's Ability to Induce HO-1 Expression in Cell Culture: A Comparative Study Using Different CO Sources
Abstract
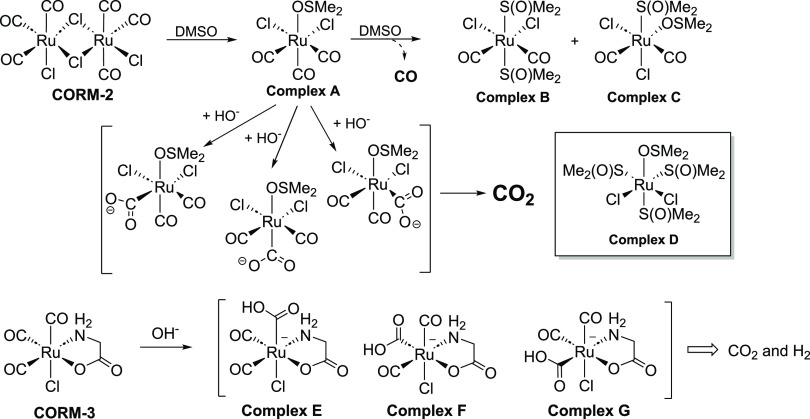
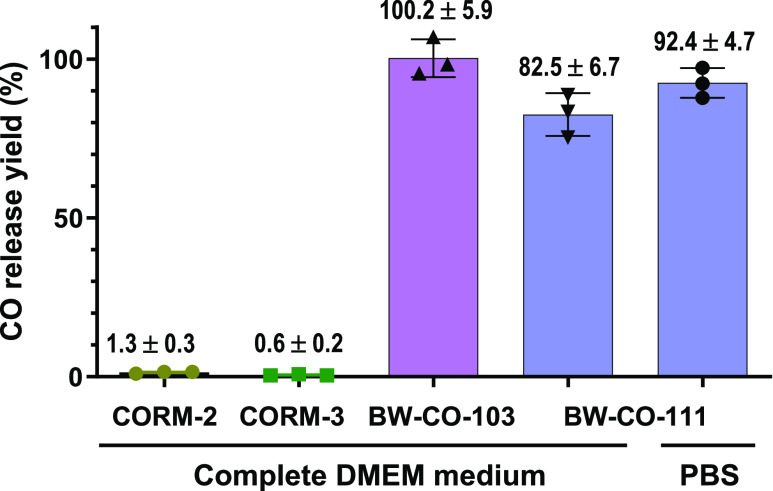
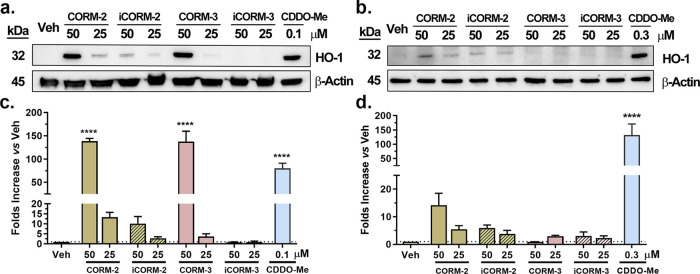
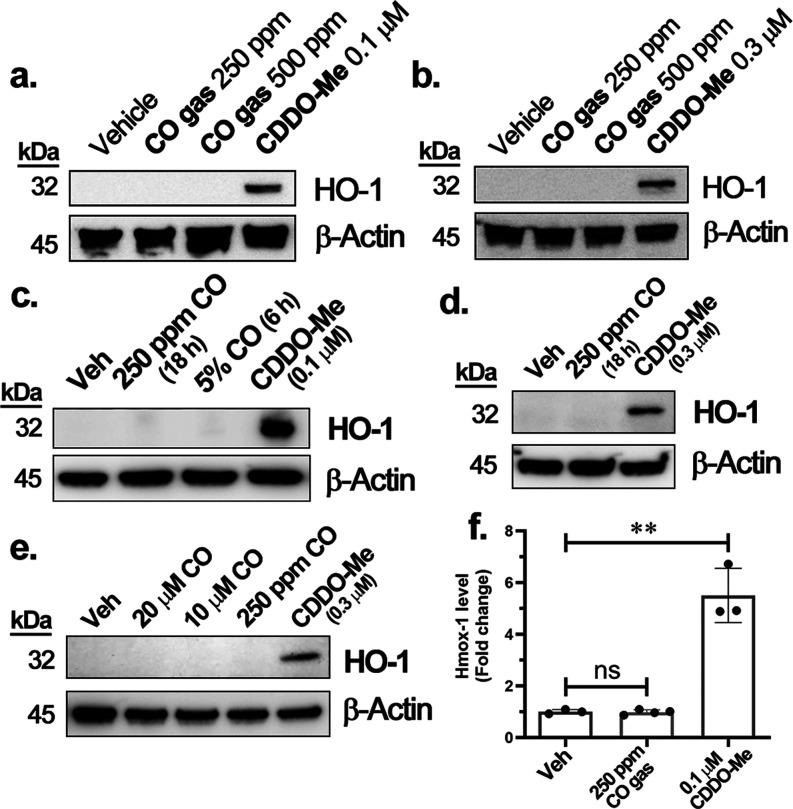
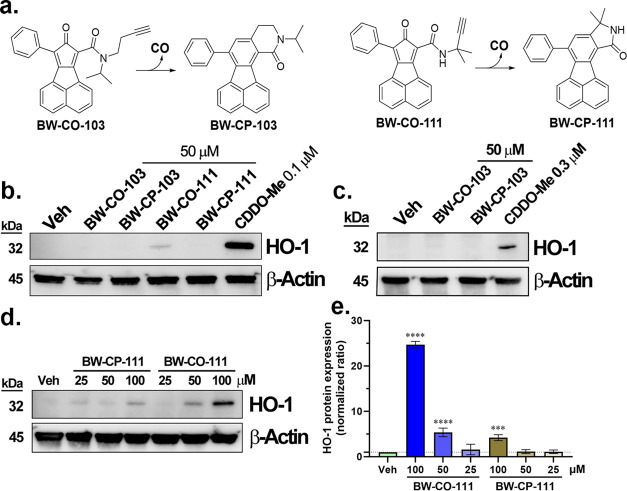
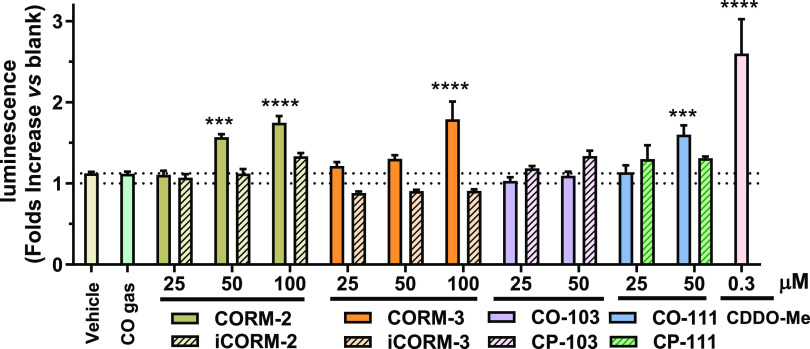
With the recognition of the endogenous signaling roles and pharmacological functions of carbon monoxide (CO), there is an increasing need to understand CO's mechanism of actions. Along this line, chemical donors have been introduced as CO surrogates for ease of delivery, dosage control, and sometimes the ability to target. Among all of the donors, two ruthenium-carbonyl complexes, CORM-2 and -3, are arguably the most commonly used tools for about 20 years in studying the mechanism of actions of CO. Largely based on data using these two CORMs, there has been a widely accepted inference that the upregulation of heme oxygenase-1 (HO-1) expression is one of the key mechanisms for CO's actions. However, recent years have seen reports of very pronounced chemical reactivities and CO-independent activities of these CORMs. We are interested in examining this question by conducting comparative studies using CO gas, CORM-2/-3, and organic CO donors in RAW264.7, HeLa, and HepG2 cell cultures. CORM-2 and CORM-3 treatment showed significant dose-dependent induction of HO-1 compared to "controls," while incubation for 6 h with 250-500 ppm CO gas did not increase the HO-1 protein expression and mRNA transcription level. A further increase of the CO concentration to 5% did not lead to HO-1 expression either. Additionally, we demonstrate that CORM-2/-3 releases minimal amounts of CO under the experimental conditions. These results indicate that the HO-1 induction effects of CORM-2/-3 are not attributable to CO. We also assessed two organic CO prodrugs, BW-CO-103 and BW-CO-111. BW-CO-111 but not BW-CO-103 dose-dependently increased HO-1 levels in RAW264.7 and HeLa cells. We subsequently studied the mechanism of induction with an Nrf2-luciferase reporter assay, showing that the HO-1 induction activity is likely due to the activation of Nrf2 by the CO donors. Overall, CO alone is unable to induce HO-1 or activate Nrf2 under various conditions in vitro. As such, there is no evidence to support attributing the HO-1 induction effect of the CO donors such as CORM-2/-3 and BW-CO-111 in cell culture to CO. This comparative study demonstrates the critical need to consider possible CO-independent effects of a chemical CO donor before attributing the observed biological effects to CO. It is also important to note that such in vitro results cannot be directly extrapolated to in vivo studies because of the increased level of complexity and the likelihood of secondary and/or synergistic effects in the latter.
Conflict of interest statement
The authors declare no competing financial interest.
Figures
Similar articles
-
Compelling Evidence: A Critical Update on the Therapeutic Potential of Carbon Monoxide.Med Res Rev. 2025 Jul;45(4):1275-1301. doi: 10.1002/med.22116. Epub 2025 Apr 30. Med Res Rev. 2025. PMID: 40302550 Review.
-
CO Induces Nrf2-Dependent Heme Oxygenase-1 Transcription by Cooperating with Sp1 and c-Jun in Rat Brain Astrocytes.Mol Neurobiol. 2015 Aug;52(1):277-92. doi: 10.1007/s12035-014-8869-4. Epub 2014 Aug 23. Mol Neurobiol. 2015. PMID: 25148934
-
Carbon Monoxide (CO) Released from Tricarbonyldichlororuthenium (II) Dimer (CORM-2) in Gastroprotection against Experimental Ethanol-Induced Gastric Damage.PLoS One. 2015 Oct 13;10(10):e0140493. doi: 10.1371/journal.pone.0140493. eCollection 2015. PLoS One. 2015. PMID: 26460608 Free PMC article.
-
c-Src-dependent transactivation of EGFR mediates CORM-2-induced HO-1 expression in human tracheal smooth muscle cells.J Cell Physiol. 2015 Oct;230(10):2351-61. doi: 10.1002/jcp.24912. J Cell Physiol. 2015. PMID: 25921464
-
Carbon monoxide - beyond toxicity?Toxicol Lett. 2020 Oct 15;333:251-260. doi: 10.1016/j.toxlet.2020.08.010. Epub 2020 Aug 26. Toxicol Lett. 2020. PMID: 32860873 Review.
Cited by
-
Quantitative Factors Introduced in the Feasibility Analysis of Reactive Oxygen Species (ROS)-Sensitive Triggers.Angew Chem Int Ed Engl. 2024 Jun 21;63(26):e202403880. doi: 10.1002/anie.202403880. Epub 2024 Jun 3. Angew Chem Int Ed Engl. 2024. PMID: 38630918 Free PMC article. Review.
-
On the Question of Uncatalyzed CO Insertion into a Hydrazone Double Bond: A Comparative Study Using Different CO Sources and Substrates.J Org Chem. 2024 Jul 5;89(13):9551-9556. doi: 10.1021/acs.joc.4c00936. Epub 2024 Jun 18. J Org Chem. 2024. PMID: 38888488 Free PMC article.
-
Compelling Evidence: A Critical Update on the Therapeutic Potential of Carbon Monoxide.Med Res Rev. 2025 Jul;45(4):1275-1301. doi: 10.1002/med.22116. Epub 2025 Apr 30. Med Res Rev. 2025. PMID: 40302550 Review.
-
Metal-Free CO Prodrugs Activated by Molecular Oxygen Protect against Doxorubicin-Induced Cardiomyopathy in Mice.J Med Chem. 2024 Nov 14;67(21):18981-18992. doi: 10.1021/acs.jmedchem.4c01431. Epub 2024 Oct 17. J Med Chem. 2024. PMID: 39417235 Free PMC article.
-
A Tale of Two Cities in Fluorescent Sensing of Carbon Monoxide: Probes That Detect CO and Those That Detect Only Chemically Reactive CO Donors (CORMs), but Not CO.J Org Chem. 2024 Dec 20;89(24):17891-17909. doi: 10.1021/acs.joc.4c02301. Epub 2024 Nov 14. J Org Chem. 2024. PMID: 39540647 Free PMC article. Review.
References
-
- De La Cruz L. K. C.; Wang B.. Carbon Monoxide Production: In Health and in Sickness. In Carbon Monoxide in Drug Discovery: Basics, Pharmacology, and Therapeutic Potential; Wang B.; Otterbein L. E., Eds.; John Wiley and Sons: Hoboken, NJ, 2022; pp 302–318.
Publication types
MeSH terms
Substances
Grants and funding
LinkOut - more resources
Full Text Sources
Research Materials
