. 2024 Feb 20;58(7):3437-3448.
doi: 10.1021/acs.est.3c09341. Epub 2024 Feb 10.

Fluorinated Pharmaceutical and Pesticide Photolysis: Investigating Reactivity and Identifying Fluorinated Products by Combining Computational Chemistry,19F NMR, and Mass Spectrometry

Affiliations

Fluorinated Pharmaceutical and Pesticide Photolysis: Investigating Reactivity and Identifying Fluorinated Products by Combining Computational Chemistry,19F NMR, and Mass Spectrometry

Akash P Bhat et al. Environ Sci Technol. .

Abstract

Fluorinated breakdown products from photolysis of pharmaceuticals and pesticides are of environmental concern due to their potential persistence and toxicity. While mass spectrometry workflows have been shown to be useful in identifying products, they fall short for fluorinated products and may miss up to 90% of products. Studies have shown that 19F NMR measurements assist in identifying and quantifying reaction products, but this protocol can be further developed by incorporating computations. Density functional theory was used to compute 19F NMR shifts for parent and product structures in photolysis reactions. Computations predicted NMR spectra of compounds with an R2 of 0.98. Computed shifts for several isolated product structures from LC-HRMS matched the experimental shifts with <0.7 ppm error. Multiple products including products that share the same shift that were not previously reported were identified and quantified using computational shifts, including aliphatic products in the range of -80 to -88 ppm. Thus, photolysis of fluorinated pharmaceuticals and pesticides can result in compounds that are polyfluorinated alkyl substances (PFAS), including aliphatic-CF3 or vinyl-CF2 products derived from heteroaromatic-CF3 groups. C-F bond-breaking enthalpies and electron densities around the fluorine motifs agreed well with the experimentally observed defluorination of CF3 groups. Combining experimental-computational 19F NMR allows quantification of products identified via LC-HRMS without the need for authentic standards. These results have applications for studies of environmental fate and analysis of fluorinated pharmaceuticals and pesticides in development.

Keywords: 19F NMR; PFAS; density functional theory; direct photolysis; photoproducts.


Conflict of interest statement

The authors declare no competing financial interest.

Figures

Figure 1
Figure 1
Structures of the fluorinated pesticides and pharmaceuticals (noted with an asterisk) used in the current computational study covering key fluorinated motifs. This figure is nonexhaustive, and the structures of other fluorinated compounds are in SI Section 5.
Figure 2
Figure 2
Computed 19F NMR shifts for 33 fluorinated motifs from 23 fluorinated pharmaceuticals and agrochemicals and the corresponding experimental 19F NMR shift with a linear regression R2 value of 0.98. The mean absolute error (MAE) was 1.74 ppm. Experimental 19F NMR shifts were either measured in the current study, measured in our previous studies using hexafluorobenzene (HFB) as the shift reference standard, or taken from the literature with CFCl3 as the shift reference standard. More information on the compound names, shifts, and literature values is in SI Section 6. The structures with the two highest errors are shown in the figure.
Figure 3
Figure 3
Experimental and computational 19F NMR shifts for the photolysis products of saflufenacil identified by LC-HRMS. (A) Experimental 19F NMR spectra for the CF3-containing products. (B) Experimental spectra for Aryl-F containing products and fluoride. The star symbol (★) represents the parent compound shift in both parts A and B. Computational shifts are represented as dashed (blue) lines below the experimental spectra with the corresponding identified LC-HRMS product structures. This figure is representative for only one wavelength and does not contain all the products formed in different photolysis conditions; all structures are in SI Section 7. The crosses (×) are experimentally measured shifts for structures that were isolated and concentrated from experimental photolysis solutions. The relative area of the experimental spectra shows the relative concentrations of the products, while the different lengths of the computational spectral lines are only to graphically fit the structures in the figure. Spectra reproduced with permission from ref (11). Copyright 2023 American Chemical Society.
Figure 4
Figure 4
Experimental and computational 19F NMR shifts for photolysis products of penoxsulam identified by LC-HRMS. (A) Experimental 19F NMR spectra for the CF3-containing products. The star symbol (★) represents the parent compound shift. (B) Experimental spectra of aliphatic-CF2-containing products. Computational shifts are represented as dashed (blue) lines below the experimental spectra with the LC-HRMS product structures. This figure is representative for only one wavelength and does not contain all the products formed in different photolysis conditions; all product structures are in SI Section 8. The relative area of the experimental spectra shows the relative concentrations of the products while the different lengths of the computational spectral lines are only to graphically fit the structures in the figure. Note that 2r, 2s, and 2t structures are a tautomers of 2j and 2k structures.
Figure 5
Figure 5
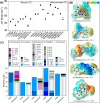
(A) Heterolytic C–F bond breaking enthalpies (in kcal mol–1) from the CF3 group for fluorinated compounds containing benzylic or heteroaromatic CF3 motifs. The enthalpies are the average of three values for the three fluorines, and standard deviation bars are smaller than the marker. The values have not been validated with a training set, and the key result is the relative differences among the different structural classes. Structures for model compounds 1–8 are available in SI Section 16. The horizontal lines in the benzylic-CF3 and Het-CF3 sections respectively represent the average heterolytic bond breaking enthalpy values (52.6 kcal mol–1 and 66.9 kcal mol–1, respectively). Points 5 and 6 are not included in the heteroaromatic average. Compounds corresponding to markers numbered 1–5 are shown in (B) and (C) and marker 6 has a lower enthalpy because it is the model structure corresponding to celecoxib (5). (B) Molecular electrostatic potential (MEP) from electron density calculations for compounds 1–5. The common color map legend is shown on the top right with the positive–negative value range (electrons Å–3) in parentheses next to each compound name. Red denotes negative values, and blue denotes positive. CF3 groups can be seen at the bottom right of the compound in (1) and right side of the compound in (2)–(5). (C) Fluorine mass balances for compounds 1–5 calculated using 19F NMR before (initial) and after (photolyzed) photolysis using 275 nm UV-LED with approximately 4-log degradation (except sitagliptin with 3-log). The mass balances for penoxsulam, fluoxetine, and saflufenacil were taken from our previous study. Reproduced with permission from ref (11). Copyright 2023 American Chemical Society. Experiments for sitagliptin and celecoxib were performed in the current study. Each differently colored/shaded bar is a different type of fluorine in the solution where the corresponding legends show the fluorinated product or the type of fluorine peak observed for each product along with the frequency shifts, i.e., singlets (S), doublets (D), doublets of triplets (DT), trifluoroacetic acid (TFA), and fluoride (F). Parent compounds are marked with P in the legends. Errors bars, which are not presented in the bar graphs, were less than 7%.

Similar articles

References

    1. Fujiwara T.; O’Hagan D. Successful Fluorine-Containing Herbicide Agrochemicals. J. Fluor. Chem. 2014, 167, 16–29. 10.1016/j.jfluchem.2014.06.014. - DOI
    1. Inoue M.; Sumii Y.; Shibata N. Contribution of Organofluorine Compounds to Pharmaceuticals. ACS Omega 2020, 5 (19), 10633–10640. 10.1021/acsomega.0c00830. - DOI - PMC - PubMed
    1. O’Hagan D. Understanding Organofluorine Chemistry. An Introduction to the C–F Bond. Chem. Soc. Rev. 2008, 37 (2), 308–319. 10.1039/B711844A. - DOI - PubMed
    1. Ogawa Y.; Tokunaga E.; Kobayashi O.; Hirai K.; Shibata N. Current Contributions of Organofluorine Compounds to the Agrochemical Industry. iScience 2020, 23 (9), 10146710.1016/j.isci.2020.101467. - DOI - PMC - PubMed
    1. Inoue M.; Sumii Y.; Shibata N. Contribution of Organofluorine Compounds to Pharmaceuticals. ACS Omega 2020, 5 (19), 10633–10640. 10.1021/acsomega.0c00830. - DOI - PMC - PubMed