. 2024 Mar:135:103646.
doi: 10.1016/j.dnarep.2024.103646. Epub 2024 Feb 7.

RNF4 prevents genomic instability caused by chronic DNA under-replication

Affiliations

RNF4 prevents genomic instability caused by chronic DNA under-replication

Marissa K Oram et al. DNA Repair (Amst). 2024 Mar.

Abstract

Eukaryotic genome stability is maintained by a complex and diverse set of molecular processes. One class of enzymes that promotes proper DNA repair, replication and cell cycle progression comprises small ubiquitin-like modifier (SUMO)-targeted E3 ligases, or STUbLs. Previously, we reported a role for the budding yeast STUbL synthetically lethal with sgs1 (Slx) 5/8 in preventing G2/M-phase arrest in a minichromosome maintenance protein 10 (Mcm10)-deficient model of replication stress. Here, we extend these studies to human cells, examining the requirement for the human STUbL RING finger protein 4 (RNF4) in MCM10 mutant cancer cells. We find that MCM10 and RNF4 independently promote origin firing but regulate DNA synthesis epistatically and, unlike in yeast, the negative genetic interaction between RNF4 and MCM10 causes cells to accumulate in G1-phase. When MCM10 is deficient, RNF4 prevents excessive DNA under-replication at hard-to-replicate regions that results in large DNA copy number alterations and severely reduced viability. Overall, our findings highlight that STUbLs participate in species-specific mechanisms to maintain genome stability, and that human RNF4 is required for origin activation in the presence of chronic replication stress.

Keywords: Genome instability; MCM10; RNF4; Replication stress; Under-replicated DNA.


Conflict of interest statement

Declaration of Competing Interest The authors declare that they have no known competing financial interests or personal relationships that could have appeared to influence the work reported in this paper.

Figures
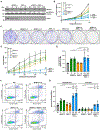
Figure 1.
Figure 1.. RNF4 is crucial for cell proliferation and survival during chronic replication stress
A) Western blot for MCM10 and RNF4 with Tubulin as a loading control. Quantification of MCM10 levels normalized to loading control, relative to WT is indicated. B) Comparison of cell proliferation represented as the average total cell number at different timepoints. For each cell line/timepoint n = 6 replicates, with average values for biological replicates indicated. Statistical significance was calculated using two-way analysis of variance (ANOVA) with Tukey’s multiple comparison test with *** < 0.001. C) Example images for clonogenic survival assay. Each cell line was plated at 1,500 cells/well. D) Quantification of clonogenic survival (colonies/well) at different seeding densities. For each cell line/seeding density n = 9 replicates, with average values for biological replicates indicated. Statistical significance was calculated using two-way analysis of variance (ANOVA) with Tukey’s multiple comparison test with *** < 0.001. E) β-galactosidase activity measured by fluorescence intensity normalized to total protein, relative to WT. For each cell line n = 18 replicates, with average values for biological replicates indicated. Error bars indicate standard deviation and statistical significance was calculated using one-way analysis of variance (ANOVA) with Tukey’s multiple comparison test with *** < 0.001 and not statistically significant (n.s.). F) Representative flow cytometry plots for apoptosis assay using a combination of propidium iodide and annexin V staining. The percentage of early apoptotic, late apoptotic, dead, and live cells in the total population is noted for the indicated cell lines. G) Average percentage of dead, apoptotic (early and late), and live cells. For each cell line n = 6, with average values for biological replicates indicated (symbols). Error bars indicate standard deviation and statistical significance was calculated using two-way analysis of variance (ANOVA) with Tukey’s multiple comparison test with ***<0.001, **<0.01. Statistical significance vs. MCM10+/− parental cell line is shown in black font whereas vs. RNF4−/− cell lines are shown in white/light grey font.
Figure 2.
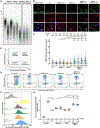
Figure 2.. Cell cycle distribution and DNA synthesis are disrupted in MCM10+/−:RNF4−/− mutants
A) Representative chromatin flow cytometry plots for cell cycle distribution based on DNA content (DAPI) and DNA synthesis (EdU incorporation). The percent of G1, S-, or G2/M-phase cells in the total population is noted for the indicated cell lines. B) Average percentage of G1, S-, or G2/M-phase cells. For each cell line n=6, with average values for biological replicates indicated (symbols). Error bars indicate standard deviation and statistical significance was calculated using two-way analysis of variance (ANOVA) with Tukey’s multiple comparison test with ***<0.001, **<0.01, *<0.05. C) Quantification of geometric mean EdU intensity in S-phase cells with averages listed. Control is WT cells without incubation with EdU (unlabeled). For each cell line n = 6, with average values for biological replicates indicated. Error bars indicate standard deviation and statistical significance was calculated using one-way analysis of variance (ANOVA) with Tukey’s multiple comparison test with *** < 0.001, ** < 0.01, not statistically significant (n.s.). D) Overlaid histogram comparing G1-phase chromatin loaded MCM2 as an indicator for origin licensing. Negative control contained no MCM2 antibody during primary antibody staining step. E) Quantification of geometric mean of MCM2 intensity in G1-phase cells with averages listed. For each cell line n=6, with average values for biological replicates indicated. Error bars indicate standard deviation and statistical significance was calculated using one-way analysis of variance (ANOVA) with Tukey’s multiple comparison test, not statistically significant (n.s.). Control contained no MCM2 antibody during primary antibody staining step.
Figure 3.
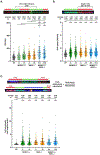
Figure 3.. RNF4 and MCM10 regulate DNA replication in parallel and epistatically
A) (Top) Schematic of inter-origin distance (IOD) calculation and example DNA fiber with an IOD event is shown. (Bottom) Quantification of IOD for two biological replicates. Average IOD distance (kb) and number of events (n) quantified are listed. Error bars indicate standard deviation and statistical significance was calculated using Kruskal-Wallis Test with **<0.01, *<0.05. B) (Top) Schematic of unidirectional replication event and example DNA fiber for unidirectional event is shown where the length and time of the second label is used to calculate replication fork speed. (Bottom) Quantification of replication fork speed for two biological replicates. Average fork speed (kb/minute) and number of events (n) quantified are listed. Error bars indicate standard deviation and statistical significance was calculated vs. WT using Kruskal-Wallis Test with ***<0.001. C) (Top) Example DNA fibers for different initiation events are shown. Fork asymmetry was calculated by taking the length of the longer red label over the length of the shorter red label for a given initiation event. (Bottom) Quantification of fork asymmetry for two biological replicates. Average fork asymmetry (red long/short ratio) and number of events (n) quantified are listed. Error bars indicate standard deviation and statistical significance was calculated vs. WT using Kruskal-Wallis Test with ***<0.001.
Figure 4.
Figure 4.. RNF4 prevents severe under-replication in MCM10-deficient cells
A) TRF analysis for average telomere length. The location of maximum peak intensity (yellow bar) is indicated. B) Representative images of 53BP1-NBs. 53BP1-NB (green), cyclin A (red), and DAPI (blue/merge) are indicated. Positive control is WT cells treated with 300 nM aphidicolin for 24 hours. Scale bar is 15 μM. C) Quantification of 53BP1-NBs for two biological replicates. Average 53BP1-NBs and number of nuclei (n) quantified are listed. Control is WT cells treated with 300 nM aphidicolin for 24 hours. Error bars indicate standard deviation and statistical significance was calculated using Kruskal-Wallis Test with *** < 0.001. D) Schematic of chromatin flow cytometry analysis for 53BP1 on chromatin. Cell cycle phase is defined by DNA content and EdU incorporation. E) Representative chromatin flow cytometry plots for 53BP1 on chromatin in non-replicating (EdU negative) and S-phase (EdU positive) cells. Positive control is WT cells treated with 300 nM aphidicolin for 24 hours. The percent of each quadrant (as defined in panel C) in the total population is noted for the indicated cell lines. F) Offset histogram comparing chromatin bound 53BP1 in G1-phase cells. Negative control contained no 53BP1 antibody during primary antibody staining step. Positive control is WT cells treated with 300 nM aphidicolin for 24 hours. G) Quantification of the geometric mean of 53BP1 intensity in G1-phase cells, relative to WT, with averages listed. Negative control contained no 53BP1 antibody during the primary antibody staining step. Positive control is WT cells treated with 300 nM aphidicolin for 24 hours. For each cell line n = 6, with average values for biological replicates indicated (symbols). Error bars indicate standard deviation and statistical significance was calculated using one-way analysis of variance (ANOVA) with Tukey’s multiple comparison test with *** < 0.001, ** < 0.01, not statistically significant (n.s.).
Figure 5.
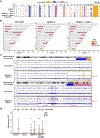
Figure 5.. Chronic replication stress generates large DNA copy number alterations
A) CNV partition plot of CMA data in the indicated cell lines using the Infinium CytoSNP-850K BeadChip. Low copy number (0-1.5) is displayed in orange, normal copy number (1.5-2.5) in blue, and high copy number (2.5-4.5) in pink. Chromosome (chr) and scale in megabases (Mb) position is indicated. B) CNV region (CNVR) distribution maps in the indicated cell lines with chromosome and physical position noted. CNV gains are displayed in pink while CNV losses are in orange (based on the reference human genome, hg19/GRCh37). De novo aberrations, as compared to WT cells, are indicated. Chr: chromosome; Mb: megabases. C) Examples of genomic loci with large de novo copy number losses (top, chromosome 15) and gains (bottom, chromosome 13) in MCM10+/−:RNF4−/− double. Profiles from WT cells are shown for comparison. Both the B allele frequency (top) and log R ratio (bottom) plots are shown for each cell line. D) CNV size comparison in the indicated cell lines. Copy number gains are displayed in pink and losses are in orange. Error bars indicate standard deviation and the average aberration size is noted.

Similar articles

Cited by

References

    1. Remus D, Beuron F, Tolun G, Griffith JD, Morris EP & Diffley JF (2009). Concerted loading of Mcm2-7 double hexamers around DNA during DNA replication origin licensing. Cell. 139, 719–730. 10.1016/j.cell.2009.10.015. - DOI - PMC - PubMed
    1. Evrin C, Clarke P, Zech J, Lurz R, Sun J, Uhle S, Li H, Stillman B & Speck C (2009). A double-hexameric MCM2-7 complex is loaded onto origin DNA during licensing of eukaryotic DNA replication. Proc Natl Acad Sci U S A. 106, 20240–20245. 10.1073/pnas.0911500106. - DOI - PMC - PubMed
    1. Siddiqui K, On KF & Diffley JF (2013). Regulating DNA replication in eukarya. Cold Spring Harb Perspect Biol. 5. 10.1101/cshperspect.a012930. - DOI - PMC - PubMed
    1. Moyer SE, Lewis PW & Botchan MR (2006). Isolation of the Cdc45/Mcm2-7/GINS (CMG) complex, a candidate for the eukaryotic DNA replication fork helicase. Proc Natl Acad Sci U S A. 103, 10236–10241. 10.1073/pnas.0602400103. - DOI - PMC - PubMed
    1. Yeeles JT, Deegan TD, Janska A, Early A & Diffley JF (2015). Regulated eukaryotic DNA replication origin firing with purified proteins. Nature. 519, 431–435. 10.1038/nature14285. - DOI - PMC - PubMed

Publication types

LinkOut - more resources