

Fourth dose of microneedle array patch of SARS-CoV-2 S1 protein subunit vaccine elicits robust long-lasting humoral responses in mice
- PMID: 38340419
- PMCID: PMC11939117
- DOI: 10.1016/j.intimp.2024.111569
Fourth dose of microneedle array patch of SARS-CoV-2 S1 protein subunit vaccine elicits robust long-lasting humoral responses in mice
Abstract
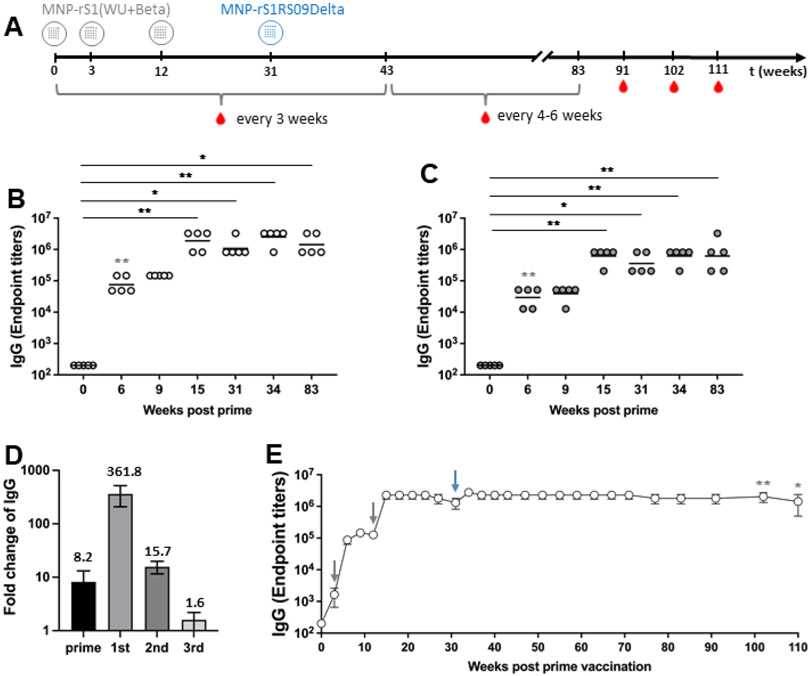
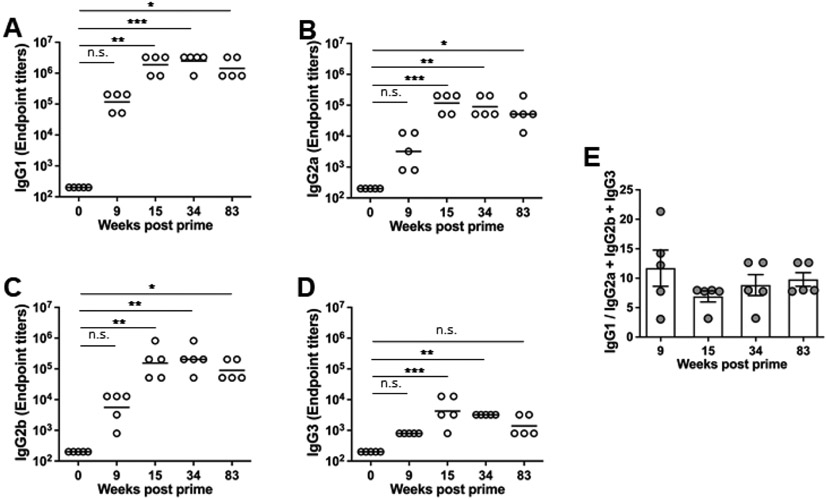
The COVID-19 pandemic has underscored the pressing need for safe and effective booster vaccines, particularly in considering the emergence of new SARS-CoV-2 variants and addressing vaccine distribution inequalities. Dissolving microneedle array patches (MAP) offer a promising delivery method, enhancing immunogenicity and improving accessibility through the skin's immune potential. In this study, we evaluated a microneedle array patch-based S1 subunit protein COVID-19 vaccine candidate, which comprised a bivalent formulation targeting the Wuhan and Beta variant alongside a monovalent Delta variant spike proteins in a murine model. Notably, the second boost of homologous bivalent MAP-S1(WU + Beta) induced a 15.7-fold increase in IgG endpoint titer, while the third boost of heterologous MAP-S1RS09Delta yielded a more modest 1.6-fold increase. Importantly, this study demonstrated that the administration of four doses of the MAP vaccine induced robust and long-lasting immune responses, persisting for at least 80 weeks. These immune responses encompassed various IgG isotypes and remained statistically significant for one year. Furthermore, neutralizing antibodies against multiple SARS-CoV-2 variants were generated, with comparable responses observed against the Omicron variant. Overall, these findings emphasize the potential of MAP-based vaccines as a promising strategy to combat the evolving landscape of COVID-19 and to deliver a safe and effective booster vaccine worldwide.
Keywords: Boost; COVID-19; Forth dose; Humoral immunity; Microneedle array patch; S1 protein subunit; SARS-CoV-2; Third dose; Vaccine.
Copyright © 2024 Elsevier B.V. All rights reserved.
Conflict of interest statement
Declaration of competing interest The authors declare that they have competing interests regarding the research presented in this manuscript. Specifically, AG and EK are co-founders of GAPHAS PHARMACEUTICAL INC., a private startup company that could potentially benefit from the findings of this research. AG, EK, and MSK have equity in GAPHAS PHARMACEUTICAL INC. However, the authors have taken measures to ensure that the research is conducted objectively and that the data and conclusions presented in this manuscript are not influenced by their competing interests. The study was designed, conducted, and analyzed independently of the company. The authors also declare that GAPHAS PHARMACEUTICAL INC. did not provide financial or material support for this research.
Figures


Similar articles
-
Long-term Immunity of a Microneedle Array Patch of SARS-CoV-2 S1 Protein Subunit Vaccine Irradiated by Gamma Rays in Mice.bioRxiv [Preprint]. 2024 Oct 25:2024.10.25.620289. doi: 10.1101/2024.10.25.620289. bioRxiv. 2024. Update in: Vaccines (Basel). 2025 Jan 18;13(1):86. doi: 10.3390/vaccines13010086. PMID: 39484497 Free PMC article. Updated. Preprint.
-
SARS-CoV-2 S1 Subunit Booster Vaccination Elicits Robust Humoral Immune Responses in Aged Mice.Microbiol Spectr. 2023 Jun 15;11(3):e0436322. doi: 10.1128/spectrum.04363-22. Epub 2023 May 10. Microbiol Spectr. 2023. PMID: 37162333 Free PMC article.
-
Boosting with Multiple Doses of mRNA Vaccine after Priming with Two Doses of Protein Subunit Vaccine MVC-COV1901 Elicited Robust Humoral and Cellular Immune Responses against Emerging SARS-CoV-2 Variants.Microbiol Spectr. 2022 Oct 26;10(5):e0060922. doi: 10.1128/spectrum.00609-22. Epub 2022 Aug 25. Microbiol Spectr. 2022. PMID: 36005765 Free PMC article.
-
Second Boost of Omicron SARS-CoV-2 S1 Subunit Vaccine Induced Broad Humoral Immune Responses in Elderly Mice.bioRxiv [Preprint]. 2024 Feb 6:2024.02.05.578925. doi: 10.1101/2024.02.05.578925. bioRxiv. 2024. PMID: 38370806 Free PMC article. Preprint.
-
Protein subunit vaccines: Promising frontiers against COVID-19.J Control Release. 2024 Feb;366:761-782. doi: 10.1016/j.jconrel.2024.01.017. Epub 2024 Jan 20. J Control Release. 2024. PMID: 38219913 Review.
Cited by
-
Long-term Immunity of a Microneedle Array Patch of SARS-CoV-2 S1 Protein Subunit Vaccine Irradiated by Gamma Rays in Mice.bioRxiv [Preprint]. 2024 Oct 25:2024.10.25.620289. doi: 10.1101/2024.10.25.620289. bioRxiv. 2024. Update in: Vaccines (Basel). 2025 Jan 18;13(1):86. doi: 10.3390/vaccines13010086. PMID: 39484497 Free PMC article. Updated. Preprint.
-
The Long-Term Immunity of a Microneedle Array Patch of a SARS-CoV-2 S1 Protein Subunit Vaccine Irradiated by Gamma Rays in Mice.Vaccines (Basel). 2025 Jan 18;13(1):86. doi: 10.3390/vaccines13010086. Vaccines (Basel). 2025. PMID: 39852865 Free PMC article.
References
-
- WHO, Coronavirus (COVID-19) Dashboard 2023; https://covid19.who.int (accessed on 13 September 2023).
-
- CDC, COVID Data Tracker. Centers for Disease Control and Prevention; 2023. Available online: https://covid.cdc.gov/covid-data-tracker (accessed on 13 September 2023).
MeSH terms
Substances
Supplementary concepts
Grants and funding
LinkOut - more resources
Full Text Sources
Medical
Miscellaneous
