. 2024 Mar 21;84(6):1078-1089.e4.
doi: 10.1016/j.molcel.2024.01.015. Epub 2024 Feb 9.

Visualization of translation reorganization upon persistent ribosome collision stress in mammalian cells

Affiliations

Visualization of translation reorganization upon persistent ribosome collision stress in mammalian cells

Juliette Fedry et al. Mol Cell. .

Abstract

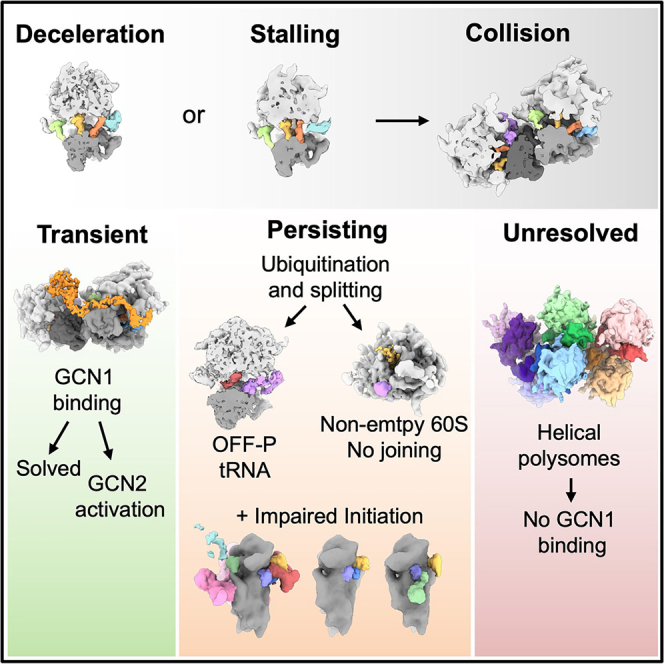
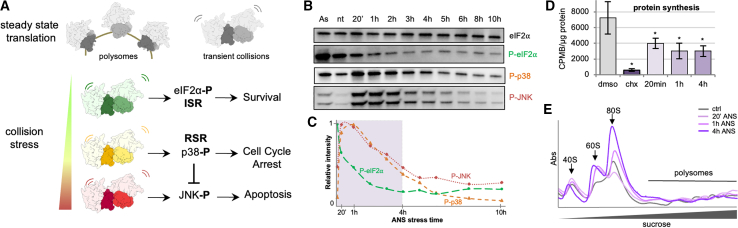
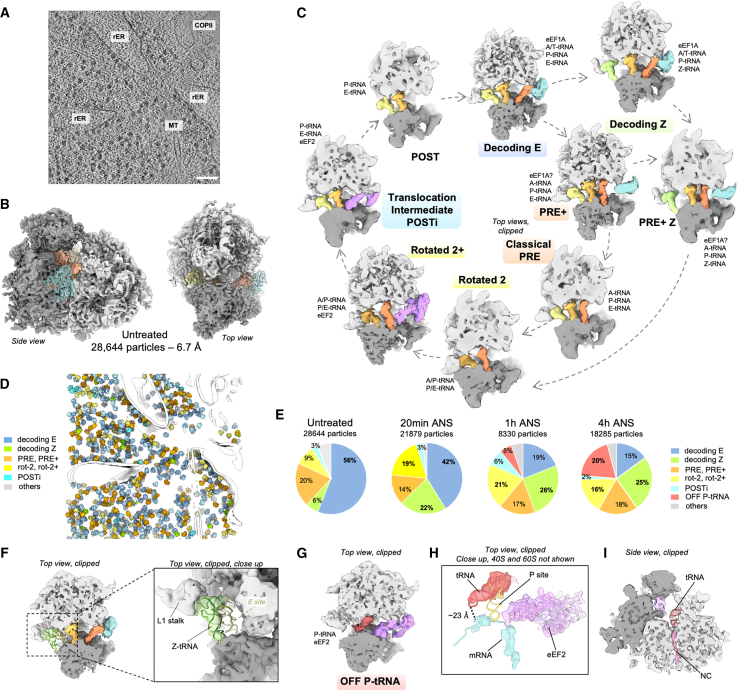
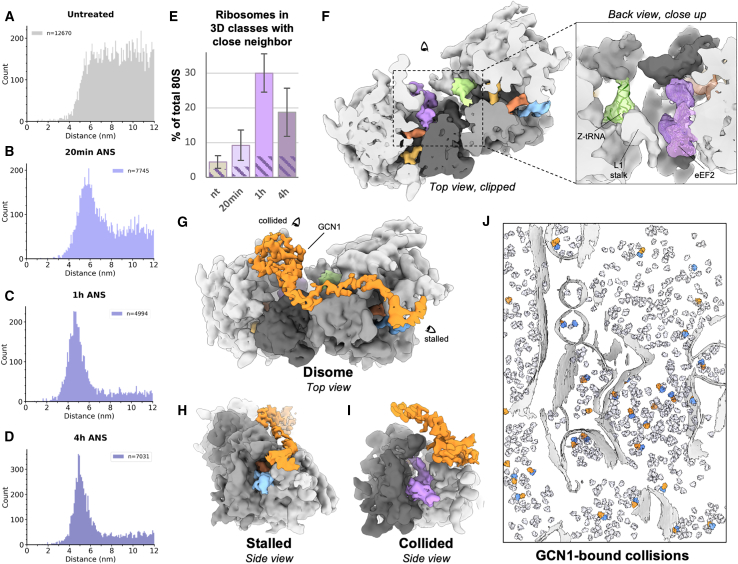
Aberrantly slow ribosomes incur collisions, a sentinel of stress that triggers quality control, signaling, and translation attenuation. Although each collision response has been studied in isolation, the net consequences of their collective actions in reshaping translation in cells is poorly understood. Here, we apply cryoelectron tomography to visualize the translation machinery in mammalian cells during persistent collision stress. We find that polysomes are compressed, with up to 30% of ribosomes in helical polysomes or collided disomes, some of which are bound to the stress effector GCN1. The native collision interface extends beyond the in vitro-characterized 40S and includes the L1 stalk and eEF2, possibly contributing to translocation inhibition. The accumulation of unresolved tRNA-bound 80S and 60S and aberrant 40S configurations identifies potentially limiting steps in collision responses. Our work provides a global view of the translation machinery in response to persistent collisions and a framework for quantitative analysis of translation dynamics in situ.

Keywords: cryoelectron tomography; initiation; polysome; ribosome collision; ribosome quality control; translation regulation.


Conflict of interest statement

Declaration of interests The authors declare no competing interests.

Figures

None
Graphical abstract
Figure 1
Figure 1
Biochemical analysis of low-dose ANS persistent collision stress in MEF cells (A) Schematic representation of translational situation in untreated cells (polysomes and low amount of collisions) and under increasing intensities of collision stress, with associated cellular stress responses and cell fate outcome. (B) Western blot analysis of collision-stress-induced responses in MEF cells treated with 500 μM arsenite for 10 min, untreated, or treated with 200 nM ANS for 20 min to 10 h: total eIF2α, phosphorylated eIF2α, phosphorylated p38, and phosphorylated JNK. (C) Corresponding relative intensity measurements, background substracted and normalized by total eIF2α intensity. (D) 35S incorporation protein synthesis measurements in control cells and cells treated with high-dose cycloheximide (CHX, 100 mg/mL), and low-dose ANS (200 nM) for 20 min (p = 0.049), 1 h (p = 0.03), and 4 h (p = 0.03). Error bars are standard deviations on n = 3 independent replicates. (E) Polysome profiling on sucrose gradients for control cells and cells treated with 20 min, 1 h, and 4 h low-dose ANS. See also Figure S1.
Figure 2
Figure 2
In situ visualization of 80S ribosome populations (A) Slice through a representative denoised tomogram of control MEF cells, scale bars: 100 nm. (B) Subtomogram average of 80S particles in the control condition. The small subunit is displayed in dark gray, the large subunit in light gray, the elongation factor in cyan and the tRNAs in shades of orange to yellow. (C) Observed active intermediates positioned in model of mammalian elongation cycle. The ribosome is clipped for visualization. A, P, and E indicate ribosomal aminoacyl, peptidyl, and exit sites, respectively. The tRNAs are color coded with respect to a complete cycle. The color code is the same as in (B), with eEF1A in cyan, eEF2 in purple, and the Z tRNA in green. (D) Different ribosome elongation states mapped back in the original tomogram shown in (A). Segmented membranes and microtubules are displayed in white. (E) Relative abundance of ribosomal elongation complexes in all datasets. (F) Close-up view on the Z-site-bound tRNA of the decoding Z complex. (G) Off-pathway ribosomal complex observed under prolonged low-dose ANS stress (1 and 4 h). The tRNA is displayed in dark red. (H) Same complex as in (G), displaying a model fit for the tRNA, eEF2, and the mRNA density (dark cyan). (I) Same complex as in (G) and (H), side view, clipped for the visualization of the peptide exit tunnel displaying a nascent chain (pink) bound to the tRNA. See also Figure S3.
Figure 3
Figure 3
In situ analysis of ribosome collisions (A–D) (A) Distance to nearest-neighbor plot for the control dataset, (B) same at 20 min low-dose ANS stress, (C) same at 1 h low-dose ANS stress, and (D) same at 4 h low-dose ANS stress. On each plot, n indicates the number of distances counted in the plot, i.e., all entry/exit distances < 12 nm. (E) Rough quantification of ribosomes with a defined close neighbor based on RELION 3D classification results. Patterned region indicates the proportion of these ribosomes in collisions bound by GCN1 for each condition. Bar and whiskers are mean and SD across tomograms (untreated n = 87, 20 min ANS n = 68, 1 h ANS n = 36, 4 h ANS n = 45). (F) In situ subtomogram average of collided disome. Close-up view displays fitted models for the Z-site tRNA and eEF2. (G–J) (G) In situ subtomogram average of GCN1-bound collided disomes and side views: (H) of the stalled ribosome, (I) on the collided ribosome. (J) GCN1-bound collisions mapped back into a tomogram. Segmented membranes are displayed in light gray and all other 80S particles in transparent light mauve. See also Figure S4.
Figure 4
Figure 4
In situ subtomogram averages of 60S complexes (A) Major 60S complex observed in control cells displaying densities corresponding to eIF6 (purple), EBP1 (blue), and a putative eFL1 (light green). PDB coordinates for 60S, eIF6, and EBP1 were fitted independently (using the corresponding chains from PDB: 7OW7 for the 60S and eIF6, and PDB: 6LSR for EBP1). (B) Second-most abundant 60S class, corresponding to previously described maturation state B, displaying densities corresponding to eIF6 (purple), LSG1 (light blue), NMD3 (beige), and ZN622 (dark red). Fitted PDB coordinates (PDB: 6LSR). (C) Relative abundances of the 60S complexes observed in the control dataset. (D) Major 60S complex observed in the 4 h low-dose ANS stress dataset displaying densities for eIF6 (purple), partial P-site tRNA (gold), and nascent chain (hot pink). PDB coordinates were fitted independently using the corresponding chains from 3J92 for 60S, eIF6, and tRNA, and 5AJ0 for the nascent chain. (E) NEMF- and Listerin-bound 60S particles, as observed in stressed cells. Fitted PDB coordinates (PDB: 3J92). (F) Relative abundances of the 60S complexes observed in 4 h low-dose ANS stress dataset. See also Figure S5.
Figure 5
Figure 5
In situ subtomogram averages of 40S complexes (A) 40S complex observed in control cells, densities corresponding to eIF1 and eIF1A are displayed in blue and purple, respectively. Fitted PDB coordinates (PDB: 4KZY). (B) Abundant 40S complex appearing at 20 min low-dose ANS stress, displaying extra densities corresponding to tRNA (gold) and eIF2 (red). (C) Major 40S complexes observed at 4 h low-dose ANS stress displaying a P-site tRNA (gold) and a density depicted in light green, possibly fitting eIF5B (PDB coordinates [PDB: 7TQL]). (D) 43S complexes observed in all datasets, displaying eIF3 (pink) and an extra density shown in light cyan proposed to correspond to an mRNA. Fitted PDB coordinates (PDB: 6ZMW). (E) Subtomogram average of a 40S complex with eIF3 but lacking eIF2 and tRNA, in cells treated with 500 μM arsenite for 15 min. Fitted PDB coordinates (PDB: 6ZMW). (F) Relative abundances of the 40S complexes observed in untreated cells and under high-dose ANS stalling, arsenite, or low-dose ANS stress. See also Figure S6.

Update of

References

    1. Juszkiewicz S., Chandrasekaran V., Lin Z., Kraatz S., Ramakrishnan V., Hegde R.S. ZNF598 Is a Quality Control Sensor of Collided Ribosomes. Mol. Cell. 2018;72:469–481.e7. - PMC - PubMed
    1. Narita M., Denk T., Matsuo Y., Sugiyama T., Kikuguchi C., Ito S., Sato N., Suzuki T., Hashimoto S., Machová I., et al. A distinct mammalian disome collision interface harbors K63-linked polyubiquitination of uS10 to trigger hRQT-mediated subunit dissociation. Nat. Commun. 2022;13:6411. - PMC - PubMed
    1. Ikeuchi K., Tesina P., Matsuo Y., Sugiyama T., Cheng J., Saeki Y., Tanaka K., Becker T., Beckmann R., Inada T. Collided ribosomes form a unique structural interface to induce Hel2-driven quality control pathways. EMBO J. 2019;38:e100276. - PMC - PubMed
    1. Cerullo F., Filbeck S., Patil P.R., Hung H.C., Xu H., Vornberger J., Hofer F.W., Schmitt J., Kramer G., Bukau B., et al. Bacterial ribosome collision sensing by a MutS DNA repair ATPase paralogue. Nature. 2022;603:509–514. - PMC - PubMed
    1. Saito K., Kratzat H., Campbell A., Buschauer R., Burroughs A.M., Berninghausen O., Aravind L., Green R., Beckmann R., Buskirk A.R. Ribosome collisions induce mRNA cleavage and ribosome rescue in bacteria. Nature. 2022;603:503–508. - PMC - PubMed

LinkOut - more resources