. 2024 Mar 21;84(6):1090-1100.e6.
doi: 10.1016/j.molcel.2024.01.016. Epub 2024 Feb 9.

The HRI branch of the integrated stress response selectively triggers mitophagy

Affiliations

The HRI branch of the integrated stress response selectively triggers mitophagy

Yogaditya Chakrabarty et al. Mol Cell. .

Abstract

To maintain mitochondrial homeostasis, damaged or excessive mitochondria are culled in coordination with the physiological state of the cell. The integrated stress response (ISR) is a signaling network that recognizes diverse cellular stresses, including mitochondrial dysfunction. Because the four ISR branches converge to common outputs, it is unclear whether mitochondrial stress detected by this network can regulate mitophagy, the autophagic degradation of mitochondria. Using a whole-genome screen, we show that the heme-regulated inhibitor (HRI) branch of the ISR selectively induces mitophagy. Activation of the HRI branch results in mitochondrial localization of phosphorylated eukaryotic initiation factor 2, which we show is sufficient to induce mitophagy. The HRI mitophagy pathway operates in parallel with the mitophagy pathway controlled by the Parkinson's disease related genes PINK1 and PARKIN and is mechanistically distinct. Therefore, HRI repurposes machinery that is normally used for translational initiation to trigger mitophagy in response to mitochondrial damage.

Keywords: autophagy; integrated stress response; iron metabolism; mitochondria; mitophagy; organelle quality control.


Conflict of interest statement

Declaration of interests The authors declare no competing interests.

Figures

Figure 1.
Figure 1.. CRISPRi screen identifies HRI components as mitophagy factors.
(A) Visualization of mitophagy with mito-mKeima. Ratiometric imaging was used to detect mitochondria in acidic compartments in HeLa cells expressing mito-mKeima. Red mitochondria have a high acidic/neutral ratio. Scale bars, 10 μm. (B) Quantification of mitophagy in mito-mKeima-expressing K562 cells by analysis of the mKeima acidic/neutral ratio with flow cytometry. Bafilomycin A1 (BFA1) was used to block mitophagy. (C) Workflow of the CRISPRi screen. Cells harboring the CRISPRi library were treated with DFP to induce mitophagy, and cells showing the 25% lowest and highest levels of mitophagy were collected for sgRNA analysis by deep sequencing. (D) Volcano plot of sgRNAs from mitophagy screen. For each sgRNA, the phenotype effect size is plotted on the x-axis, and the p-value on the y-axis. The dotted line indicates the threshold for hits based on an integrated score for effect size and p-value. Hits of interest are highlighted in magenta and labeled. (E) Confirmation of hits from mitophagy screen. Flow cytometry of mito-mKeima was used to quantify DFP-induced mitophagy after expression of sgRNA against indicated genes (NT, non-targeting; mean ± s.d., n≥4). The following p-value designations are used in all figures: ****, p≤0.0001; ***, p≤0.001; **, p≤0.01; *, p≤0.05; ns, p≥0.05. See also Figure S1 and Table S1.
Figure 2.
Figure 2.. Iron chelation induces HRI, but mitophagy does not require ATF4.
(A) A cartoon depicting the HRI branch of the ISR. Upon mitochondrial stress, the OMA1 metalloprotease cleaves DELE1 to generate a cleaved fragment S that is released from mitochondria and activates the kinase activity of HRI. HRI phosphorylates EIF2α and causes EIF2 to form an inhibited complex with its guanine nucleotide exchange factor EIF2B. Due to this depletion of EIF2B activity, EIF2-GDP (labeled “D”) cannot be converted to its active GTP-bound state (labeled “T”). (B) Induction of ISR by DFP. Control K562 cells and DFP-treated cells were analyzed by Western blotting for the indicated proteins. β-ACTIN is the loading control. (C) Volcano plot of the genome-wide CRISPRi screen indicating HRI (magenta) versus other key factors (black) of the ISR. (D) Effect of ATF4 knockdown on DFP-induced mitophagy. After addition DFP for 24 h, mitophagy was measured by flow cytometry in K562 cells (mean ± s.d., n=3). See also Figure S2 and Table S1. (E) Effect of translation inhibitors harringtonine (Htn) and cycloheximide (CHX) on mitophagy. See also Figure S2.
Figure 3.
Figure 3.. HRI is the only ISR branch that triggers mitophagy.
(A) A schematic of the chemical reagents (rectangles on left) activating the four branches of the ISR. Each branch contains a key kinase that phosphorylates EIF2α to suppress global translation and activate ATF4 translation. Salubrinal can also increase p-EIF2α by inhibiting its phosphatases. (B) Mitophagy induction upon BTd and Sal treatment, and dependence on HRI. K562 cells were treated with indicated concentrations of BTd or Sal for 24 h, and mitophagy was quantified by flow cytometry (mean ± s.d., n=3). (C) ISR induction by BTd and Sal. K562 cells were treated with 10 μM BTd or 10 μM Sal for 24 h, and the indicated proteins were analyzed by immunoblotting. For LC3B, the band labeled II is the lipidated form that is a marker for autophagy. (D) Suppression of mitophagy by CREP overexpression. Mitophagy was measured in K562 cells expressing GFP-CREP or control (GFP), after treatment with the indicated compounds. (E) Mitophagy levels in K562 cells upon 24 h treatment with reagents that activate distinct branches of the ISR. Bottom, immunoblotting of the corresponding samples for p-EIF2α and β-ACTIN (loading control). (F) Effect of HRI pathway on Sal-induced mitophagy. K562 cells expressing non-targeting (NT) sgRNA or sgRNA against indicated genes were treated with vehicle (DMSO) or Sal, and mitophagy levels were quantified by flow cytometry (mean ± s.d., n≥4). See also Figure S3.
Figure 4.
Figure 4.. Recruitment of p-EIF2α to mitochondria triggers mitophagy.
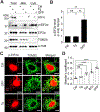
(A) Biochemical localization of p-EIF2α to mitochondria after DFP treatment. After the indicated treatments, K562 cells were lysed, and mitochondrial (Mito) and cytosolic fractions (Cyto) were analyzed by immunoblotting. TOM20, mitochondrial marker; α-TUB, loading control. (B) Quantification of p-EIF2α mitochondrial localization. Mitochondrial localization was analyzed as in (A) and quantified by densitometry (mean ± s.d., n=3). Values plotted were normalized to control cells. (C) Immunofluorescent staining of p-EIF2α during DFP-induced mitophagy. HeLa cells were treated with DMSO, 2 μM Tg, or 1 mM DFP for 24 h and analyzed with antibodies against p-EIF2α and TOM20. Inset shows magnified image of the boxed area. (D) Quantification of the colocalization between p-EIF2α and TOM-20 signals (mean ± s.d., n=10). The mean Mander’s coefficient was calculated from 10 images per experiment, and 2-way ANOVA was used for statistical analysis from 4 independent experiments. See also Figure S4.
Figure 5.
Figure 5.. Recruitment of phosphomimetric EIF2a to mitochondria is sufficient to induce mitophagy.
(A) Schematic of experimental system for induced tethering of EIF2 to mitochondria. The top rectangle shows the two constructs that are expressed. The FRB-hFis1 fusion protein is expressed on the mitochondrial OM, due to the OM targeting sequence of hFis1. The EIF2α fusion protein is cytosolic until rapalog is added. Rapalog mediates heterodimerization between FKBP and FRB, thereby bringing the EIF2α fusion protein to the mitochondrial surface. (B) Mitophagy induction in K562 cells upon recruitment of EIF2α to mitochondria. Control cells or cells expressing EIF2αWT, EIF2αS51A (phosphomutant), or EIF2αS51D (phosphomimetic) were treated with vehicle (EtOH) or rapalog, and then analyzed for mitophagy by flow cytometry. For (B-D), mean ± s.d. is shown; n=3. (C) Mitophagy induction in HeLa cells expressing EIF2 conditionally tethered to mitochondria by FRB-FKBP system. Experiment was performed as in (B), except that HeLa cells were used. (D) Similar to (B), except cells contained EIF2α targeted to peroxisomes by rapalog, due to expression of FRB fused to the peroxisomal targeting sequence of PEX26. Cells also contained peroxisomally targeted mKeima, a reporter for pexophagy. See also Figure S5.
Figure 6.
Figure 6.. HRI is broadly required for mitophagy.
(A) Biochemical localization of p-EIF2α to mitochondria during PARKIN-mediated mitophagy. HeLa cells expressing PARKIN were treated with Tg or CCCP for 4 h, and subcellular fractionation was performed to obtain a mitochondrial and cytosolic fraction. Fractions were analyzed by immunoblotting against the indicated proteins. CCCP induces PARKIN-mediated mitophagy. (B) Quantification of results in (A) (mean ± s.d., n=2). Values plotted were normalized to control cells. (C) Immunofluorescent analysis of p-EIF2α during PARKIN-mediated mitophagy. (D) Quantification of colocalization of p-EIF2α with mitochondria using Mander’s coefficient, performed as in Figure 4D. (E) Effect of HRI components on PARKIN-mediated mitophagy. PARKIN-HeLa cells expressing the indicated shRNA were treated with vehicle (DMSO) or 10 μM CCCP for 24 h. Mitophagy was quantified by flow cytometry (mean ± s.d., n≥3). (F, G) Effect of HRI components on hypoxia-induced (F) and DMOG-induced mitophagy (G). HeLa cells expressing shRNA against the indicated genes were induced to undergo mitophagy. Mitophagy was quantified by flow cytometry (mean ± s.d., n≥3). See also Figure S6.
Figure 7.
Figure 7.. HRI and PINK1/PARKIN pathways are mechanistically distinct.
(A) Subcellular localization of PARKIN, after application of CCCP. PARKIN-expressing HeLa cells were transduced with control (NT) shRNA or shRNA against HRI and treated with vehicle or CCCP for 1 h. TOM20 is a mitochondrial marker. (B) PINK1 and phospho-ubiquitin levels in HeLa cells. Cells expressed control or HRI shRNAs and were treated with vehicle or CCCP as indicated. BFA1 was used to block autophagy. (C) Colocalization of LC3B-GFP, a marker for autophagosomes, with TOM20 (mitochondria). Cells expressed control or HRI shRNAs and were treated with CCCP or DFP as indicated. The JACoP plugin of Fiji was used to determine colocalization. (D) Effect of HRI on mitophagy levels of cells expressing ubiquitin chains targeted to the mitochondrial surface. HeLa cells constitutively expressing the indicated shRNAs were transiently transfected with mitochondrial EGFP or OMM-2Ub-KO, a plasmid expressing a dual ubiquitin chain targeted to the outer mitochondrial membrane (OMM). Mitophagy was quantified by flow cytometry (mean ± s.d., n≥3). (E) Phospho-ubiquitin levels in K562 cells upon recruitment of phosphomimetic EIF2α to mitochondria. Cells expressing FRB-Fis1, or FRB-Fis1 with EIF2aS51A or EIF2aS51D, were treated with vehicle (EtOH) or rapalog, and then analyzed by Western blotting for phospho-rubiquitin. Actin was used as loading control. See also Figure S7.

References

    1. Pickles S, Vigié P, and Youle RJ (2018). Mitophagy and Quality Control Mechanisms in Mitochondrial Maintenance. Curr Biol 28, R170–R185. 10.1016/j.cub.2018.01.004. - DOI - PMC - PubMed
    1. Onishi M, Yamano K, Sato M, Matsuda N, and Okamoto K (2021). Molecular mechanisms and physiological functions of mitophagy. EMBO J 40, e104705. 10.15252/embj.2020104705. - DOI - PMC - PubMed
    1. Narendra D, Tanaka A, Suen D-F, and Youle RJ (2008). Parkin is recruited selectively to impaired mitochondria and promotes their autophagy. J Cell Biol 183, 795–803. 10.1083/jcb.200809125. - DOI - PMC - PubMed
    1. Costa-Mattioli M, and Walter P (2020). The integrated stress response: From mechanism to disease. Science 368. 10.1126/science.aat5314. - DOI - PMC - PubMed
    1. Mick E, Titov DV, Skinner OS, Sharma R, Jourdain AA, and Mootha VK (2020). Distinct mitochondrial defects trigger the integrated stress response depending on the metabolic state of the cell. eLife 9, e49178. 10.7554/eLife.49178. - DOI - PMC - PubMed

MeSH terms

LinkOut - more resources