. 2024 Apr 17;112(8):1235-1248.e5.
doi: 10.1016/j.neuron.2024.01.013. Epub 2024 Feb 9.

Epigenetic dysregulation in Alzheimer's disease peripheral immunity

Affiliations

Epigenetic dysregulation in Alzheimer's disease peripheral immunity

Abhirami Ramakrishnan et al. Neuron. .

Abstract

The peripheral immune system in Alzheimer's disease (AD) has not been thoroughly studied with modern sequencing methods. To investigate epigenetic and transcriptional alterations to the AD peripheral immune system, we used single-cell sequencing strategies, including assay for transposase-accessible chromatin and RNA sequencing. We reveal a striking amount of open chromatin in peripheral immune cells in AD. In CD8 T cells, we uncover a cis-regulatory DNA element co-accessible with the CXC motif chemokine receptor 3 gene promoter. In monocytes, we identify a novel AD-specific RELA transcription factor binding site adjacent to an open chromatin region in the nuclear factor kappa B subunit 2 gene. We also demonstrate apolipoprotein E genotype-dependent epigenetic changes in monocytes. Surprisingly, we also identify differentially accessible chromatin regions in genes associated with sporadic AD risk. Our findings provide novel insights into the complex relationship between epigenetics and genetic risk factors in AD peripheral immunity.

Keywords: Alzheimer's disease; T cells; bioinformatics; chromatin; epigenetics; immunity; monocytes; single-cell ATAC-seq; single-cell RNA sequencing; transcriptomics.


Conflict of interest statement

Declaration of interests D.G. is an inventor on a patent related to this work. Patent US-2022-0170908-A1 is for compositions and methods for measuring T cell markers associated with AD.

Figures

Figure 1.
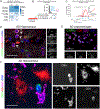
Figure 1.. Study design and resource generation.
(A) Schematic depicting experimental design and bioinformatics pipeline of the study. (B) Uniform manifold approximation and projection of scATAC cells (left) labeled using matched scRNA cells (right) labeled using a CITE-Seq atlas. (C) Scan QR code to view interactive ShinyCell application hosting RNA and TCR datasets. (D) Schematic portraying study approach; methods include analysis of disease status and the effects on APOE genotype-associated epigenomes and transcriptomes (top) and analysis between APOE genotypes and effects on disease-associated epigenomes and transcriptomes (bottom).
Figure 2.
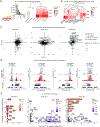
Figure 2.. Epigenetic dysregulation in AD peripheral immunity and concordance with differential gene expression.
(A) DARs of chromatin between AD and HCs by cell type using single cell LR and pseudobulk DESeq2 methods. The overlapping genes from these two statistical measures are used in all downstream analyses. UpSet plot shows unique and shared DARs by cell type with a corresponding heat map showing the ratios of DARs to regions tested. (B) Proportion of AD versus HC DARs by peak type and direction of accessibility. (C) Pathway analysis of AD vs HC DARs of CD8 T cells [HC cells = 57326, median interquartile range (IQR) = 1969 (963.25 – 2771.25), AD cells = 53974, median (IQR) = 1304 (668.75 – 2682)]. indicating increased activation and cytokine signaling and reduced cellular senescence in AD. (D) DEGs between AD and HCs by cell type using MAST and pseudobulk edgeR methods. The overlapping genes from these two statistical measures are used in all downstream analyses. UpSet plot shows unique and shared DEGs by cell type with a corresponding heat map showing the ratios of DEGs to genes tested. (E) Overlapping significant genes by scATACseq and scRNAseq by cell type indicating CD14 and CD16 monocytes and CD8 TEM cells as having the most overlapping genes with altered chromatin accessibility and altered gene expression in AD.
Figure 3.
Figure 3.. Epigenetic changes to NF-κB signaling molecules in peripheral AD monocytes.
(A) Scatterplots showing AD vs. HC DARs intersecting DEGs by fold change in CD14 and CD16 monocytes. (B) Transcription factor motif scanning analysis showing enrichment of REL and RELA binding sites in AD monocytes, where transcription factors are ranked by product of log(p-value) and log2(fold-change). (C) maxATAC analysis of TFBS in the NFκB2 gene indicating an AD-specific RELA binding site. (D) Chromatin track of the NFκB2 gene demonstrating the location of the AD-specific RELA binding site. The RELA binding site (red) is adjacent to an NFκB2 DAR (light blue). (E) Pathway analyses of upregulated DEGs of AD versus HC CD14 and CD16 monocytes indicating enrichment of NFκB signaling. ATAC-seq assay: HC monocytes = 9763, median (IQR) = 311 (163.25 – 451.75), AD monocytes = 7162, median (IQR) = 242.5 (112.5 – 397.75). RNA-seq assay: HC CD14 monocytes = 4414, median (IQR) = 105 (55 – 254.25), AD CD14 monocytes = 3455, median (IQR) = 61.5 (11 – 148), HC CD16 monocytes = 1837, median (IQR) = 42 (5 – 108), AD CD16 monocytes = 899, median (IQR) = 13 (4 – 41.25).
Figure 4.
Figure 4.. Cis-regulatory sequence correlates with quantity of transcription of CXCR3 in CD8 T cells, which home to the AD brain.
(A) Number of gene promoter to region connections filtered for only significant correlations with corresponding gene expression [> 95th % of Pearson correlation coefficient (PCC) per cell type; P-adjusted<0.05]. (B) Overlap of significant promoter-region correlations with AD vs HC DEGs in CD8 TEM cells. (C) Representative Cicero CXCR3 promoter-region connections (bottom; HC in gray, AD in red). CXCR3 distal region accessibility (CD8 T cells) to gene expression (CD8 TEM cells) correlation in AD samples (top). (D) CXCR3-expressing CD8 T cells in post-mortem AD hippocampus. Arrowheads indicate CXCR3+CD3+CD8+ T cells. Scale bar=15 μm. (E) CXCR3+CD3+CD8+ T cells in post-mortem AD leptomeninges. Scale bar=20 μm. (F) A CD3+ T cell interacting with an Aβ plaque-associated Iba1+ microglial cell. Scale bar=10 μm.
Figure 5.
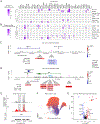
Figure 5.. APOE genotype-dependent innate immune dysregulation in AD.
(A) UpSet plot of AD vs. HC APOE genotype comparisons indicating increasing number of unique DARs by number of APOE ε4 alleles. Corresponding heatmap shows DARs by cell type for each APOE genotype comparison between AD and HC subjects. (B) Total number of overlapping DARs and DEGs by cell type for each APOE genotype comparison between AD and HC subjects indicating increasing number of genes in AD monocytes by number of APOE ε4 alleles. (C) Scatterplots showing DARs intersecting DEGs by fold change in CD14 monocytes for each AD vs. HC APOE genotype comparison. (D) Representative chromatin tracks of DARs intersecting DEGs in AD vs. HC APOE ε4/ε4 carriers. For each gene, significant DARs are shown in grey. (E) Transcription factor motif analysis in monocytes indicating enrichment of inflammatory transcription factors in AD APOE ε4/ε4 carriers, where transcription factors are ranked by product of log(p-value) and log2(fold-change). Group sizes for all comparisons: n = 9 HC APOE ε3/ε3, 10 HC APOE ε3/ε4, 7 HC APOE ε4/ε4, 10 AD APOE ε3/ε3, 11 AD APOE ε3/ε4, 8 AD APOE ε4/ε4. ATAC-seq assay: HC APOE ε3/ε3 monocytes = 2647, median (IQR) = 227.5 (135.75 – 542.5), HC APOE ε3/ε4 monocytes = 3436, median (IQR) = 275 (250 – 410), HC APOE ε4/ε4 monocytes = 3680, median (IQR) = 357 (296 – 657), AD APOE ε3/ε3 monocytes = 1968, median (IQR) = 217.5 (163 – 280), AD APOE ε3/ε4 monocytes = 3734, median (IQR) = 299 (114 – 470), AD APOE ε4/ε4 monocytes = 1460, median (IQR) = 214 (58 – 291). RNA-seq assay: HC APOE ε3/ε3 CD14 monocytes = 833, median (IQR) = 75 (61.5 – 127), HC APOE ε3/ε4 CD14 monocytes = 2255, median (IQR) = 127 (11 – 262), HC APOE ε4/ε4 CD14 monocytes = 1326, median (IQR) = 198.5 (85.75 – 281.25), AD APOE ε3/ε3 CD14 monocytes = 1607, median (IQR) = 62 (14 – 166), AD APOE ε3/ε4 CD14 monocytes = 1334, median (IQR) = 115 (59.5 – 168), AD APOE ε4/ε4 CD14 monocytes = 514, median (IQR) = 11 (3.5 – 40).
Figure 6.
Figure 6.. Epigenetic dysregulation of AD risk genes in the peripheral immune system.
(A) Heatmap depicting number of DARs in AD risk genes by cell type comparing AD vs. HC. (B) Heatmap depicting number of DARs in AD risk genes by cell type comparing AD vs. HC APOE ε4/ε4 carriers (n = 7 HC APOE ε4/ε4, 8 AD APOE ε4/ε4). (C) Chromatin track of ABCA1 showing locations of significant DARs in various peripheral immune cell types of AD vs. HC APOE ε4/ε4 carriers (n = 7 HC APOE ε4/ε4, 8 AD APOE ε4/ε4). (D) Chromatin track of BIN1 showing locations of significant DARs in various peripheral immune cell types of AD vs. HC APOE ε4/ε4 carriers (n = 7 HC APOE ε4/ε4, 8 AD APOE ε4/ε4). (E) Chromatin track of BIN1 showing the significant DARs in CD8 T cells of AD vs. HC APOE ε4/ε4 carriers (n = 7 HC APOE ε4/ε4, 8 AD APOE ε4/ε4). (F) Uniform manifold approximation and projection plot of clonal and non-clonal T cells from scTCRseq analysis of scRNAseq data. (G) Volcano plot showing BIN1 upregulation in clonal CD8 TEM cells in AD vs. HC APOE ε4/ε4 carriers [n = 7 HC APOE ε4/ε4, 8 AD APOE ε4/ε4. HC APOE ε4/ε4 clonal CD8 TEMs = 4019, median (IQR) = 652.5 (485.75 – 942.25), AD APOE ε4/ε4 clonal CD8 TEMs = 7120, median (IQR) = 526.5 (185.25 – 1264.25)].

References

    1. Selkoe DJ (2001). Alzheimer’s disease: genes, proteins, and therapy. Physiol Rev 81, 741–766. 10.1152/physrev.2001.81.2.741. - DOI - PubMed
    1. Grupe A, Abraham R, Li Y, Rowland C, Hollingworth P, Morgan A, Jehu L, Segurado R, Stone D, Schadt E, et al. (2007). Evidence for novel susceptibility genes for late-onset Alzheimer’s disease from a genome-wide association study of putative functional variants. Hum Mol Genet 16, 865–873. 10.1093/hmg/ddm031. - DOI - PubMed
    1. Naj AC, Jun G, Beecham GW, Wang LS, Vardarajan BN, Buros J, Gallins PJ, Buxbaum JD, Jarvik GP, Crane PK, et al. (2011). Common variants at MS4A4/MS4A6E, CD2AP, CD33 and EPHA1 are associated with late-onset Alzheimer’s disease. Nat Genet 43, 436–441. 10.1038/ng.801. - DOI - PMC - PubMed
    1. Lambert JC, Ibrahim-Verbaas CA, Harold D, Naj AC, Sims R, Bellenguez C, DeStafano AL, Bis JC, Beecham GW, Grenier-Boley B, et al. (2013). Meta-analysis of 74,046 individuals identifies 11 new susceptibility loci for Alzheimer’s disease. Nat Genet 45, 1452–1458. 10.1038/ng.2802. - DOI - PMC - PubMed
    1. Lambert JC, Heath S, Even G, Campion D, Sleegers K, Hiltunen M, Combarros O, Zelenika D, Bullido MJ, Tavernier B, et al. (2009). Genome-wide association study identifies variants at CLU and CR1 associated with Alzheimer’s disease. Nat Genet 41, 1094–1099. 10.1038/ng.439. - DOI - PubMed