. 2024 Mar 11;59(5):595-612.e8.
doi: 10.1016/j.devcel.2024.01.011. Epub 2024 Feb 9.

Identification of a core transcriptional program driving the human renal mesenchymal-to-epithelial transition

Affiliations

Identification of a core transcriptional program driving the human renal mesenchymal-to-epithelial transition

John-Poul Ng-Blichfeldt et al. Dev Cell. .

Abstract

During kidney development, nephron epithelia arise de novo from fate-committed mesenchymal progenitors through a mesenchymal-to-epithelial transition (MET). Downstream of fate specification, transcriptional mechanisms that drive establishment of epithelial morphology are poorly understood. We used human iPSC-derived renal organoids, which recapitulate nephrogenesis, to investigate mechanisms controlling renal MET. Multi-ome profiling via snRNA-seq and ATAC-seq of organoids identified dynamic changes in gene expression and chromatin accessibility driven by activators and repressors throughout MET. CRISPR interference identified that paired box 8 (PAX8) is essential for initiation of MET in human renal organoids, contrary to in vivo mouse studies, likely by activating a cell-adhesion program. While Wnt/β-catenin signaling specifies nephron fate, we find that it must be attenuated to allow hepatocyte nuclear factor 1-beta (HNF1B) and TEA-domain (TEAD) transcription factors to drive completion of MET. These results identify the interplay between fate commitment and morphogenesis in the developing human kidney, with implications for understanding both developmental kidney diseases and aberrant epithelial plasticity following adult renal tubular injury.

Keywords: epithelial polarity; kidney development; mesenchymal-to-epithelial transition; organoids; transcriptional regulation.


Conflict of interest statement

Declaration of interests J.M.W. is an employee and stockholder of AstraZeneca.

Figures

Graphical abstract
Graphical abstract
Figure 1
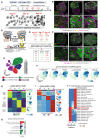
Figure 1. snRNA-seq and snATAC-seq profiling of human renal organoids identifies dynamic gene expression and chromatin accessibility signatures during renal MET
(A) Schematic of protocol used to generate human renal organoids from iPSCs, with corresponding light microscopy images of organoids during MET (days 10–14) (protocol adapted from Kumar et al. and Takasato et al.). Scale bars, 400 μm. (A) Schematic of MET in the human kidney through polarization of pre-tubular aggregate cells into a renal vesicle and schematic of cellular changes during epithelial polarization. (B and C) Immunofluorescence showing expression of (B) aPKC (yellow), integrin β1 (ITGB1) (magenta), and HNF1B (green), or (C) ZO1 (yellow), E-cadherin/CDH1 (magenta), and HNF1B (green), in renal organoids over the time course of MET. Dotted white boxes indicate positions of magnification panels below, scale bars, 20 μm. (D) Schematic of renal organoid multi-ome profiling strategy for batch 2 and batch 3 individually. *For batch 3, two day 14 samples were sequenced in parallel: one treated with DMSO from days 12 to 14, and one treated with 3 μM CHIR 99021 (CHIR, a GSK3 inhibitor) from days 12 to 14 (related to Figures 7, S7, and S8). (E) UMAP representation of 9,147 cells from multi-ome batch 3 projected according to ATAC data, clustered by epithelial lineage time point, and stromal lineage (all time points combined). (F) Gene expression levels of CDH1, EPCAM, PARD3, CTNNA2, PATJ, and PARD3B overlaid on UMAP plots. (G) Heatmap of expression of marker genes for clusters in (E) determined by snRNA-seq with representative markers annotated (left, log2FC > 1, FDR < 0.01, two-sided Wilcoxon rank-sum test; log2FC, log2 fold change; FDR, false discovery rate). Gene expression UMAP plots of cluster-specific transcription factors (right). (H) Unique GO terms represented in enriched genes from (G), full list in Table S2. (I) Heatmap of marker peaks of accessible chromatin for clusters in (E) determined by snATAC-seq (left, log2FC > 1, FDR < 0.01, two-sided Wilcoxon rank-sum test). Motif accessibility UMAP plots of cluster-specific transcription factors from (G) (right). (J) Heatmap of transcription factor motif archetypes enriched in epithelial-specific peaks from (I). Annotated are archetype codes, archetypal transcription factors and DNA-binding class. Wnt/β-catenin transcriptional effectors TCF7/LEF are highlighted (red). See also Figures S1–S3.
Figure 2
Figure 2. Early transcriptional activators driving renal mesenchymal-to-epithelial transition
(A) UMAP of 9,147 cells from multi-ome batch 3 projected according to ATAC data, with clusters annotated according to epithelial or stromal lineage. (B) UMAP plots of multi-ome cells from batch 3, colored by PAX8 gene expression (top) and TWIST1 gene expression (bottom). (C) Heatmap of expression of marker genes for clusters in (A) determined by snRNA-seq with representative marker genes annotated (log2FC > 1, FDR < 0.01, two-sided Wilcoxon rank-sum test). (D) Heatmap of marker peaks of accessible chromatin for clusters in (A) determined by snATAC-seq (left, log2FC > 1, FDR < 0.01, two-sided Wilcoxon ranksum test). (E) Schematic of the principle by which correlation values, between transcription factor gene expression and corresponding motif accessibility, were used to classify transcription factors as either transcriptional repressors or activators. PCC, Pearson correlation coefficient. (F) Transcription factors plotted according to PCC of gene expression vs. corresponding motif accessibility, and log2FC gene expression in the epithelial lineage compared with the stromal lineage as determined by snRNA-seq. Thresholds used to color points according to principle outlined in (D): PCC > 0.2, log2FC epithelial lineage > 1.5 (red = activators), PCC < − 0.2, log2FC epithelial lineage > 1.5 (blue, repressors). (F) Zoom in showing the epithelial activators identified in (F) with gene names labeled. See also Figure S4.
Figure 3
Figure 3. Human iPSC-derived kidney organoids show congruence with committed cap mesenchyme and subsequent epithelial derivatives in human fetal kidney in vivo
(A) UMAP plot of 8,862 scRNA-seq cells from 6 human fetal kidney samples harvested between post conception weeks (pcw) 7 and 16, showing nephron epithelial lineage only, with developmental milestones, uncommitted cap mesenchyme (CM), committed CM, committed epithelium, podocytes, loop of Henle, proximal tubular epithelial cells (PTECs), annotated. (B) UMAP plot of 8,862 scRNA-seq cells as in (A) with the nephron pseudotime trajectory overlaid. (C) Expression of marker genes of nephron developmental stages within fetal scRNA-seq data, split across the developmental milestones highlighted in the UMAP in (A). (D) Prediction of milestone labels within organoid scRNA-seq and snRNA-seq data. Based on the milestones identified in the human fetal scRNA-seq data, the fraction of cells representing these milestones within both the pooled organoid scRNA-seq data (days 10, 14, and 24 of batches 1, 2, and 3) and the snRNA-seq data (days 10, 12, and 14 of batch 3) were analyzed and plotted as a heatmap for the different days along the protocol that were analyzed. See also Figure S2.
Figure 4
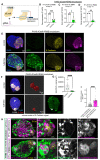
Figure 4. PAX8 is a critical upstream regulator of MET in human renal organoids
(A) Schematic of the dCas9-KRAB CRISPR interference gene perturbation system. (B–D) RT-qPCR for (B) PAX8, (C) E-cadherin/CDH1, and (D) PAX2 in organoids generated from PAX8-dCas9-KRAB iPSCs and harvested at day 14, either with no treatment (control, white bars) or following Dox treatment from day 4 (1 μM Dox, green bars) from 2 or 3 independent organoid batches. Dots represent data from each batch normalized to corresponding control, with bars representing mean ± SEM. Unpaired t test, *p < 0.05, **p < 0.01, ***p < 0.001, compared with corresponding control. (E) Immunofluorescence of organoids generated from PAX8-dCas9-KRAB iPSCs and harvested at day 14, either with no treatment (control, top) or following Dox treatment from day 4 (1 μM Dox, bottom), showing GFP (green), PAX8 (magenta), E-cadherin/CDH1 (yellow) with DAPI as counterstain (blue, nuclei). White brackets indicate PAX8+CDH1+ cells confined to a GFP region. Scale bars, 25 μm. (F) Immunofluorescence images showing projected z stacks of whole organoids of PAX8-dCas9-KRAB organoids at day 14, either with no treatment (control, top) or following Dox treatment from day 4 (1 μM Dox, bottom), showing PAX8 (white), E-cadherin (red), and DAPI (blue, nuclei) alongside volume render of corresponding E-cadherin/CDH1 signal (middle), and GFP expression after Dox treatment (green, right bottom). Arrow points to GFP region that contains PAX8+CDH1+ cells. Scale bars, 30 μm. (G) Quantification of volume-rendered E-cadherin/CDH1 signal in PAX8-dCas9-KRAB organoids at day 14 either with no treatment (control, white bar; n = 18 organoids across 2 independent batches) or following Dox treatment from day 4 (1 μM Dox, green bar; n = 14 organoids across 2 independent batches). Dots represent data from individual organoids, with bars representing mean ± SEM. Unpaired t test, ****p < 0.0001. (H) Rescue of MET in cells with PAX8-dCas9-KRAB-mediated PAX8 knockdown by lentiviral overexpression of PAX8. Immunofluorescence of organoids generated from PAX8-dCas9-KRAB iPSCs and harvested at day 14, following Dox treatment from day 4 (1 μM Dox, bottom), and either infected with an empty lentivirus (EF1α::ctrl/mCherry, top) or PAX8-overexpressing lentivirus (EF1α::PAX8/mCherry, bottom). GFP (green), labels PAX8-knockdown cells, magenta labels mCherry in lentivirus-infected cells (±PAX8), and E-cadherin/CDH1 is in yellow. The white box indicates regions magnified in subsequent panels, the white dotted lines mark the outline of a polarized epithelial structure. Scale bars, 20 or 30 μm as indicated. (I) Quantification of volume-rendered GFP+ signal as a fraction of total E-cadherin/CDH1 signal in Dox-treated PAX8-dCas9-KRAB organoids at day 14 either infected with an empty lentivirus (EF1α::ctrl/mCherry, gray bar; n = 33 organoids across 2 independent batches) or PAX8-overexpressing lentivirus (EF1α::PAX8/mCherry, magenta bar; n = 34 organoids across 2 independent batches). Dots represent data from individual organoids, with bars representing mean ± SEM. Unpaired t test, ****p < 0.0001. See also Figure S5.
Figure 5
Figure 5. PAX8 is predicted to activate a cell-adhesion gene expression program to initiate MET in human renal organoids
(A) Immunofluorescence analysis of organoids showing PAX8 (white, top) with DAPI as counterstain (blue, nuclei), with corresponding expression of HNF1B and E-cadherin/CDH1 (green and magenta, respectively, bottom) at days 10, 12, and 14. Scale bars, 25 μm. (B) Footprint analysis of PAX8 and PAX2 motifs using cluster annotations from (Figure 1E). (C) GO terms overrepresented in the predicted PAX8 regulon (full list in Table S4). (D–F) Chromatin accessibility tracks for (D) CDH6, (E) E-cadherin/CDH1, and (F) HNF1B loci, split according to clusters annotated in Figure 1E, epithelium days 10, 12, 14, and stroma (all time points combined), with peak to gene links highlighted. Violin plots of gene expression determined by snRNA-seq (box center line, median; limits, upper and lower quartiles; whiskers, 1.5× interquartile range). Purple asterisks indicate overrepresentation of PAX8 motifs as determined by analysis with HOMER (see STAR Methods). See also Figure S5.
Figure 6
Figure 6. Dynamic activity of transcriptional activators and repressors drives renal MET
(A) UMAP plot of 9,147 multi-ome cells from batch 3 colored according to tube epithelial pseudotime, as computed in ArchR. (B) Cells from batch 3 plotted according to tube epithelial pseudotime as in (A), and gene expression of EPCAM and E-cadherin/CDH1, with time points indicated below. (C) Alignment of organoid tube epithelial pseudotime with fetal nephron pseudotime. The arrow indicates the path through the minima of the cost matrix where the trajectories best align. (D) Heatmaps (left) of gene expression and corresponding motif accessibility along tube epithelial pseudotime for transcriptional activators (PCC gene expression vs. motif accessibility along pseudotime > 0.2). Plots (right) of gene expression and motif accessibility of example downregulated activators TCF7 and LEF1, and an example upregulated activator HNF1B, along tube epithelial pseudotime. (E) Heatmaps (left) of gene expression and corresponding motif accessibility along tube epithelial pseudotime for transcriptional repressors (PCC gene expression vs. motif accessibility along pseudotime < −0.2). Plots (right) of gene expression and motif accessibility of example downregulated repressors SNAI2 and ZEB1, and an example upregulated repressor FOXK1, along tube epithelial pseudotime. See also Figure S6.
Figure 7
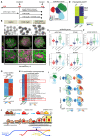
Figure 7. Attenuation of Wnt/β-catenin signaling allows completion of MET via HNF1B and TEAD
(A) Schematic of experimental design to test the effect of persistent Wnt/β-catenin pathway activation on completion of renal MET. (B) Organoids harvested at day 14 following treatments indicated in (A), with light microscopy images (top, scale bar 400 μm), and immunofluorescence images showing expression of HNF1B (green), E-cadherin/CDH1 (magenta), and ZO1 (yellow). Scale bars, 50 μm. (C) UMAP of cells from multi-ome batch 3 containing additional CHIR-treated group. (D) Heatmap of marker genes expression levels for DMSO-treated or CHIR-treated epithelium at day 14 determined by snRNA-seq with representative markers annotated (log2FC > 1, FDR < 0.01, two-sided Wilcoxon rank-sum test). (F and G) Gene expression violin plots of (E) NECTIN3, ITGA6, ITGB8, and BCAM, and (F) E-cadherin/CDH1, according to clusters annotated in (C). Box center line, median; limits, upper and lower quartiles; whiskers, 1.5× interquartile range. (G) Heatmap of marker peaks of chromatin accessibility for DMSO-treated or CHIR-treated epithelium at day 14 determined by snATAC-seq (left, log2FC > 1, FDR < 0.01, two-sided Wilcoxon rank-sum test). (H) Heatmap of transcription factor motif archetypes overrepresented in differentially accessible peaks from (G). Annotated are archetype codes, archetypal transcription factors and DNA-binding class. Highlighted in red are Wnt/β-catenin transcriptional effectors LEF1 and TCF7/LEF, and HNF1A/HNF1B and TEAD family transcription factor motif archetypes. (I) UMAP plots highlighting DMSO- and CHIR-treated epithelium at day 14 (top), with UMAPs corresponding to gene expression (left) and motif accessibility (right) for LEF1, HNF1B, and TEAD. (J) Our proposed model of the transcriptional control of morphogenetic events during human renal MET. See also Figures S7 and S8.

References

    1. Gilmour D, Rembold M, Leptin M. From morphogen to morphogenesis and back. Nature. 2017;541:311–320. - PubMed
    1. Rodriguez-Boulan E, Macara IG. Organization and execution of the epithelial polarity programme. Nat Rev Mol Cell Biol. 2014;15:225–242. - PMC - PubMed
    1. Costantini F, Kopan R. Patterning a complex organ: branching morphogenesis and nephron segmentation in kidney development. Dev Cell. 2010;18:698–712. - PMC - PubMed
    1. McMahon AP. Development of the Mammalian Kidney. Curr Top Dev Biol. 2016;117:31–64. - PMC - PubMed
    1. Kumar SV, Er PX, Lawlor KT, Motazedian A, Scurr M, Ghobrial I, Combes AN, Zappia L, Oshlack A, Stanley EG, Little MH. Kidney micro-organoids in suspension culture as a scalable source of human pluripotent stem cell-derived kidney cells. Development. 2019;146:dev172361. - PMC - PubMed

Publication types

Substances