

An anti-CD19/CTLA-4 switch improves efficacy and selectivity of CAR T cells targeting CD80/86-upregulated DLBCL
- PMID: 38340727
- PMCID: PMC10897622
- DOI: 10.1016/j.xcrm.2024.101421
An anti-CD19/CTLA-4 switch improves efficacy and selectivity of CAR T cells targeting CD80/86-upregulated DLBCL
Abstract
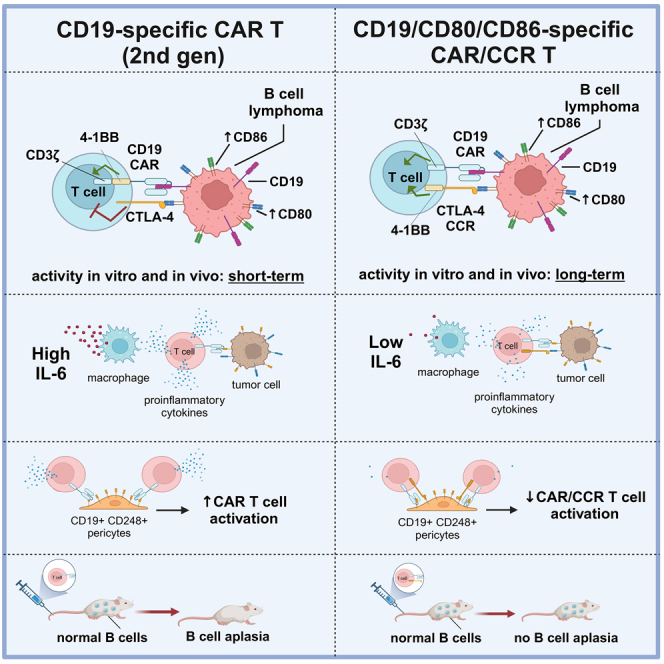
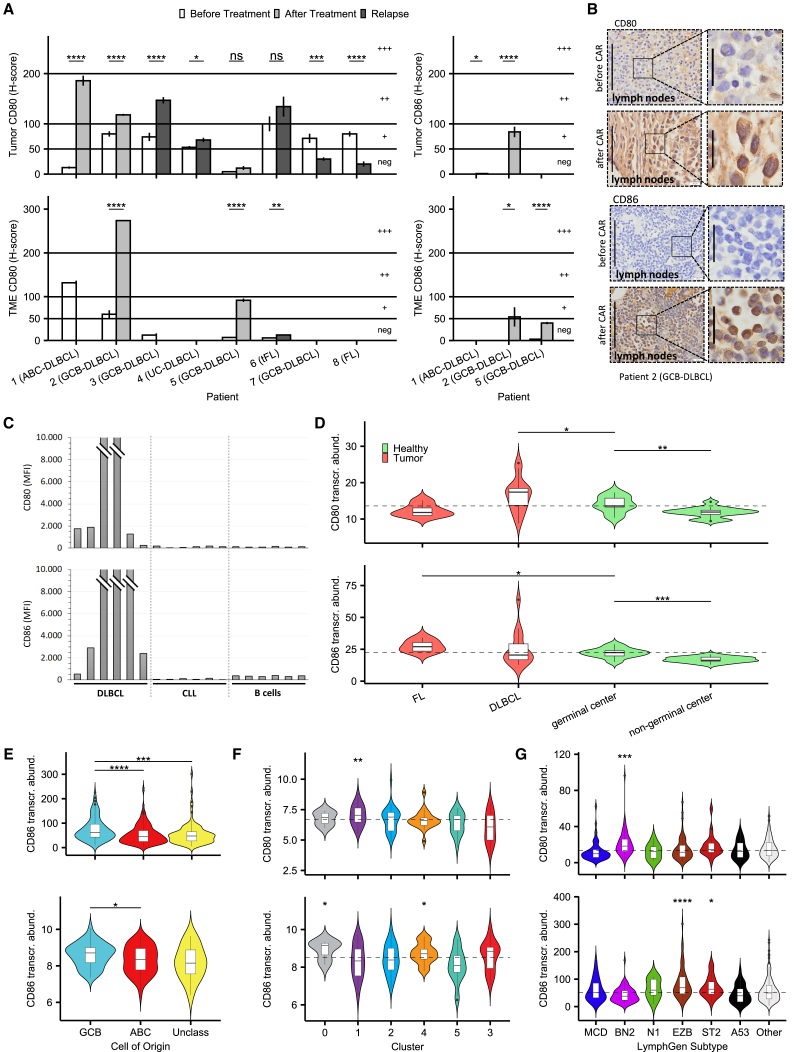
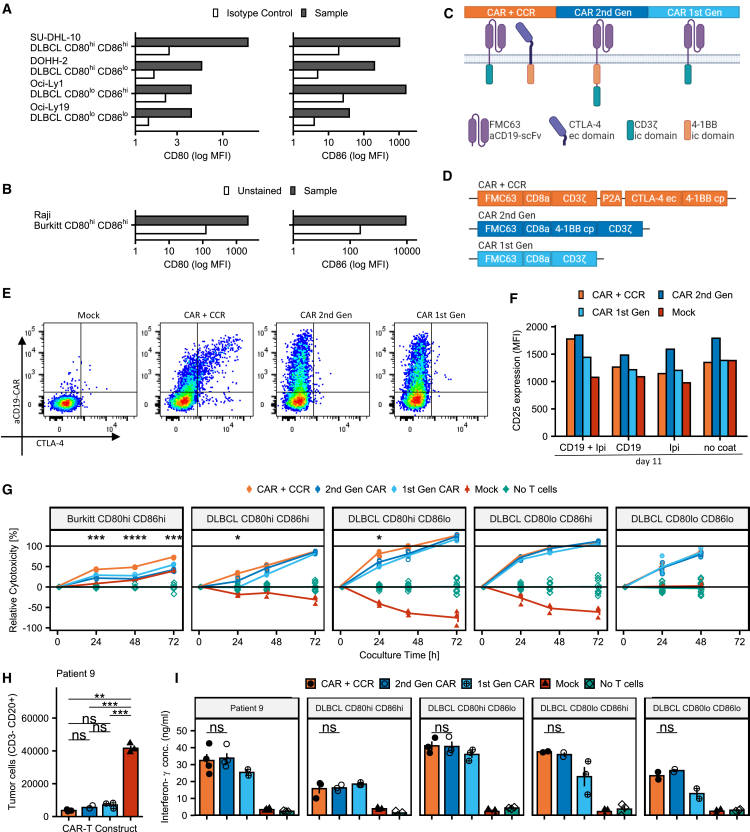
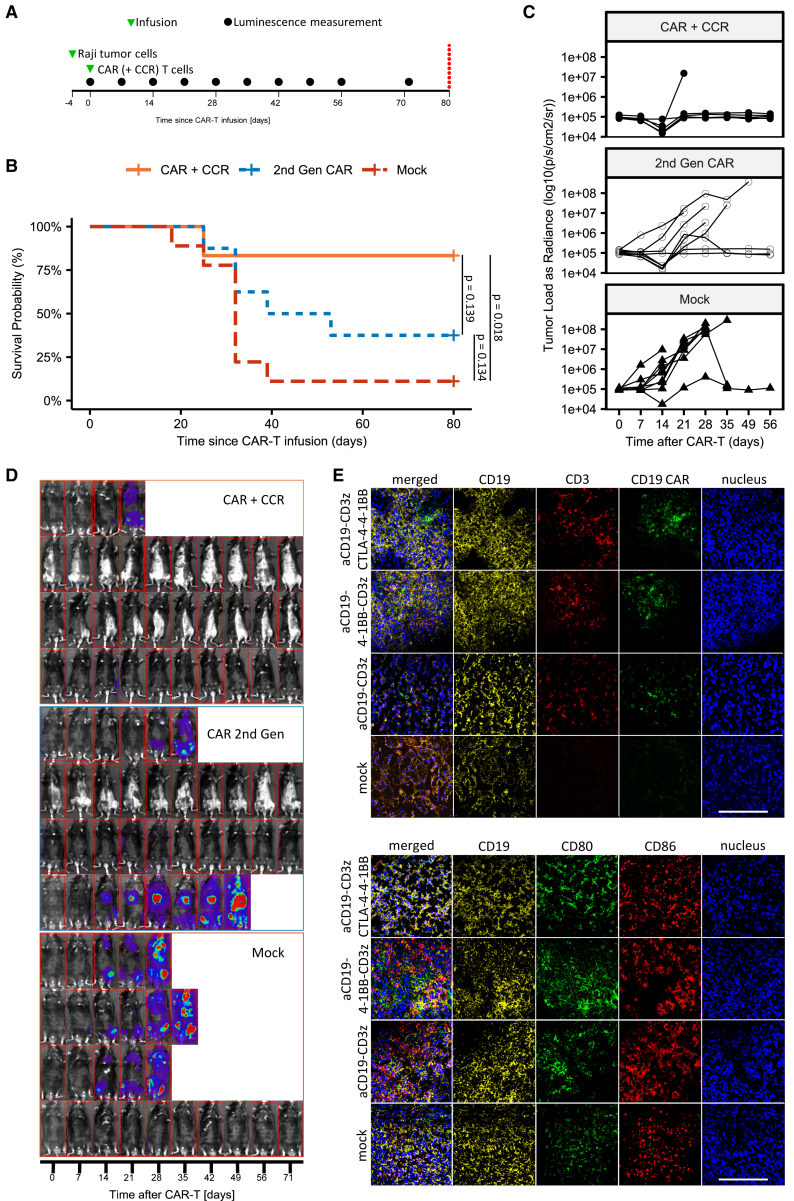
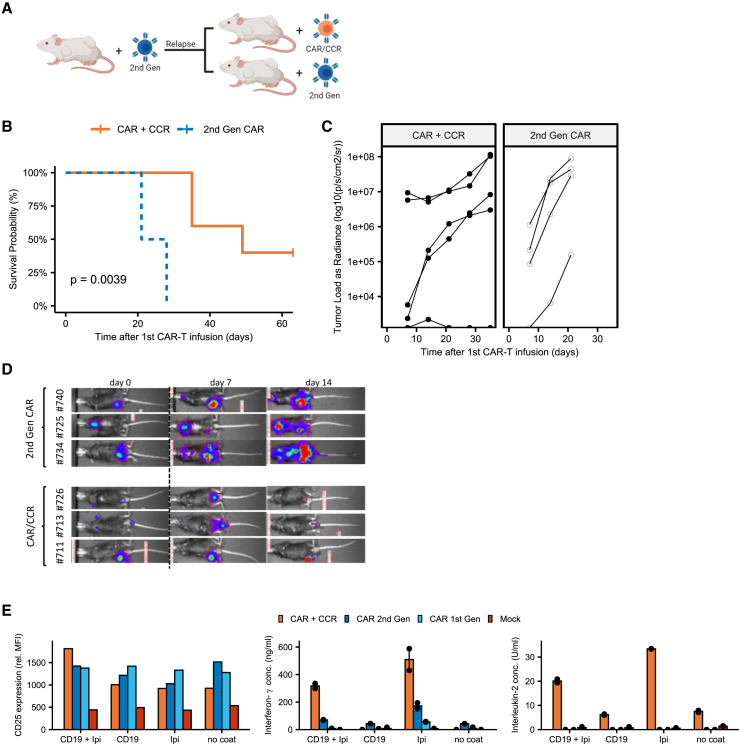
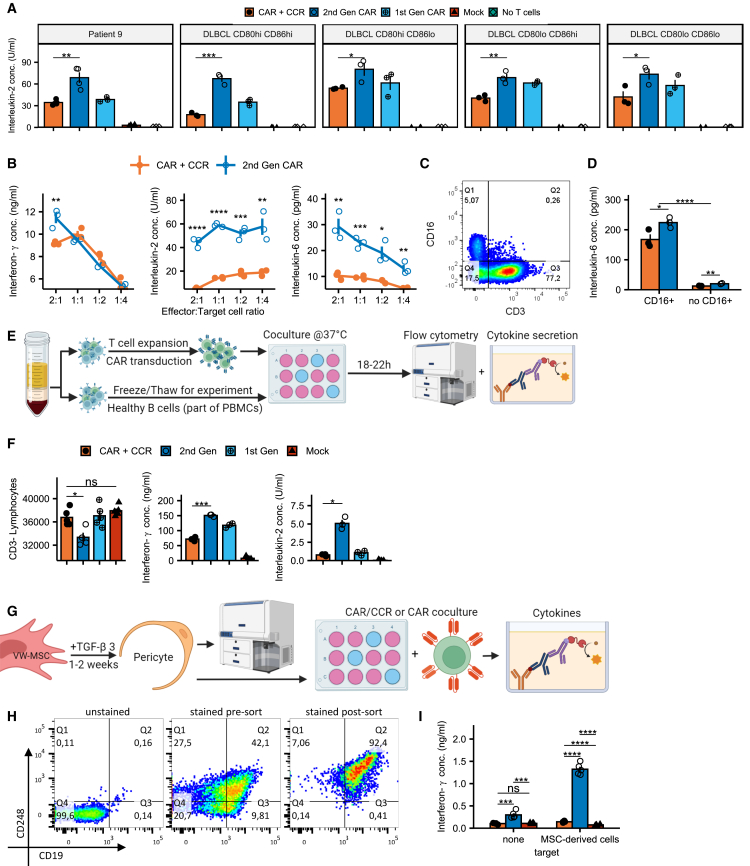
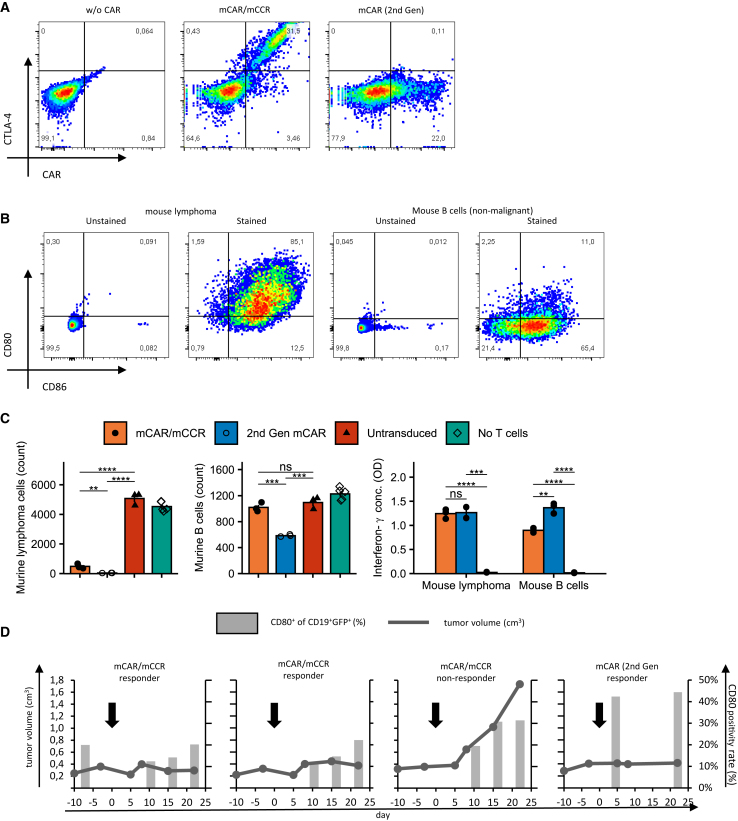
Chimeric antigen receptor T cell (CAR T) therapy is a potent treatment for relapsed/refractory (r/r) B cell lymphomas but provides lasting remissions in only ∼40% of patients and is associated with serious adverse events. We identify an upregulation of CD80 and/or CD86 in tumor tissue of (r/r) diffuse large B cell lymphoma (DLBCL) patients treated with tisagenlecleucel. This finding leads to the development of the CAR/CCR (chimeric checkpoint receptor) design, which consists of a CD19-specific first-generation CAR co-expressed with a recombinant CTLA-4-linked receptor with a 4-1BB co-stimulatory domain. CAR/CCR T cells demonstrate superior efficacy in xenograft mouse models compared with CAR T cells, superior long-term activity, and superior selectivity in in vitro assays with non-malignant CD19+ cells. In addition, immunocompetent mice show an intact CD80-CD19+ B cell population after CAR/CCR T cell treatment. The results reveal the CAR/CCR design as a promising strategy for further translational study.
Keywords: CAR T cells; CD19; CD80; CD86; DLBCL; FL; checkpoint ligand; chimeric checkpoint receptor; lymphoma; neurotoxicity.
Copyright © 2024 The Author(s). Published by Elsevier Inc. All rights reserved.
Conflict of interest statement
Declaration of interests The authors declare no competing interests.
Figures
Similar articles
-
Chimeric antigen receptor (CAR) T-cell therapy for people with relapsed or refractory diffuse large B-cell lymphoma.Cochrane Database Syst Rev. 2021 Sep 13;9(9):CD013365. doi: 10.1002/14651858.CD013365.pub2. Cochrane Database Syst Rev. 2021. PMID: 34515338 Free PMC article.
-
CD22-directed CAR T-cell therapy for large B-cell lymphomas progressing after CD19-directed CAR T-cell therapy: a dose-finding phase 1 study.Lancet. 2024 Jul 27;404(10450):353-363. doi: 10.1016/S0140-6736(24)00746-3. Epub 2024 Jul 9. Lancet. 2024. PMID: 38996463 Free PMC article. Clinical Trial.
-
Decoding the immune microenvironment of secondary chronic myelomonocytic leukemia due to diffuse large B-cell lymphoma with CD19 CAR-T failure by single-cell RNA-sequencing.Chin Med J (Engl). 2025 Aug 5;138(15):1866-1881. doi: 10.1097/CM9.0000000000003690. Epub 2025 Jul 7. Chin Med J (Engl). 2025. PMID: 40625291 Free PMC article.
-
Sequential CD19-20 CAR T-cell therapy for refractory/relapsed diffuse large B-cell lymphoma.Cytotherapy. 2025 Aug;27(8):910-916. doi: 10.1016/j.jcyt.2025.04.063. Epub 2025 Apr 17. Cytotherapy. 2025. PMID: 40340294
-
Anti-CD19 chimeric antigen receptor-modified T cells for B-cell malignancies: a systematic review of efficacy and safety in clinical trials.Eur J Haematol. 2016 Apr;96(4):389-96. doi: 10.1111/ejh.12602. Epub 2015 Jul 3. Eur J Haematol. 2016. PMID: 26115358
Cited by
-
Reshaping the tumor immune microenvironment to improve CAR-T cell-based cancer immunotherapy.Mol Cancer. 2024 Aug 26;23(1):175. doi: 10.1186/s12943-024-02079-8. Mol Cancer. 2024. PMID: 39187850 Free PMC article. Review.
-
Analysis of single-cell and spatial transcriptomics in TNBC cell-cell interactions.Front Immunol. 2025 Feb 26;16:1521388. doi: 10.3389/fimmu.2025.1521388. eCollection 2025. Front Immunol. 2025. PMID: 40079015 Free PMC article. Review.
-
Immune evasion in cancer: mechanisms and cutting-edge therapeutic approaches.Signal Transduct Target Ther. 2025 Jul 31;10(1):227. doi: 10.1038/s41392-025-02280-1. Signal Transduct Target Ther. 2025. PMID: 40739089 Free PMC article. Review.
-
Development and characterization of a low-affinity humanized CD19 chimeric antigen receptor for B-cell malignancies.Blood Neoplasia. 2024 Oct 13;1(4):100048. doi: 10.1016/j.bneo.2024.100048. eCollection 2024 Dec. Blood Neoplasia. 2024. PMID: 40552142 Free PMC article.
-
A Proteomics Outlook on the Molecular Effectors of CAR-T Cell Therapy in Cancer Management.J Proteome Res. 2025 Jun 6;24(6):2571-2583. doi: 10.1021/acs.jproteome.4c00930. Epub 2025 Mar 6. J Proteome Res. 2025. PMID: 40047620 Free PMC article. Review.
References
-
- Bachy E., Le Gouill S., Di Blasi R., Sesques P., Manson G., Cartron G., Beauvais D., Roulin L., Gros F.X., Rubio M.T., et al. A real-world comparison of tisagenlecleucel and axicabtagene ciloleucel CAR T cells in relapsed or refractory diffuse large B cell lymphoma. Nat. Med. 2022;1:10. doi: 10.1038/s41591-022-01969-y. - DOI - PMC - PubMed
-
- Schuster S.J., Tam C.S., Borchmann P., Worel N., McGuirk J.P., Holte H., Waller E.K., Jaglowski S., Bishop M.R., Damon L.E., et al. Long-term clinical outcomes of tisagenlecleucel in patients with relapsed or refractory aggressive B-cell lymphomas (JULIET): a multicentre, open-label, single-arm, phase 2 study. Lancet Oncol. 2021;22:1403–1415. doi: 10.1016/S1470-2045(21)00375-2. - DOI - PubMed
-
- Neelapu S.S., Jacobson C.A., Ghobadi A., Miklos D.B., Lekakis L.J., Oluwole O.O., Lin Y., Braunschweig I., Hill B.T., Timmerman J.M., et al. 5-Year Follow-Up Supports Curative Potential of Axicabtagene Ciloleucel in Refractory Large B-Cell Lymphoma (ZUMA-1) Blood. 2023;141:2307–2315. doi: 10.1182/blood.2022018893. - DOI - PMC - PubMed
-
- Abramson J.S., Palomba M.L., Gordon L.I., Lunning M.A., Wang M., Arnason J., Mehta A., Purev E., Maloney D.G., Andreadis C., et al. Lisocabtagene maraleucel for patients with relapsed or refractory large B-cell lymphomas (TRANSCEND NHL 001): a multicentre seamless design study. Lancet. 2020;396:839–852. doi: 10.1016/S0140-6736(20)31366-0. - DOI - PubMed
Publication types
MeSH terms
Substances
LinkOut - more resources
Full Text Sources
Research Materials
