. 2024;17(6):923-937.
doi: 10.1016/j.jcmgh.2024.01.025. Epub 2024 Feb 9.

Lysyl Oxidase Regulates Epithelial Differentiation and Barrier Integrity in Eosinophilic Esophagitis

Affiliations

Lysyl Oxidase Regulates Epithelial Differentiation and Barrier Integrity in Eosinophilic Esophagitis

Masaru Sasaki et al. Cell Mol Gastroenterol Hepatol. 2024.

Abstract

Background & aims: Epithelial disruption in eosinophilic esophagitis (EoE) encompasses both impaired differentiation and diminished barrier integrity. We have shown that lysyl oxidase (LOX), a collagen cross-linking enzyme, is up-regulated in the esophageal epithelium in EoE. However, the functional roles of LOX in the esophageal epithelium remains unknown.

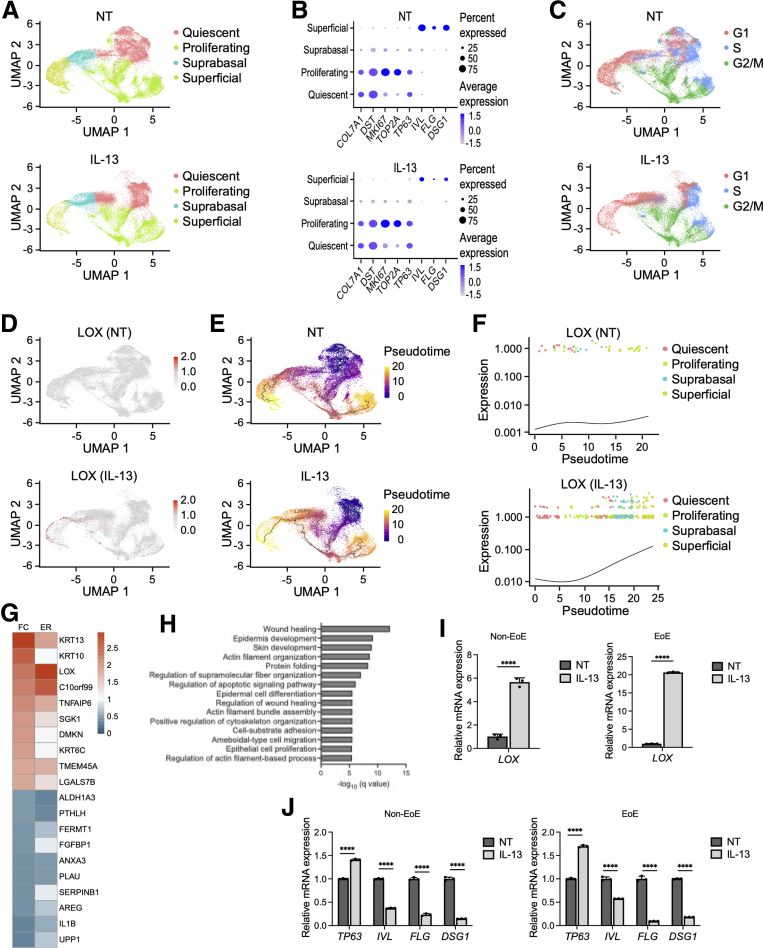
Methods: We investigated roles for LOX in the human esophageal epithelium using 3-dimensional organoid and air-liquid interface cultures stimulated with interleukin (IL)13 to recapitulate the EoE inflammatory milieu, followed by single-cell RNA sequencing, quantitative reverse-transcription polymerase chain reaction, Western blot, histology, and functional analyses of barrier integrity.

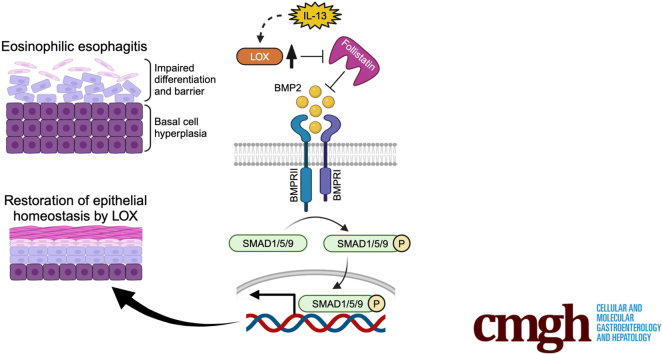
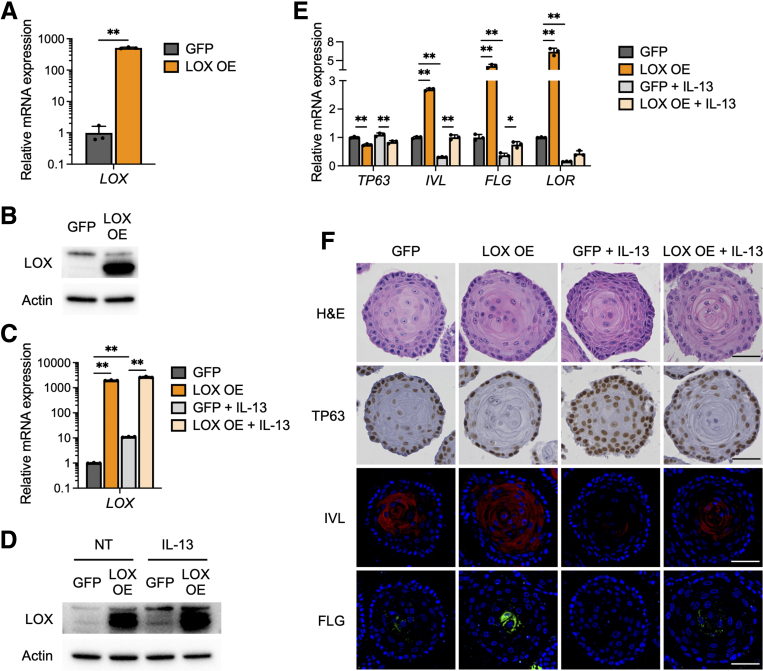
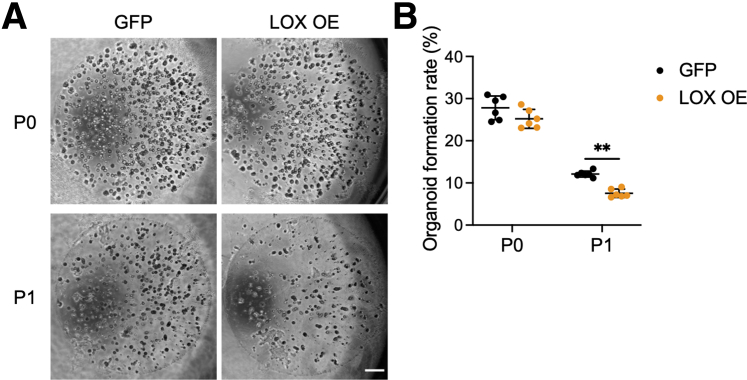
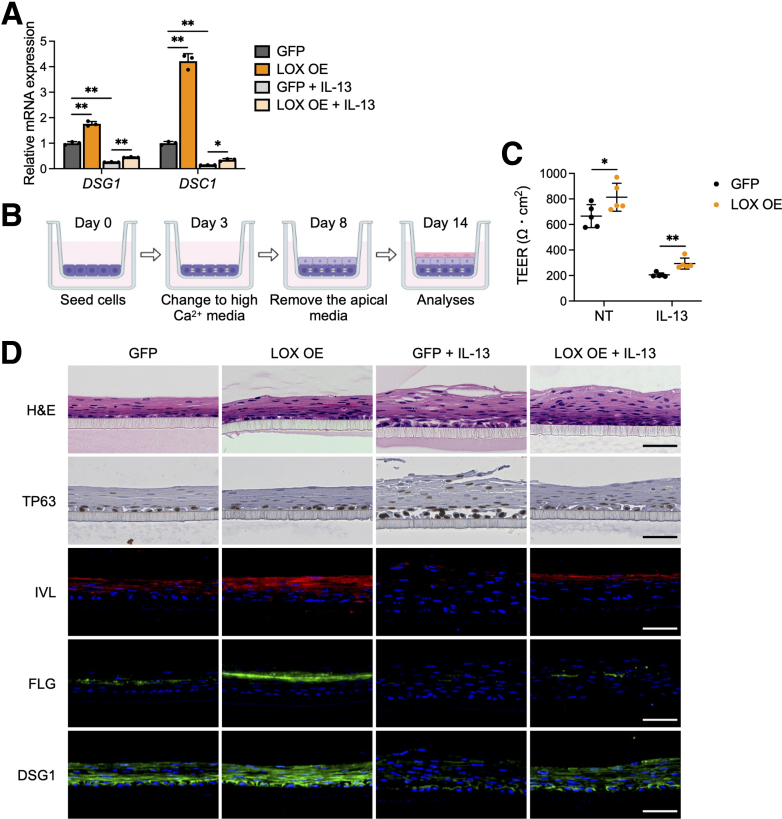
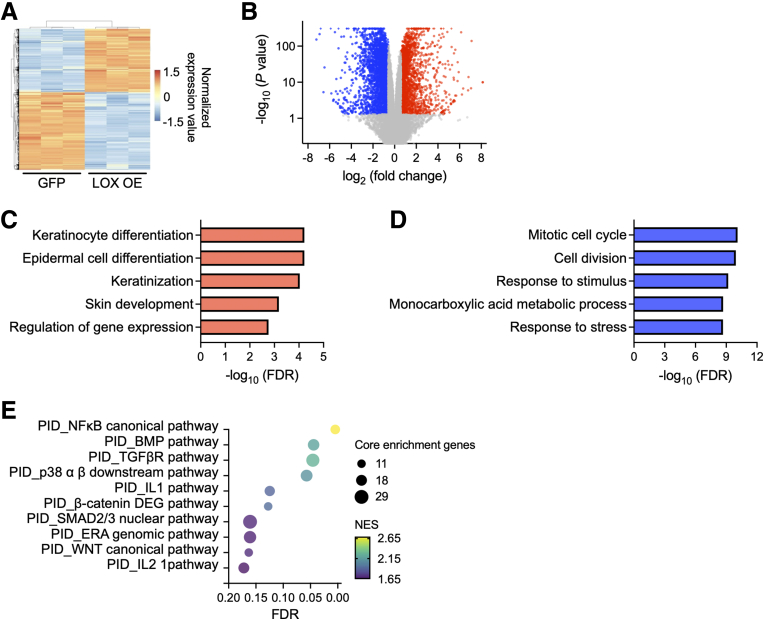
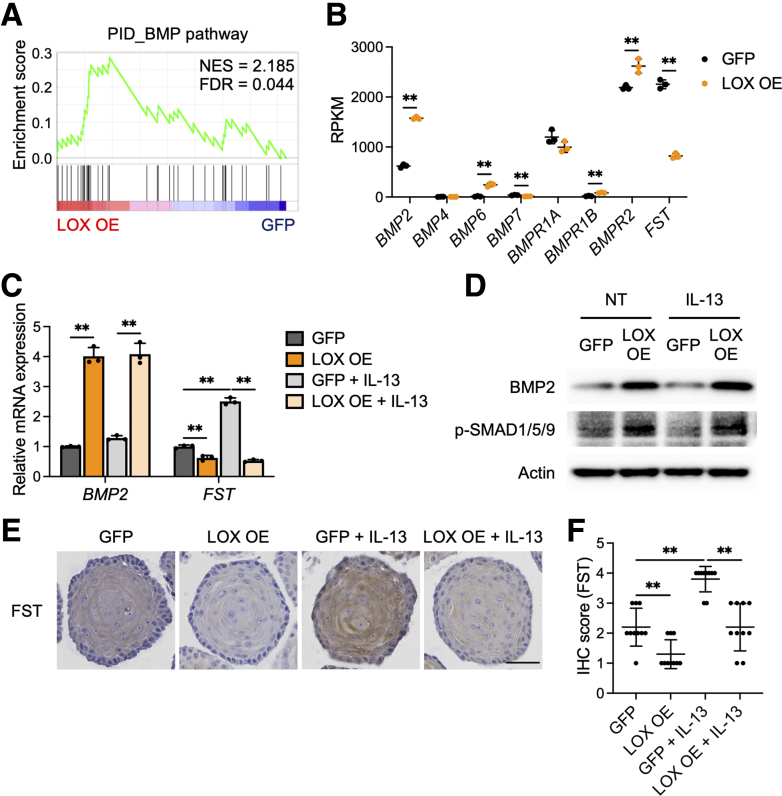
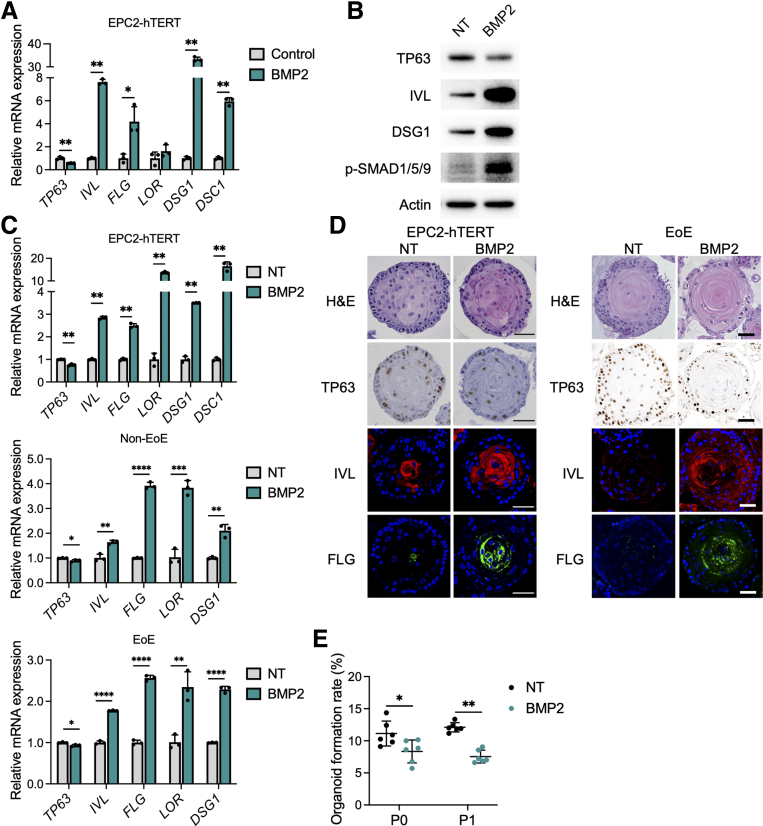
Results: Single-cell RNA sequencing analysis on patient-derived organoids revealed that LOX was induced by IL13 in differentiated cells. LOX-overexpressing organoids showed suppressed basal and up-regulated differentiation markers. In addition, LOX overexpression enhanced junctional protein genes and transepithelial electrical resistance. LOX overexpression restored the impaired differentiation and barrier function, including in the setting of IL13 stimulation. Transcriptome analyses on LOX-overexpressing organoids identified an enriched bone morphogenetic protein (BMP) signaling pathway compared with wild-type organoids. In particular, LOX overexpression increased BMP2 and decreased the BMP antagonist follistatin. Finally, we found that BMP2 treatment restored the balance of basal and differentiated cells.

Conclusions: Our data support a model whereby LOX exhibits noncanonical roles as a signaling molecule important for epithelial homeostasis in the setting of inflammation via activation of the BMP pathway in the esophagus. The LOX/BMP axis may be integral in esophageal epithelial differentiation and a promising target for future therapies.

Keywords: BMP; Eosinophilic Esophagitis; Lysyl Oxidase; Organoid.


Figures

None
Graphical abstract
Figure 1
Figure 1
scRNA-seq from PDOs reveals specific distribution of LOX in esophageal epithelium. (A–H) scRNA-seq analyses based on PDOs from 3 non-EoE patients. PDOs were cultured with or without IL13 (10 μg/mL) from days 7 to 11 and then harvested on day 11. (A) UMAP plots displaying 4 distinct cell types (quiescent basal, proliferating basal, suprabasal, and superficial) in nontreated (NT) and IL13-stimulated PDOs. (B) Dot plots showing the expression of COL7A1, DST, MKI67, TOP2A, TP63, IVL, FLG, and DSG1 in NT and IL13-stimulated PDOs. (C) UMAP plots showing cell-cycle phases in NT and IL13-stimulated PDOs. (D) UMAP plots showing the expression of LOX in NT and IL13-stimulated PDOs. (E) Inferred cell fate trajectories in NT and IL13-stimulated PDOs. Cells are colored by pseudotime value. Dark purple and bright yellow imply the earliest cells and the latest cells, respectively. (F) Expression kinetics for LOX across the pseudotime axis in NT and IL13-stimulated PDOs. (G) Heatmap representation of fold change (FC) and expression ratio (ER) of the average expression across all cells of the top 10 differentially expressed genes in LOX-expressing cells (LOX+) compared with LOX nonexpressing (LOX-) cells in the superficial cluster of IL13-stimulated PDOs. (H) Gene Ontology analysis of DEG profiles of LOX+ cells compared with LOX- cells in the superficial cluster of IL13-stimulated PDOs. (I) Relative expression, via qRT-PCR, of LOX gene in EoE or non-EoE PDOs, cultured with or without IL13 (representative results are shown, total n = 2/2 EoE/non-EoE lines). (J) Relative expression, via qRT-PCR, of TP63, IVL, FLG, and DSG1 genes in EoE or non-EoE PDOs, cultured with or without IL13 (representative results are shown, total n = 2/1 EoE/non-EoE lines).. ∗∗∗∗P < .0001
Figure 2
Figure 2
LOX overexpression promotes cell differentiation in esophageal epithelium. (A) qRT-PCR for LOX of monolayer-cultured EPC2-hTERT cells overexpressing GFP or LOX OE (n = 3). (B) Representative immunoblot for LOX of the monolayer-cultured GFP and LOX OE cells. (C–E) IL13 treatment induces aberrant LOX expression in EPC2-hTERT organoids. GFP and LOX OE organoids were cultured with or without IL13 (10 μg/mL) from days 7 to 11 and then harvested on day 11. (C) qRT-PCR and (D) immunoblot for LOX in GFP and LOX OE cells, monolayer-cultured with or without IL13. (E) qRT-PCR for SOX2, KRT14, TP63, IVL, FLG, and LOR of the GFP and LOX OE organoids (n = 3). (F) Representative images of H&E staining, immunohistochemistry for TP63, and immunofluorescence staining for IVL (red), FLG (green), and 4′,6-diamidino-2-phenylindole (blue), in the GFP and LOX OE organoids. Scale bar: 50 μm. Data are representative of 3 independent experiments and expressed as means ± SDs. (A) A 2-tailed Student t test and (C and E) 1-way analysis of variance were performed for statistical analyses. ∗P < .05, ∗∗P < .01.
Figure 3
Figure 3
LOX overexpression attenuates organoid formation capacity. (A) Representative phase contrast images of EPC2-hTERT organoids overexpressing GFP or LOX OE on day 11. The OFR was assessed on day 11 (P0), followed by passage. OFR was assessed again on day 11 (P1). Scale bar: 50 μm. (B) OFR was calculated as the number of organoids (≥50 μm) divided by the number of total seeded cells. Data are representative of 3 independent experiments and expressed as means ± SDs (n = 6). A 2-tailed Student t test was performed for statistical analyses. ∗∗P < .01.
Figure 4
Figure 4
LOX overexpression improves epithelial barrier integrity. (A) qRT-PCR for DSG1 and DSC1 in EPC2-hTERT organoids overexpressing GFP or LOX OE. GFP and LOX OE organoids were cultured with or without IL13 (10 μg/mL) from days 7 to 11 and then harvested on day 11 (n = 3). Data are representative of 3 independent experiments. (B) Schematic of ALI model. GFP and LOX OE EPC2-hTERT cells were cultured in low-calcium (0.09 mmol/L Ca2+) media for 3 days, followed by high-calcium media (1.8 mmol/L Ca2+) for 5 days, and then brought to ALI on day 8. ALI-cultured cells were stimulated with IL13 (10 μg/mL) from days 9 to 14. (C) TEER (Ω ∗ cm2) of the GFP and LOX OE EPC2-hTERT ALI cultures (n = 5). (D) Representative images of H&E staining, immunohistochemistry for TP63, and immunofluorescence staining for IVL (red), FLG (green), and DSG1 (green) of the GFP and LOX OE EPC2-hTERT ALI cultures. 4′,6-diamidino-2-phenylindole (DAPI) (blue). Scale bar: 50 μm. Data are representative of 2 independent experiments and expressed as means ± SDs. (A) One-way analysis of variance and (C) 2-tailed Student t test were performed for statistical analyses. ∗P < .05, ∗∗P < .01. NT, nontreated.
Figure 5
Figure 5
Transcriptome analysis identifies the functional roles of LOX in esophageal epithelium. (A) Heatmap and (B) volcano plot of DEGs based on RNA sequencing data from GFP or LOX OE EPC2-hTERT organoids. Up-regulated and down-regulated DEGs in LOX OE organoids are shown with red and blue, respectively. Top 5 (C) enriched and (D) depleted terms in LOX OE organoids based on Gene Ontology analysis. (E) Gene Set Enrichment Analysis based on the PID. The top 10 enriched pathways in LOX OE organoids are shown. Dot size and color represent the number of core enrichment genes and normalized enrichment score (NES) for the pathway, respectively. FDR, false discovery rate.
Figure 6
Figure 6
BMP signaling pathway is activated in LOX overexpressing organoids. (A) Gene Set Enrichment Analysis for BMP pathway in the PID based on the differentially expressed genes in LOX OE organoids. (B) Normalized expression of genes relevant to the BMP pathway gene set, plotted as reads per kilobase per million (RPKM) (n = 3). (C–F) Validation of the BMP pathway activation in EPC2-hTERT organoids. GFP and LOX OE organoids were cultured with or without IL13 (10 μg/mL) from days 7 to 11 and then harvested on day 11. (C) qRT-PCR for BMP2 and FST in the GFP and LOX OE organoids (n = 3). (D) Representative immunoblot for BMP2 and phosphorylated SMAD1/5/9 (p-SMAD1/5/9) and (E) immunohistochemistry staining for FST in the GFP and LOX OE organoids. Scale bar: 50 μm. (F) FST protein levels in panel E, quantified (n = 10). Data are representative of 3 independent experiments and expressed as means ± SDs. (B) Two-tailed Student t test and (C and F) 1-way analysis of variance were performed for statistical analyses. ∗∗P < .01. FDR, false discovery rate; IHC, immunohistochemistry; NES, normalized enrichment score; NT, nontreated.
Figure 7
Figure 7
BMP2 treatment induces cell differentiation in esophageal epithelium. (A and B) BMP2 treatment in monolayer culture of EPC2-hTERT cells. EPC2-hTERT cells were treated with recombinant BMP2 protein (10 μg/mL) for 72 hours in high-calcium (1.8 mmol/L Ca2+) media. (A) qRT-PCR for TP63, IVL, FLG, LOR, DSG1, and DSC1 in the EPC2-hTERT cells (n = 3). (B) Representative immunoblot for TP63, IVL, DSG1, and phosphorylated SMAD1/5/9 (p-SMAD1/5/9) in the EPC2-hTERT cells. (C–E) EPC2-hTERT organoids were treated with recombinant BMP2 protein (10 μg/mL) from days 7 to 11 and then harvested on day 11. (C) qRT-PCR for SOX2, KRT14, TP63, IVL, FLG, LOR, DSG1, and DSC1 in the EPC2-hTERT organoids or PDOs (representative from 5 PDOs: 2 EoE and 3 non-EoE cultures). (D) Representative images of H&E staining, immunohistochemistry for TP63, and immunofluorescence staining for IVL (red), FLG (green), and 4′,6-diamidino-2-phenylindole (blue), in the EPC2-hTERT organoids or PDOs. Scale bar: 50 μm. (E) OFR was assessed on day 11 (P0), followed by passage. OFR was assessed again on day 11 (P1). OFR was calculated as the number of organoids (≥50 μm) divided by the number of total seeded cells (n = 6). Data are representative of 3 independent experiments and expressed as means ± SDs. (A, C, and E) Two-tailed Student t test was performed for statistical analyses. ∗P < .05, ∗∗P < .01, ∗∗∗P < .001, ∗∗∗∗P < .0001. NT, nontreated.

Update of

References

    1. Muir A., Falk G.W. Eosinophilic esophagitis: a review. JAMA. 2021;326:1310–1318. - PMC - PubMed
    1. Whelan K.A., Godwin B.C., Wilkins B., et al. Persistent basal cell hyperplasia is associated with clinical and endoscopic findings in patients with histologically inactive eosinophilic esophagitis. Clin Gastroenterol Hepatol. 2020;18:1475–1482.e1. - PMC - PubMed
    1. Rochman M., Wen T., Kotliar M., et al. Single-cell RNA-seq of human esophageal epithelium in homeostasis and allergic inflammation. JCI Insight. 2022;7 - PMC - PubMed
    1. Kasagi Y., Dods K., Wang J.X., et al. Fibrostenotic eosinophilic esophagitis might reflect epithelial lysyl oxidase induction by fibroblast-derived TNF-α. J Allergy Clin Immunol. 2019;144:171–182. - PMC - PubMed
    1. Chen W., Yang A., Jia J., et al. Lysyl oxidase (LOX) family members: rationale and their potential as therapeutic targets for liver fibrosis. Nat Rev Gastroenterol Hepatol. 2020;72:729–741. - PubMed

MeSH terms