. 2024 Mar 8;9(5):e172942.
doi: 10.1172/jci.insight.172942.

Tregs from human blood differentiate into nonlymphoid tissue-resident effector cells upon TNFR2 costimulation

Affiliations

Tregs from human blood differentiate into nonlymphoid tissue-resident effector cells upon TNFR2 costimulation

Mark Mensink et al. JCI Insight. .

Abstract

Tregs can facilitate transplant tolerance and attenuate autoimmune and inflammatory diseases. Therefore, it is clinically relevant to stimulate Treg expansion and function in vivo and to create therapeutic Treg products in vitro. We report that TNF receptor 2 (TNFR2) is a unique costimulus for naive, thymus-derived Tregs (tTregs) from human blood that promotes their differentiation into nonlymphoid tissue-resident (NLT-resident) effector Tregs, without Th-like polarization. In contrast, CD28 costimulation maintains a lymphoid tissue-resident (LT-resident) Treg phenotype. We base this conclusion on transcriptome and proteome analysis of TNFR2- and CD28-costimulated CD4+ tTregs and conventional T cells (Tconvs), followed by bioinformatic comparison with published transcriptomic Treg signatures from NLT and LT in health and disease, including autoimmunity and cancer. These analyses illuminate that TNFR2 costimulation promoted tTreg capacity for survival, migration, immunosuppression, and tissue regeneration. Functional studies confirmed improved migratory ability of TNFR2-costimulated tTregs. Flow cytometry validated the presence of the TNFR2-driven tTreg signature in effector/memory Tregs from the human placenta, as opposed to blood. Thus, TNFR2 can be exploited as a driver of NLT-resident tTreg differentiation for adoptive cell therapy or antibody-based immunomodulation in human disease.

Keywords: Bioinformatics; Costimulation; Immunology; T cells.


Conflict of interest statement

Conflict of interest: The authors have declared that no conflict of interest exists.

Figures

Figure 1
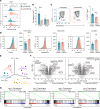
Figure 1. CD28 and TNFR2 costimulation differentially affect naive Tconvs and Tregs.
Naive Tconvs and Tregs were purified from human peripheral blood and stimulated as indicated in Supplemental Figure 1. (A) Cell division assessed by CellTrace Violet (CTV) dilution in naive Tconvs and Tregs stimulated as indicated for 4 days (representative of n = 3). (B) Expansion of CD28- or TNFR2-costimulated Tconvs and Tregs, calculated by the ratio of live cell number on day 7 versus start of culture. Color legend as in A. Statistical analysis by 2-way ANOVA with Bonferroni’s post hoc test (n = 9). (C) Purity assessment of Treg cultures on day 7 by FOXP3 and Helios/IKZF2 expression, with representative plots (left) and FOXP3Helios cell frequencies (right). Statistical analysis by paired 2-tailed Student’s t test (n = 15). (D) Flow cytometric analysis of FOXP3 (n = 18), Helios/IKZF2 (n = 18), and Eos/IKZF4 (n = 7) in tTregs on day 7. Representative plots and quantified protein expression by mean fluorescence intensity (MFI) are shown. Color legend as in A. Statistical analysis by paired 2-tailed Student’s t test. (AD) Data are presented as mean ± SEM. Size (n) represents individual donors, analyzed in independent experiments. ***P < 0.001, ****P < 0.0001. (E) PCA of transcriptomics data from Tconvs and tTregs analyzed on day 7 (n = 5). (F) Volcano plots of transcriptomics data comparing CD28- or TNFR2-costimulated tTregs and Tconvs. Selected differentially expressed genes (FDR < 0.05) characteristic of Tconvs or Tregs are annotated. (G) GSEA evaluating the expression of signature genes of human Treg or Tconvs according to Ferraro et al. (27) in our transcriptomics data sets of CD28- or TNFR2-costimulated tTreg and Tconvs. Normalized enrichment scores (NES) are shown (FDR < 0.05).
Figure 2
Figure 2. TNFR2 costimulation specifically upregulates cell surface expression of proteins involved in cell survival and suppressive functions on tTregs.
(A and B) Naive tTregs were activated with anti-CD3 mAb and costimulated with agonistic mAb to either CD28 or TNFR2 for 7 days and analyzed by flow cytometry. Representative plots and quantified protein expression are shown for OX40, FAS, 4-1BB, GITR (all n = 7) (A), and HLA-DR (n = 11) (B). Data are quantified as MFI, geometric MFI (gMFI), or percentage of positive expression as indicated by gates. MFI within the positive fraction is shown for HLA-DR. (C) Heatmap based on the transcriptomics data outlined in Figure 1 showing selected genes involved in (potential) suppressive mechanisms described for Tregs. Z scores are color coded. (D) Cell surface expression of TIGIT (n = 7), PD-L2 (n = 7), and LRRC32 (GARP) (n = 5) and total expression of CTLA-4 in permeabilized cells (n = 14) as determined by flow cytometry after stimulation of tTregs as indicated for A and B. (E) Cell surface expression of CD39 (ENTPD1), CD73 (NT5E), and CD26 (DPP4) analyzed after stimulation of tTregs as indicated for A and B. CD39 data are quantified by depicting the percentage of positive expression as indicated by gates, as well as the MFI within the positive fraction (n = 14). CD26 data are quantified as MFI (n = 5). (A, B, D, and E) Statistical analysis was done by paired 2-tailed Student’s t test. Data are presented as mean ± SEM. Sample size (n) represents individual donors, analyzed in independent experiments. *P < 0.05, **P < 0.01, ***P < 0.001, ****P < 0.0001.
Figure 3
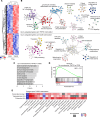
Figure 3. CD28 and TNFR2 costimulation differentially affect biological processes in tTregs.
(A) Heatmap showing 1,229 genes differentially expressed between TNFR2- and CD28-costimulated tTregs, based on transcriptome analysis outlined in Figure 1 (FDR < 0.05). (B) Overrepresentation network classifying differentially expressed genes into functional categories (enrichment factor > 1.5, P < 0.01). Nodes represent biological process terms from GO or Reactome. Highly connected terms were grouped, colored, and annotated manually by a shared term. (C) Upregulated cellular functions in TNFR2- versus CD28-costimulated tTregs according to IPA of the same transcriptomics data (FDR < 0.05). (D) GSEA using proteins upregulated according to proteome analysis in preexpanded tTregs after 24 hours of restimulation by anti-CD3 mAb and TNFR2 versus CD28 costimulation (P < 0.05, 1.25-fold change). Enrichment is shown in the transcriptome of tTregs costimulated via TNFR2 for 7 days (FDR < 0.05). (E) Heatmap showing similar changes in cellular processes across multiple omics analyses according to IPA. Comparative analysis includes transcriptomics data outlined in A (Transcriptomics day 7, αCD3/TNFR2 versus αCD3/CD28; FDR < 0.05), published transcriptomics data from preexpanded tTregs restimulated for 24 hours (Transcriptomics 24 hours, αCD3/TNFR2 versus αCD3; FDR < 0.05) (22, 23), and proteomic data from restimulated tTregs (Proteomics 24 hours, αCD3/TNFR2 versus αCD3/CD28; P < 0.05, 1.1-fold change). Z scores are color coded.
Figure 4
Figure 4. TNFR2 costimulation upregulates the migratory capacity of tTregs.
(A) Differentially expressed genes associated with lymphocyte migration and/or adhesion, identified by IPA as upregulated in TNFR2- versus CD28-costimulated tTregs. Log2 fold changes are color coded. (B) Light microscopy images of differentially costimulated tTreg cultures on day 7. Scale bar: 500 μm. (CF) Flow cytometric analysis of differentially costimulated tTregs on day 7 of culture. Representative plots and quantification are shown for ICAM-1 (n = 7) (C), LAYN (n = 3) (D), CCR8 (n = 7) (E), and CXCR4 (n = 5) (F). Data are quantified as MFI, gMFI, or percentage positive. Statistical analysis by paired 2-tailed Student’s t test. (G) Left: Schematic depiction of migration assay using Transwell inserts with 5 μm pore size to assess tTreg migration on day 7. Right: Light microscopy images at 16 hours, showing differentially costimulated tTregs in the bottom chamber containing CCL1. Scale bar: 20 μm. (H) Frequency of migrated cells after the 16-hour assay described in G. Statistical analysis by 2-way repeated-measures ANOVA with Tukey’s post hoc test was done on indicated groups (n = 6), without incorporating CXCL12 data (n = 5). (CF and H) Data are presented as mean ± SEM. Group size (n) represents individual donors, analyzed in independent experiments. *P < 0.05, **P < 0.01, ***P < 0.001. (I) Migration assay using an Incucyte Clearview 96-well plate, showing images of TNFR2-costimulated tTregs cultured in the presence of CCL1 at 0 and 24 hours. Detected cells and pores are indicated in yellow and light green, respectively. Scale bar: 400 μm. (J) Migration as quantified by the area occupied by tTregs on the insert, normalized to 0 h (representative of n = 2).
Figure 5
Figure 5. Costimulated tTregs acquire an effector Treg profile without Th-like polarization.
(A) Scheme depicting naive CD4+ Tconv effector differentiation into Tfh, Th1, Th17, and Th2 lineages, with defining transciption factors, chemokine receptors, and cytokines. (B) Representative plots showing gating strategy to identify CD25hiCD127lo Tregs among CD4+ T cells from PBMCs (left) and gating strategy to identify CD45RA+RO naive tTregs among total Tregs from PBMCs (right). (C) Left: Intracellular FOXP3/Helios expression (left) and cell surface naive/memory marker expression (right) for naive tTregs (black) and CD28-costimulated (blue) and TNFR2-costimulated (red) tTregs. (D) Top: Representative plots showing expression of Th lineage–associated markers (A) on naive, CD28-costimulated, or TNFR2-costimulated tTregs. Bottom: Positive controls showing expression of the analyzed markers on indicated cell populations, as measured directly ex vivo. (E) Representative assessment of the capacity of CD28- or TNFR2-costimulated tTregs to produce Th lineage–associated cytokines after PMA/ionomycin-based restimulation (top), with positive staining controls as indicated (bottom). (BE) Data are representative of n = 5.
Figure 6
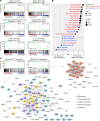
Figure 6. Enrichment of healthy NLT Treg gene signatures in TNFR2-costimulated tTregs.
(A) GSEA plots showing enrichment of indicated published Treg gene signatures from healthy tissues and peripheral blood (, –49) in the transcriptomes of tTregs costimulated via TNFR2 or CD28 for 7 days. Normalized enrichment scores (NES) are depicted (FDR < 0.05). (B) Summary of GSEA data showing enrichment of published Treg gene signatures in healthy tissues (, –49) in the transcriptome of TNFR2- or CD28-costimulated tTregs. Red and blue text mark gene sets describing, respectively, high and low expression in Tregs from indicated tissues. The first author of the corresponding reference is shown between parentheses. Additional information is described in Supplemental Table 2. VAT, visceral adipose tissue. (C) NLT-related gene sets were compared to find overlap, leading to a combined NLT Treg gene signature composed of genes that were present in at least 3 of 9 selected NLT-related gene sets (, –49). Similarly, a combined LT Treg gene signature consisted of genes present in at least 2 of 5 selected LT-related gene sets. The selection of gene sets is shown in Supplemental Table 2. GSEA was performed using the combined NLT and LT Treg signatures, which is displayed together with NES (FDR < 0.05). Leading edge genes are marked by dashed or dotted lines and visualized as STRING networks, including enriched biological processes according to GO/Reactome. Disconnected nodes not associated with labeled processes are not shown.
Figure 7
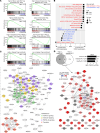
Figure 7. TNFR2-costimulated tTregs acquire characteristics of Tregs in tumors and autoimmune lesions.
(A) GSEA showing enrichment of indicated published Treg gene signatures from tumors (, –54) in the transcriptomes of tTregs costimulated via TNFR2 or CD28 for 7 days (FDR < 0.05). (B) GSEA summary showing enrichment of published Treg gene signatures from tumors and autoimmune lesions (, , –60) in the transcriptome of TNFR2- or CD28-costimulated tTregs. Gene sets describing high or low expression in Tregs from indicated tissues are marked in red or blue, respectively. The first author of the corresponding reference is shown. Additional information is described in Supplemental Table 2. HCC, hepatocellular carcinoma; ICC, intrahepatic cholangiocarcinoma; SF, synovial fluid. (C) Gene sets comprising either high or low expression in Tregs in diseased NLT were compared to find overlap, generating 2 combined gene signatures. Selection of gene sets is shown in Supplemental Table 2. GSEA using the combined gene signatures is shown (FDR < 0.05). Leading edge genes are marked by dashed or dotted lines and visualized as STRING networks, including enriched biological processes according to GO/Reactome. STRING visualization of the TNFR2-enriched gene set was based on the top 150 genes of the leading edge. Disconnected nodes not associated with labeled processes are not shown. (D) Top left: Venn diagram showing unique and 86 overlapping highly expressed genes in Tregs in healthy (Figure 6C) versus diseased NLT. Top right: GSEA showing the NES of genes of the indicated Treg gene signatures in the transcriptomes of TNFR2- versus CD28-costimulated tTregs. Bottom: Visualization of the 86-gene common signature by STRING network analysis. Log2 fold changes are color coded.
Figure 8
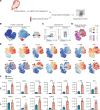
Figure 8. The TNFR2-driven tTreg phenotype is present at the protein level in human placenta.
(A) Scheme depicting isolation of lymphocytes from decidua parietalis and peripheral blood of women with term pregnancies (n = 4). All samples were simultaneously analyzed by spectral flow cytometry. (B) Opt-SNE was performed on the CD3+CD4+ T cell compartment from either tissue (n = 4). Each dot represents a single cell. Relative protein expression of FOXP3 is color coded. (C) Gating strategy to identify Tregs for comparative analysis between decidua and blood. Among CD25hiCD127lo cells, FOXP3+CD45RO+ effector Tregs were selected for further analysis. The complete gating strategy is shown in Supplemental Figure 5. (D) Opt-SNE was performed on effector Tregs from decidua and blood collectively, showing individual samples that are color coded. (E) Protein expression of indicated molecules after opt-SNE described in D. Relative expression is shown according to the color legend in B. (F) Quantification of protein expression in E as MFI, comparing decidua and blood samples (n = 4). Statistical analysis was done by paired 2-tailed Student’s t test. Data are presented as mean ± SEM. Sample size (n) represents individual donors. **P < 0.01, ***P < 0.001, ****P < 0.0001.

References

    1. Ohkura N, et al. Development and maintenance of regulatory T cells. Immunity. 2013;38(3):414–423. doi: 10.1016/j.immuni.2013.03.002. - DOI - PubMed
    1. Opstelten R, Amsen D. Separating the wheat from the chaff: Making sense of Treg heterogeneity for better adoptive cellular therapy. Immunol Lett. 2021;239:96–112. doi: 10.1016/j.imlet.2021.03.002. - DOI - PubMed
    1. Josefowicz SZ, et al. Extrathymically generated regulatory T cells control mucosal TH2 inflammation. Nature. 2012;482(7385):395–399. doi: 10.1038/nature10772. - DOI - PMC - PubMed
    1. Samstein RM, et al. Extrathymic generation of regulatory T cells in placental mammals mitigates maternal-fetal conflict. Cell. 2012;150(1):29–38. doi: 10.1016/j.cell.2012.05.031. - DOI - PMC - PubMed
    1. Liston A, Gray DH. Homeostatic control of regulatory T cell diversity. Nat Rev Immunol. 2014;14(3):154–165. doi: 10.1038/nri3605. - DOI - PubMed

Publication types

Substances