. 2024 Feb 10;10(1):70.
doi: 10.1038/s41420-023-01773-8.

1,4-dihydroxy quininib activates ferroptosis pathways in metastatic uveal melanoma and reveals a novel prognostic biomarker signature

Affiliations

1,4-dihydroxy quininib activates ferroptosis pathways in metastatic uveal melanoma and reveals a novel prognostic biomarker signature

Valentina Tonelotto et al. Cell Death Discov. .

Abstract

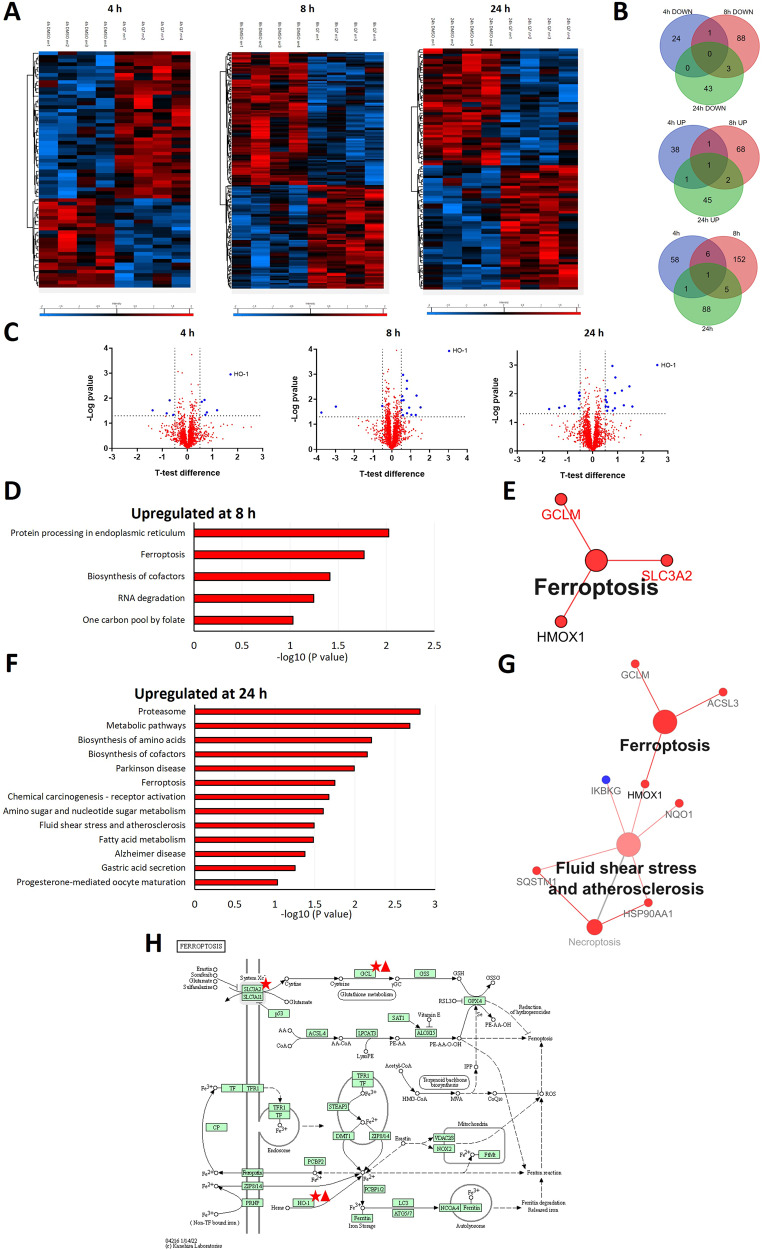
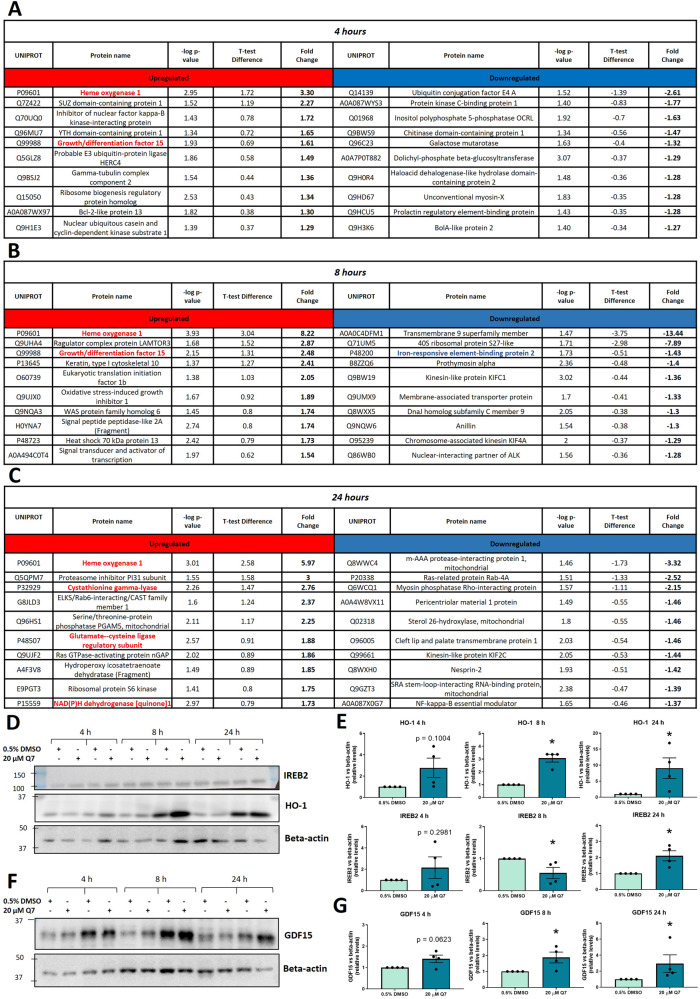
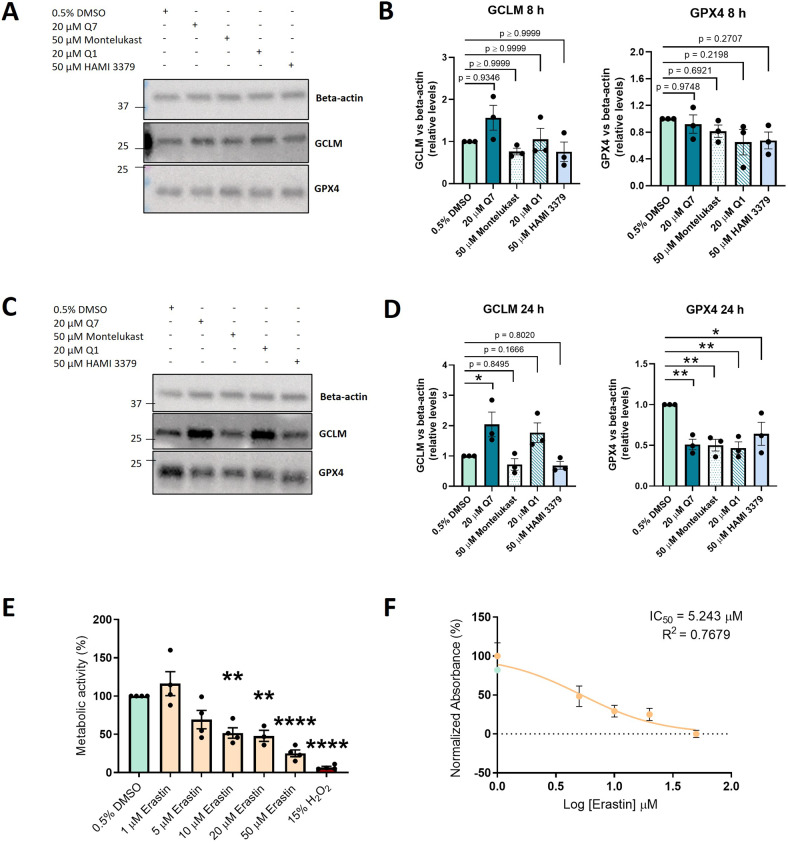
Uveal melanoma (UM) is an ocular cancer, with propensity for lethal liver metastases. When metastatic UM (MUM) occurs, as few as 8% of patients survive beyond two years. Efficacious treatments for MUM are urgently needed. 1,4-dihydroxy quininib, a cysteinyl leukotriene receptor 1 (CysLT1) antagonist, alters UM cancer hallmarks in vitro, ex vivo and in vivo. Here, we investigated the 1,4-dihydroxy quininib mechanism of action and its translational potential in MUM. Proteomic profiling of OMM2.5 cells identified proteins differentially expressed after 1,4-dihydroxy quininib treatment. Glutathione peroxidase 4 (GPX4), glutamate-cysteine ligase modifier subunit (GCLM), heme oxygenase 1 (HO-1) and 4 hydroxynonenal (4-HNE) expression were assessed by immunoblots. Biliverdin, glutathione and lipid hydroperoxide were measured biochemically. Association between the expression of a specific ferroptosis signature and UM patient survival was performed using public databases. Our data revealed that 1,4-dihydroxy quininib modulates the expression of ferroptosis markers in OMM2.5 cells. Biochemical assays validated that GPX4, biliverdin, GCLM, glutathione and lipid hydroperoxide were significantly altered. HO-1 and 4-HNE levels were significantly increased in MUM tumor explants from orthotopic patient-derived xenografts (OPDX). Expression of genes inhibiting ferroptosis is significantly increased in UM patients with chromosome 3 monosomy. We identified IFerr, a novel ferroptosis signature correlating with UM patient survival. Altogether, we demontrated that in MUM cells and tissues, 1,4-dihydroxy quininib modulates key markers that induce ferroptosis, a relatively new type of cell death driven by iron-dependent peroxidation of phospholipids. Furthermore, we showed that high expression of specific genes inhibiting ferroptosis is associated with a worse UM prognosis, thus, the IFerr signature is a potential prognosticator for which patients develop MUM. All in all, ferroptosis has potential as a clinical biomarker and therapeutic target for MUM.


Conflict of interest statement

VT, EOR, KS and BNK are named inventors on a filed patent application related to UM biomarkers. AV is co-founder of Xenopat S.L.

Figures

Fig. 1
Fig. 1. Analysis of proteome profiling uncovered ferroptosis as a biological process affected by 20 µM 1,4 dihydroxy quininib in OMM2.5 cells.
A Heatmap chart depicting all the differentially expressed proteins between 0.5% DMSO and 20 µM 1,4 dihydroxy quininib (Q7) treated OMM2.5 cells after 4, 8 or 24 h of treatment. The heat maps show n = 4 for each time point with the respective colour scale located below each figure. The blue and red refer to down-regulated and upregulated proteins, respectively. The 4 h heat map (left panel) represents 66 differentially expressed proteins where 41 proteins are upregulated and 25 proteins are downregulated. The 8 h heat map (middle panel) represents 164 differentially expressed proteins where 72 proteins are upregulated and 92 proteins are downregulated. The 24 h heat map (right panel) represents 95 differentially expressed proteins where 49 proteins are upregulated and 46 proteins are downregulated. B Venn diagram analyses showing the unique and shared downregulated proteins between 0.5% DMSO and 20 µM Q7 treated OMM2.5 cells at 4, 8 and 24 h (upper panel), the unique and shared upregulated proteins between 0.5% DMSO and 20 µM Q7 treated OMM2.5 cells at 4, 8 and 24 h (middle panel), and the total amount of unique and shared differentially expressed proteins between 0.5% DMSO and 20 µM Q7 treated OMM2.5 cells at 4, 8 and 24 h (lower panel). C Volcano plots depicting the differentially expressed proteins between 0.5% DMSO and 20 µM Q7 treated OMM2.5 cells at 4 h (left panel), 8 h (middle panel) and 24 h (right panel). The proteins highlighted in red represent the proteins with a Student’s T-Test Difference ≥ 0.5. The proteins highlighted in blue represent those with a Student’s T-Test Difference ≤ − 0.5. The most consistently upregulated protein after 4, 8 or 24 h of treatment is heme oxygenase 1 (HO-1). DH Gene ontology (GO) classification of proteomic data for differentially expressed proteins between 0.5% DMSO and 20 µM Q7-treated OMM2.5 cells after 8 h (D, E) and 24 h (F, G) of treatment. D KEGG pathway analysis of significantly upregulated proteins in 20 µM Q7-treated vs 0.5% DMSO-treated OMM2.5 cells after 8 h of treatment, showing the most enriched categories in biological process. E Protein-protein interaction network showing the significantly upregulated proteins in 20 µM Q7-treated vs 0.5% DMSO-treated OMM2.5 cells associated to ferroptosis, after 8 h of treatment. F KEGG pathway analysis of significantly upregulated proteins in 20 µM Q7-treated vs 0.5% DMSO-treated OMM2.5 cells after 24 h of treatment, showing the most enriched categories in biological process. G Protein-protein interaction network showing the significantly upregulated proteins in 20 µM Q7-treated vs 0.5% DMSO-treated OMM2.5 cells associated to ferroptosis, after 24 h of treatment. The panel also shows upregulated (red nodes) and downregulated (blue node) proteins associated to fluid shear stress and atherosclerosis process. HO-1 upregulation is common to both pathways. (H) DAVID pathway analysis displaying significantly upregulated proteins at 8 h (red stars) and 24 h (red triangles) in 20 µM Q7-treated vs 0.5% DMSO-treated OMM2.5 cells in ferroptosis process. Image obtained from KEGG [102]. Q7 = 1,4-dihydroxy quininib; HMOX1 = HO-1; h = hours.
Fig. 2
Fig. 2. Most significantly altered proteins identified by proteomic profiling following 1,4 dihydroxy quininib treatment in OMM2.5 cells and immunoblot validation.
A Table showing the 10 most up- and down-regulated proteins in OMM2.5 cells after 4 h of treatment with 20 µM Q7. B Table showing the 10 most up- and down-regulated proteins in OMM2.5 cells after 8 h of treatment with 20 µM Q7. C Table showing the 10 most up- downregulated proteins in OMM2.5 cells after 24 h of treatment with 20 µM Q7. Protein names coloured in red and blue in tables A, B and C are Q7-upregulated and downregulated proteins, respectively, known to be associated to the ferroptosis pathway. D Immunoblot analysis of HO-1 and IREB2 in protein extracts from OMM2.5 cells treated with 0.5% DMSO or 20 µM Q7 for 4, 8 or 24 h. E Densitometric quantification of HO-1 and IREB2 normalized to beta-actin, as determined by n = 4 independent western blot experiments as in D (*, p < 0.05). F Immunoblot analysis of GDF-15 in protein extracts from OMM2.5 cells treated with 0.5% DMSO or 20 µM Q7 OMM2.5 cells for 4, 8 or 24 h. G Densitometric quantification of GDF15 normalized to beta-actin, as determined by at least three independent western blot experiments as in F (*, p < 0.05). The histograms report mean ± SEM. Q7 = 1,4-dihydroxy quininib; h = hours.
Fig. 3
Fig. 3. Treatment with 20 µM 1,4 dihydroxy quininib affects ROS, biliverdin, GSH, LOOH levels and NRF2, GPX4, GCLM expression in OMM2.5 cells.
A Evaluation of the effects of 20 µM Q7 on ROS levels in OMM2.5 cells after 8 (n = 4 independent experiments) and 24 (n = 3 independent experiments) h of treatment (*p < 0.05). B Western blot analysis of NRF2 expression in 0.5% DMSO or 20 µM Q7 treated OMM2.5 cells after 4 (n = 6 independent experiments), 8 (n = 6 independent experiments) and 24 (n = 5 independent experiments) h of treatment (*, p < 0.05; ** p < 0.01). C Densitometric quantification of NRF2 vs beta-actin as determined by at least three independent western blot experiments as in B. The results are expressed as means ± SEM. D Measurement of intracellular biliverdin in 0.5% DMSO- or 20 µM Q7- treated OMM2.5 cells after 4, 8 and 24 h of treatment (** p < 0.01). N = 3 independent experiments. E Western blot showing GPX4 expression in 0.5% DMSO- or 20 µM Q7- treated OMM2.5 cells after 4 (n = 3 independent experiments), 8 (n = 4 independent experiments) and 24 (n = 7 independent experiments) h. F Densitometric quantification of GPX4 vs beta-actin as determined by at least three independent western blot experiments as in E (*p < 0.05; ***p < 0.001). G Measurement of non-protein thiol group (RSH) concentrations after 4 (n = 4 independent experiments), 8 (n = 4 independent experiments) and 24 (n = 3 independent experiments) h of treatment (**p < 0.01; ***p < 0.001). H Evaluation of LOOH levels after 4 (n = 4 independent experiments), 8 (n = 4 independent experiments) and 24 (n = 3 independent experiments) h of treatment (**, p < 0.01). The results are expressed as means ± SEM. I Western blot showing GCLM expression in 0.5% DMSO- or 20 µM Q7- treated OMM2.5 cells after 4 (n = 6 independent experiments), 8 (n = 5 independent experiments), and 24 (n = 4 independent experiments) hours. J Densitometric quantification of GCLM normalized to beta-actin as determined by at least three independent western blot experiments as in I (** p < 0.01). The histograms report mean ± SEM. Q7 = 1,4-dihydroxy quininib; h = hours.
Fig. 4
Fig. 4. Quininib drugs and CysLT receptor antagonists exert overlapping and distinct effects on ferroptosis markers, while erastin reduces OMM2.5 cells metabolic activity.
A Western blot showing GPX4 and GCLM expression in 0.5% DMSO- or 20 µM Q7-, 50 µM montelukast-, 20 µM quininib-, 50 µM HAMI 3379- treated OMM2.5 cells after 8 h of treatment. B Densitometric quantification of GCLM (left) and GPX4 (right) vs beta-actin as determined by three independent western blot experiments as in A. C Western blot showing GPX4 and GCLM expression in 0.5% DMSO- or 20 µM Q7-, 50 µM montelukast-, 20 µM quininib-, 50 µM HAMI 3379- treated OMM2.5 cells after 24 h of treatment. D Densitometric quantification of GCLM (left) and GPX4 (right) vs. beta-actin as determined by three independent western blot experiments as in C (*, p < 0.05; ** p < 0.01). E A significant dose-dependent decrease of OMM2.5 cell metabolic activity was observed following 96 h of erastin treatment in comparison to 0.5% DMSO control. N = 3-4 independent experiments F IC50 value of erastin in OMM2.5 cell metabolic activity assays. Metabolic activity of cells was determined using MTT (3-(4,5-dimethylthiazol-2-yl)-2,5-diphenyltetrazolium bromide) assay. All the data are expressed as mean ± SEM (**p < 0.01; ****p < 0.0001). Q1 = quininib; Q7 = 1,4-dihydroxy quininib; h = hours.
Fig. 5
Fig. 5. 1,4-dihydroxy quininib significantly increases HO-1 and 4-HNE expression in MUM OPDX explants.
A Schematic of the explant culture protocol to evaluate 1,4 dihydroxy quininib effects. Rodent xenograft models of MUM have been generated by transplanting fresh patient’s tumor samples into the liver of mouse models. MUM tumours were removed from mouse liver and then dissected into 3 fragments, arbitrarily named left (L), middle (M), right (R). Each fragment was divided into 2 pieces and grown in complete media with 20 μM 1,4-dihydroxy quininib (Q7) or vehicle (0.5% DMSO) for 72 h. Tumour tissue was snap-frozen for protein isolation and western blot experiments. B Table showing the 2 MUM patients’ clinical characteristics. Tumors from these patients were used to generate OPDX mouse models, named UVM 4 and UVM 7. C Western blot analysis of HO-1 and GPX4 expression in 0.5% DMSO- or 20 µM Q7- treated MUM tumours cultured ex vivo for 72 h (*p < 0.05). D Densitometric quantification of HO-1 and GPX4 vs beta-actin as determined by at least three independent western blot experiments as in C (*p < 0.05). Data represent the mean ± SEM. N = 3 MUM OPDX models for each type of tumor, i.e., tumors from 3 UVM4 and 3 UVM7 mouse models. For each tumor fragments L and R were used to perform western blot. Triangles represent data from UVM 4 and circles represent data from UVM 7. E Western blot analysis of 4-HNE expression in 0.5% DMSO- or 20 µM Q7- treated MUM tumours cultured ex vivo for 72 h (*p < 0.05). F Densitometric quantification of 4-HNE vs beta-actin as determined by at least three independent western blot experiments as in E (*p < 0.05). Data represent the mean ± SEM. N = 3 MUM OPDX models for each type of tumor, i.e., tumors from 3 UVM4 and 3 UVM7 mouse models. For each tumor fragments L and R were used to perform Western blot. Triangles represent data from UVM 4 and circles represent data from UVM 7. Q7 = 1,4-dihydroxy quininib.
Fig. 6
Fig. 6. High expression levels of key genes involved in ferroptosis modulation are associated with a worse prognosis in the TCGA-UM cohort.
A Graphs showing the statistically significant relationship between expression levels of GPX4, SCL7A11, SLC3A2, HMOX1, GCLM, CTH, NQO1, ACSL3, IREB2, POR, AIFM2 and disomy 3 or monosomy 3 in the TCGA-UM cohort. B Graphs showing the statistically significant relationship between expression levels of GPX4, SCL7A11, SLC3A2, HMOX1, GCLM, CTH, NQO1, ACSL3, IREB2, POR, AIFM2 and the normal BAP1 (BAP1_mut NO) or mutated BAP1 (BAP1_mut YES) TCGA-UM cohort. (C) Kaplan–Meier survival curves showing the statistically significant relationship between the expression levels of GPX4, SCL7A11, SLC3A2, HMOX1, GCLM, CTH, NQO1, ACSL3, IREB2, POR, AIFM2 and overall survival in TCGA-UM patients presenting chromosome 3 disomy (chr3_status: disomy) or chromosome 3 monosomy (chr3_status: monosomy) UM patients. D Kaplan–Meier survival curves showing the statistically significant relationship between the expression levels of GPX4, SCL7A11, SLC3A2, HMOX1, GCLM, CTH, NQO1, ACSL3, IREB2, POR, AIFM2 and overall survival probability in normal BAP1(BAP1_mut: NO) or in mutated BAP1 (BAP1_mut: YES) TCGA-UM samples. E Kaplan–Meier survival curves showing the statistically significant relationship between the expression levels of GPX4, SCL7A11, SLC3A2, HMOX1, GCLM, CTH, NQO1, ACSL3, IREB2, POR, AIFM2 and DFS in TCGA-UM patients presenting chromosome 3 disomy (chr3_status: disomy) or chromosome 3 monosomy (chr3_status: monosomy). F Kaplan–Meier survival curves showing the statistically significant relationship between the expression levels of GPX4, SCL7A11, SLC3A2, HMOX1, GCLM, CTH, NQO1, ACSL3, IREB2, POR, AIFM2 and DFS in normal BAP1(BAP1_mut: NO) or in mutated BAP1 (BAP1_mut: YES) TCGA-UM samples.
Fig. 7
Fig. 7. High expression of a combination of genes inhibiting ferroptosis (IFerr) correlates with reduced overall and disease-free survival in the GSE84976 and TCGA-UM cohorts.
A Graphs showing the statistically significant relationship between expression levels of a novel ferroptosis signature (IFerr: GPX4, SCL7A11, SLC3A2, GCLM, CTH, ACSL3, IREB2, NQO1, AIFM2) and disomy 3 or monosomy 3 in the GSE22138, GSE27831, GSE84976 and TCGA-UM cohorts. GSVA = Gene Set Variation Analysis. B Kaplan-Meier curves revealing the statistically significant relationship between IFerr and OS in the GSE84976 and TCGA-UM cohorts. C Kaplan-Meier graphs showing the statistically significant relationship between IFerr and DFS in the GSE22138, GSE27831, GSE84976 and TCGA-UM cohorts.
Fig. 8
Fig. 8. Schematic model summarising alterations in the expression of the indicated ferroptosis hallmarks in MUM samples after 1,4-dihydroxy quininib treatment.
A Figure showing the specific factors modulated by 1,4-dihydroxy quininib in a time-dependent fashion. Created with BioRender.com. Subscription: Institution (University College Dublin) B. Table summarising the significant differences in ferroptosis hallmarks after 1,4-dihydroxy quininib. HO-1 and GCLM upregulations are based on OMM2.5 cells proteome profiling results. Non-significant differences are represented with “=”, significant downregulation with “” and significant upregulation with “”. Q7 = 1,4-dihydroxy quininib; Pi = phosphorylated; HMOX = HO-1; h = hours.

Similar articles

Cited by

References

    1. Jager MJ, Shields CL, Cebulla CM, Abdel-Rahman MH, Grossniklaus HE, Stern MH, et al. Uveal melanoma. Nat Rev Dis Primers. 2020;6:1–25. doi: 10.1038/s41572-020-0158-0. - DOI - PubMed
    1. Dogrusöz M, Jager MJ, Damato B. Uveal Melanoma Treatment and Prognostication. Asia-Pacific J Ophthalmol. 2017;6:186. - PubMed
    1. Stålhammar G, Gill VT. The long-term prognosis of patients with untreated primary uveal melanoma: A systematic review and meta-analysis. Critic Rev Oncol/Hematol. 2022;172:103652. doi: 10.1016/j.critrevonc.2022.103652. - DOI - PubMed
    1. Slater K, Hoo PS, Buckley AM, Piulats JM, Villanueva A, Portela A, et al. Evaluation of oncogenic cysteinyl leukotriene receptor 2 as a therapeutic target for uveal melanoma. Cancer Metastasis Rev. 2018;37:335–45. doi: 10.1007/s10555-018-9751-z. - DOI - PubMed
    1. Dhillon S. Tebentafusp: First Approval. Drugs. 2022;82:703–10. doi: 10.1007/s40265-022-01704-4. - DOI - PubMed