. 2024 Feb 10;10(1):71.
doi: 10.1038/s41420-024-01841-7.

Hsa_circ_0021205 enhances lipolysis via regulating miR-195-5p/HSL axis and drives malignant progression of glioblastoma

Affiliations

Hsa_circ_0021205 enhances lipolysis via regulating miR-195-5p/HSL axis and drives malignant progression of glioblastoma

Suwen Li et al. Cell Death Discov. .

Abstract

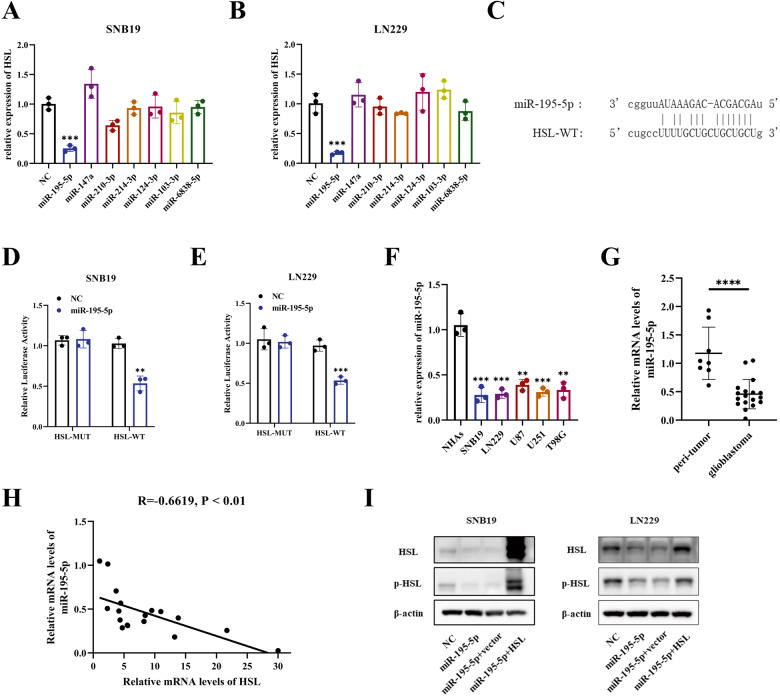
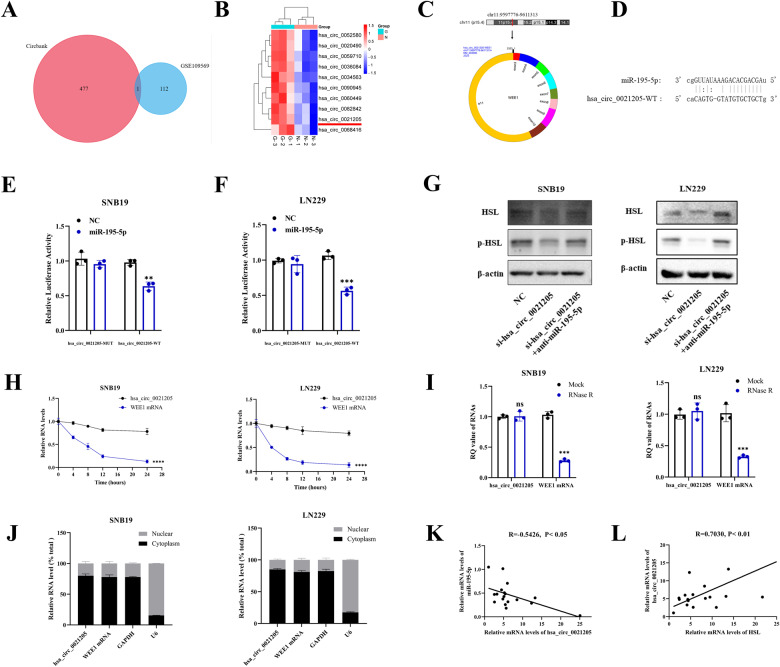
Abnormal lipid metabolism is an essential hallmark of glioblastoma. Hormone sensitive lipase (HSL), an important rate-limiting enzyme contributed to lipolysis, which was involved in aberrant lipolysis of glioblastoma, however, its definite roles and the relevant regulatory pathway have not been fully elucidated. Our investigations disclosed high expression of HSL in glioblastoma. Knock-down of HSL restrained proliferation, migration, and invasion of glioblastoma cells while adding to FAs could significantly rescue the inhibitory effect of si-HSL on tumor cells. Overexpression of HSL further promoted tumor cell proliferation and invasion. Bioinformatics analysis and dual-luciferase reporter assay were performed to predict and verify the regulatory role of ncRNAs on HSL. Mechanistically, hsa_circ_0021205 regulated HSL expression by sponging miR-195-5p, which further promoted lipolysis and drove the malignant progression of glioblastoma. Besides, hsa_circ_0021205/miR-195-5p/HSL axis activated the epithelial-mesenchymal transition (EMT) signaling pathway. These findings suggested that hsa_circ_0021205 promoted tumorigenesis of glioblastoma through regulation of HSL, and targeting hsa_circ_0021205/miR-195-5p/HSL axis can serve as a promising new strategy against glioblastoma.


Conflict of interest statement

The authors declare no competing interests.

Figures

Fig. 1
Fig. 1. High expression of HSL in glioblastoma.
A Expression of HSL in glioblastoma surgical specimen detected by qRT-PCR. B, C Expression of HSL in glioblastoma surgical specimen detected by Western blot and the box plot of HSL/beta-actin. D, E Immunohistochemical detection of HSL in representative para-tumor brain tissues and glioblastoma tissues. F, G HSL expression in human glioblastoma cell lines (SNB19, LN229, U87MG, U251MG, T98G) by qRT-PCR and Western blot. H Kaplan–Meier analysis of glioblastoma patients with relatively high or low expression of HSL. I Relative quantitation of FAs in 18 glioblastoma and 8 matched peri-tumor brain tissues. Data are expressed as mean ± SD. *p < 0.05, **p < 0.01, ***p < 0.001, ****p < 0.0001.
Fig. 2
Fig. 2. HSL knockdown restrained the malignant phenotypes of glioblastoma cells in vitro, and can be rescued by supplement of FAs.
A Detection of cell transfection efficiency of HSL siRNAs by qRT-PCR. B Detection of cell transfection efficiency of HSL siRNA-1 by Western blot. C, D CCK8 assay was performed to detect cell viability in SNB19 and LN229 cells with NC, si-HSL transfection, or si-HSL supplemented with 10 μM FAs, respectively. E, F Colony formation assay was performed to evaluate the effect of HSL knockdown or si-HSL supplemented with 10 μM FAs on cell proliferation ability. G, H Wound healing assay was conducted to evaluate changes of cell migration ability of SNB19 and LN229 cells treated with NC, si-HSL or si-HSL supplemented with 10 μM FAs, respectively (bar = 400 µm). I, J Invasion and migration capabilities were determined by transwell assay in SNB19 and LN229 cells with NC, si-HSL or si-HSL supplemented with 10 μM FAs. K The protein expression of N-cadherin, Slug, β-catenin, Occludin, 4E-BP1 and p-4E-BP1 were analyzed by Western blot in SNB19 and LN229 cells transfected with NC or si-HSL. Data are expressed as mean ± SD. *p < 0.05, **p < 0.01, ***p < 0.001, ****p < 0.0001.
Fig. 3
Fig. 3. HSL overexpression promoted the malignant phenotypes of glioblastoma cells in vitro.
A, B HSL expression in SNB19 and LN229 cells transfected with either empty or HSL overexpression vector were detected by qRT-PCR and Western blot. C, D CCK8 assay was utilized to compare cell proliferation of HSL overexpressed SNB19 or LN229 cells. E, F Colony formation assay was performed to evaluate the effect of HSL overexpression on cell proliferation ability. G, H Effect of HSL overexpression on SNB19 and LN229 cells migration evaluated by wound healing assay (bar = 400 µm). I, J Invasion and migration capabilities were examined by transwell assay in both SNB19 and LN229 cells with or without HSL overexpression. K The protein expression of N-cadherin, Slug, β-catenin, Occludin, 4E-BP1 and p-4E-BP1 were analyzed by Western blot in SNB19 and LN229 cells transfected with the empty vector or HSL-overexpression plasmids. Data are expressed as mean ± SD. *p < 0.05, **p < 0.01, ***p < 0.001, ****p < 0.0001.
Fig. 4
Fig. 4. MiR-195-5p negatively regulated HSL expression in glioblastoma cells.
A, B After overexpression of 7 miRNAs predicted by Starbase website, qRT-PCR was performed to evaluate the relative expression of HSL. C The binding sites between miR-195-5p and HSL predicted by Starbase. D, E miR-195-5p targets at HSL verified by dual-luciferase reporter assay. F The expression of miR-195-5p in glioblastoma cell lines (SNB19, LN229, U87MG, U251MG, T98G) by qRT-PCR. G miR-195-5p expression in 18 clinical glioblastoma specimens and 8 peri-tumor brain tissues by qRT-PCR. H Correlation analysis on the relationship between relative mRNA levels of miR-195-5p and HSL in 18 glioblastoma specimens. I The protein expression of HSL after transfection with NC, miR-195-5p mimics, miR-195-5p mimics+vector, or miR-195-5p mimics+HSL, respectively. Data are expressed as mean ± SD. *p < 0.05, **p < 0.01, ***p < 0.001, ****p < 0.0001.
Fig. 5
Fig. 5. MiR-195-5p/HSL axis accelerated malignant progression of glioblastoma in vitro.
A, B CCK8 assay, (C, D) Colony formation, (E, F) Wound healing assay (bar = 400 µm), (G, H) Invasion and migration assays were performed and quantitative analysis on SNB19 and LN229 cells transfected with NC, miR-195-5p mimics, miR-195-5p mimics+vector, or miR-195-5p mimics +HSL, respectively. I The protein levels of N-cadherin, Slug, β-catenin, Occludin, 4E-BP1 and p-4E-BP1 were analyzed by Western blot in SNB19 and LN229 cells transfected with NC, miR-195-5p mimics, miR-195-5p mimics+vector, or miR-195-5p mimics+HSL, respectively. Data are expressed as mean ± SD. *p < 0.05, **p < 0.01, ***p < 0.001, ****p < 0.0001.
Fig. 6
Fig. 6. Hsa_circ_0021205 sponged miR-195-5p to regulate HSL expression.
A Venn diagram of the overlapping target circRNAs of miR-195-5p predicted by Circbank and GSE109569 datasets. B Relative expression of hsa_circ_0021205 in GSE109569 datasets. C The location and illustration of hsa_circ_0021205. D Predicted binding sites between miR-195-5p and hsa_circ_0021205. E, F Dual-luciferase reporter assay was performed to verify the associative relations between hsa_circ_0021205 and miR-195-5p in SNB19 and LN229 cells. G Protein expression of HSL in SNB19 and LN229 cells after transfection with NC, si-hsa_circ_0021205, or si-hsa_circ_0021205+anti-miR-195-5p, respectively. H Relative mRNA expression of hsa_circ_0021205 and WEE1 after treatment with actinomycin D at the indicated time points. I RQ values of hsa_circ_0021205 and WEE1 mRNA in SNB19 and LN229 cells under RNase R treatment. J Nucleocytoplasmic fractionation revealed the subcellular localization of hsa_circ_0021205 in SNB19 and LN229 cells. K Correlation analysis on the relationship between relative mRNA levels of miR-195-5p and hsa_circ_0021205 in 18 glioblastoma specimens. L Correlation analysis on the relationship between relative mRNA levels of hsa_circ_0021205 and HSL in 18 glioblastoma specimens. Data are expressed as mean ± SD. *p < 0.05, **p < 0.01, ***p < 0.001, ****p < 0.0001.
Fig. 7
Fig. 7. Hsa_circ_0021205 knockdown restrained the malignant phenotypes of glioblastoma cells in vitro, which can be rescued by either supplement of FAs or co-transfection with anti-miR-195-5p.
A, B Expression of hsa_circ_0021205 in glioblastoma cell lines (SNB19, LN229, U87MG, U251MG, T98G) and clinical glioblastoma specimens detected by qRT-PCR. C, D CCK8 assay, (E, F) Colony formation, (G, H) Invasion and migration assays, and (I, J) Wound healing assay (bar = 400 µm) were performed and quantitatively analyzed in SNB19 and LN229 cells transfected with NC, si-hsa_circ_0021205, si-hsa_circ_0021205+anti-miR-195-5p, respectively. K The protein levels of N-cadherin, Slug, β-catenin, Occludin, 4E-BP1 and p-4E-BP1 were detected by Western blot in SNB19 and LN229 cells transfected with NC, si-hsa_circ_0021205, or si-hsa_circ_0021205+anti-miR-195-5p, respectively. L Transfection efficiency of si-hsa_circ_0021205 in SNB19 and LN229 cells detected by qRT-PCR. Data are expressed as mean ± SD. *p < 0.05, **p < 0.01, ***p < 0.001, ****p < 0.0001.
Fig. 8
Fig. 8. Hsa_circ_0021205/miR-195-5p/HSL axis promoted abnormal lipolysis in vitro and accelerates glioblastoma proliferation in vivo.
A Relative intracellular FAs levels in SNB19 and LN229 cells after transfection. B, C Relative intracellular DAG and MAG levels in SNB19 and LN229 cells detected by ELISA after transfection. D Oil red O staining was conducted to stain intracellular neutral fat of SNB19 and LN229 cells in vitro. E, F In vivo evaluation of glioblastoma growth in subcutaneous tumor model. SNB19 cells with sh-NC, sh-hsa_circ_0021205, sh-hsa_circ_0021205 + HSL-EV, or sh-hsa_circ_0021205 + HSL-OE, respectively, were inoculated in the right subcutaneous axillary region of BALB/c nude mice. G, H Ki-67 positive cells were counted in the sections of xenografts by immunohistochemical staining. I Representative intracranial tumor xenografts of HE staining images are shown. Data are expressed as mean ± SD. *p < 0.05, **p < 0.01, ***p < 0.001, ****p < 0.0001.

Similar articles

Cited by

References

    1. Cloughesy TF, Cavenee WK, Mischel PS. Glioblastoma: from molecular pathology to targeted treatment. Annu Rev Pathol. 2014;9:1–25. doi: 10.1146/annurev-pathol-011110-130324. - DOI - PubMed
    1. Kang H, Lee H, Kim D, Kim B, Kang J, Kim HY et al. Targeting glioblastoma stem cells to overcome chemoresistance: an overview of current therapeutic strategies. Biomedicines. 2022;10. 10.3390/biomedicines10061308. - PMC - PubMed
    1. Stupp R, Taillibert S, Kanner AA, Kesari S, Steinberg DM, Toms SA, et al. Maintenance therapy with tumor-treating fields plus temozolomide vs temozolomide alone for glioblastoma: a randomized clinical trial. JAMA. 2015;314:2535–43. doi: 10.1001/jama.2015.16669. - DOI - PubMed
    1. Sun X, Turcan S. from laboratory studies to clinical trials: temozolomide use in IDH-mutant gliomas. Cells. 2021;10. 10.3390/cells10051225. - PMC - PubMed
    1. Srivastava NK, Pradhan S, Gowda GAN, Kumar R. In vitro, high-resolution 1H and 31P NMR based analysis of the lipid components in the tissue, serum, and CSF of the patients with primary brain tumors: one possible diagnostic view. NMR Biomed. 2010;23:113–22. doi: 10.1002/nbm.1427. - DOI - PubMed