. 2024 Feb 10;15(1):1274.
doi: 10.1038/s41467-024-45386-w.

Matrin3 mediates differentiation through stabilizing chromatin loop-domain interactions and YY1 mediated enhancer-promoter interactions

Affiliations

Matrin3 mediates differentiation through stabilizing chromatin loop-domain interactions and YY1 mediated enhancer-promoter interactions

Tianxin Liu et al. Nat Commun. .

Abstract

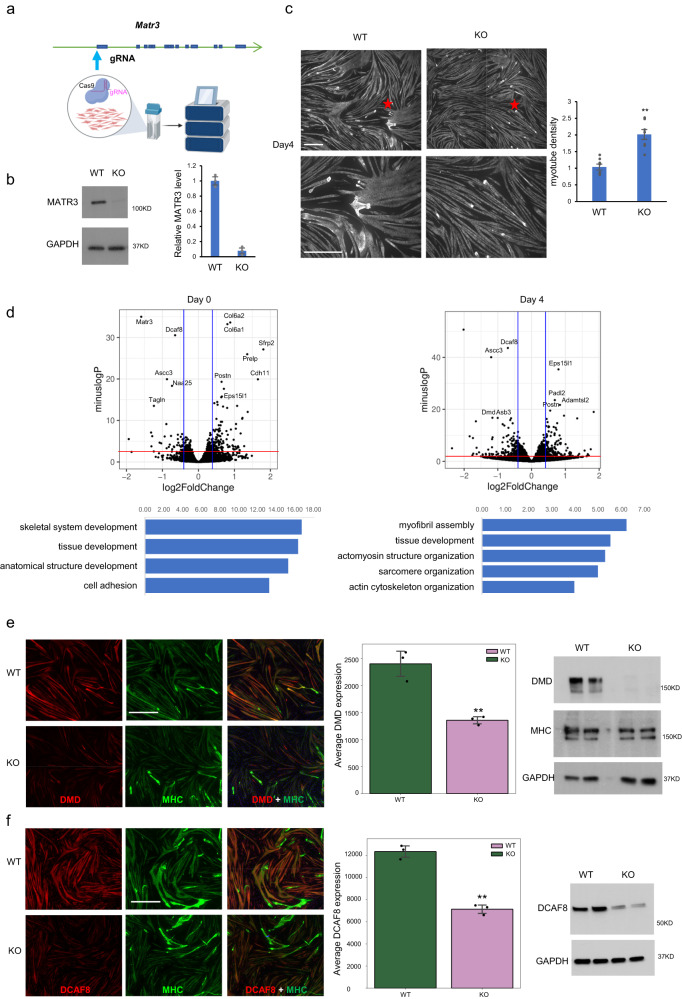
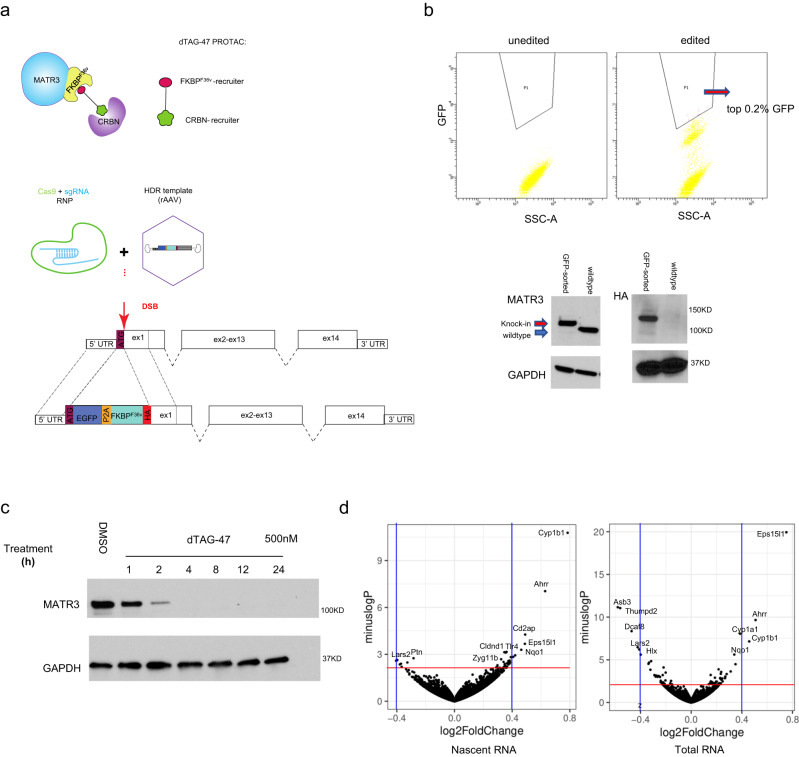
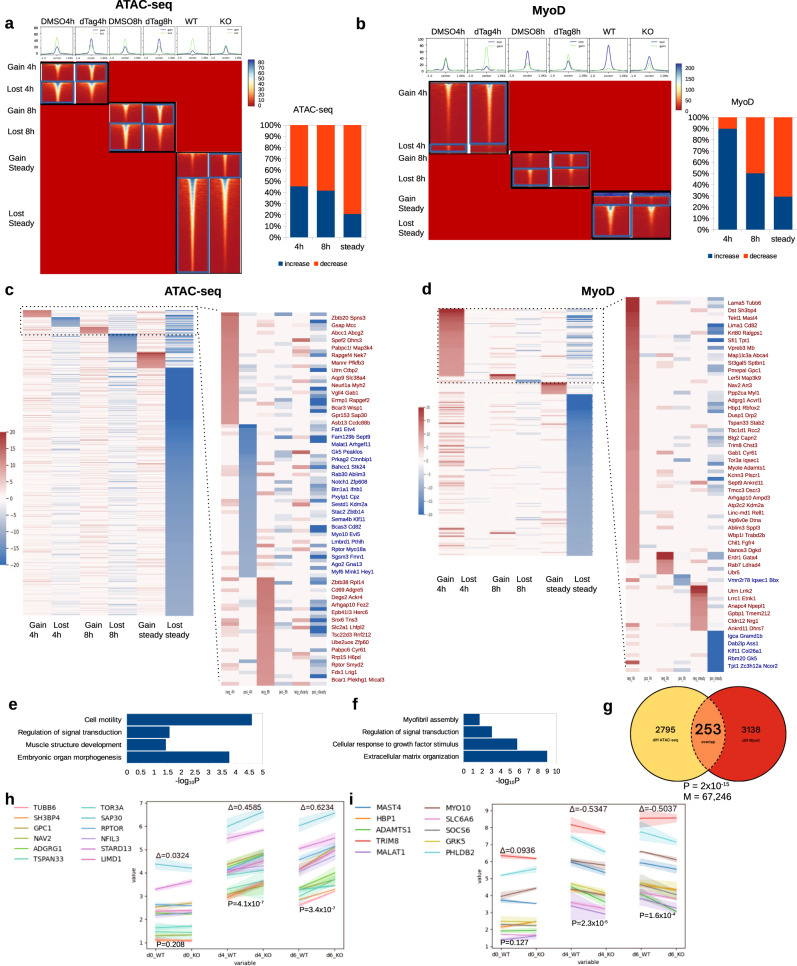
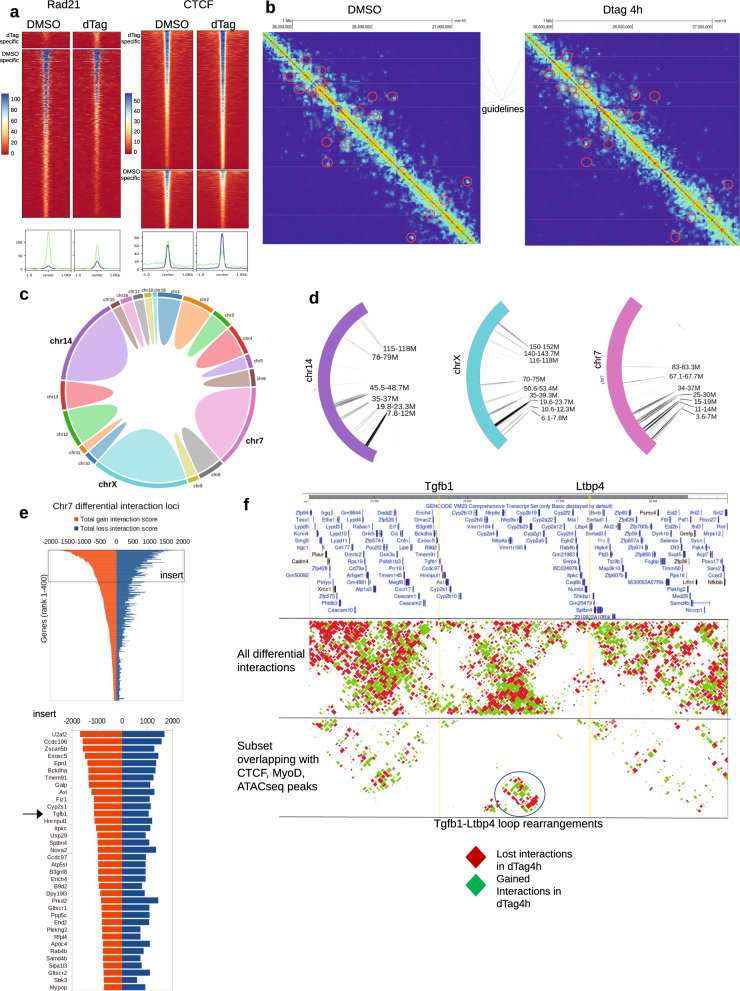
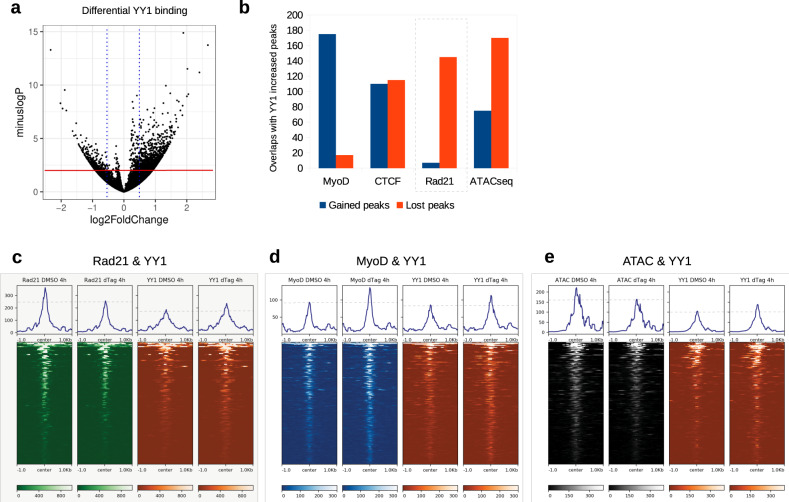
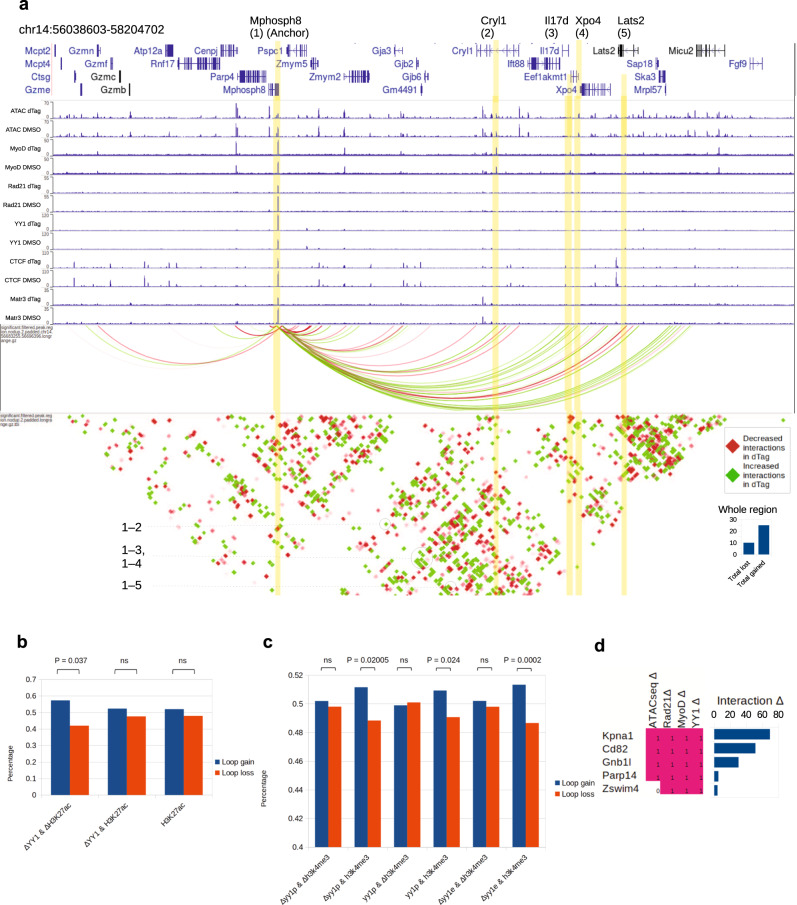
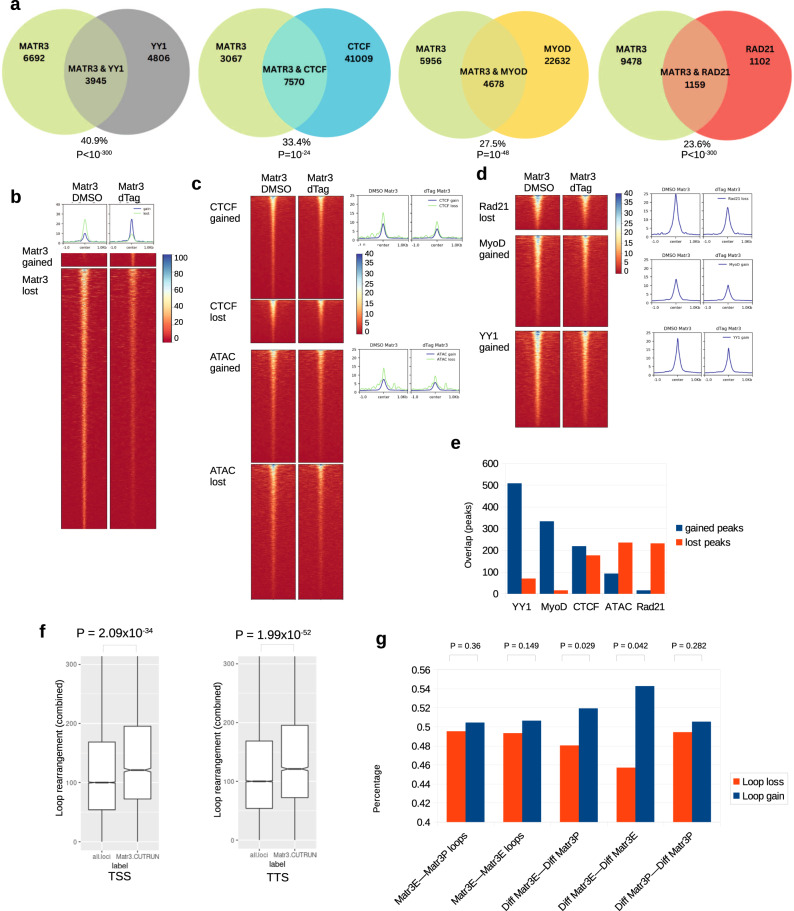
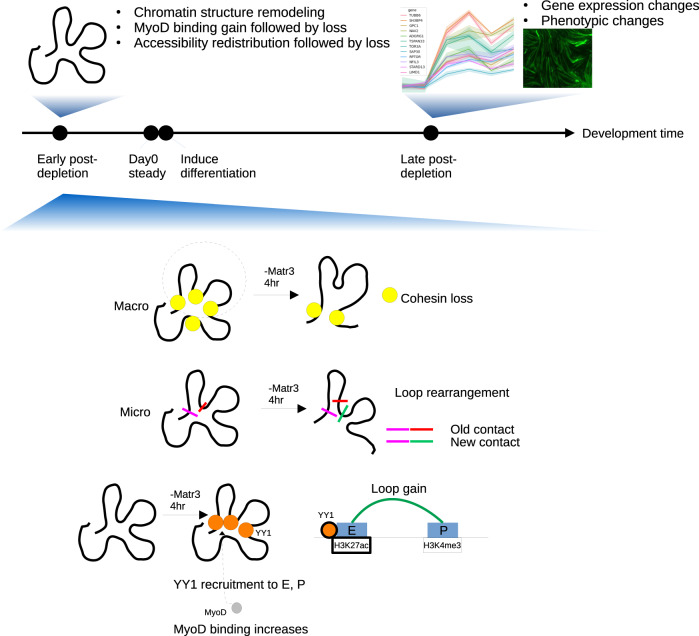
Although emerging evidence indicates that alterations in proteins within nuclear compartments elicit changes in chromosomal architecture and differentiation, the underlying mechanisms are not well understood. Here we investigate the direct role of the abundant nuclear complex protein Matrin3 (Matr3) in chromatin architecture and development in the context of myogenesis. Using an acute targeted protein degradation platform (dTAG-Matr3), we reveal the dynamics of development-related chromatin reorganization. High-throughput chromosome conformation capture (Hi-C) experiments revealed substantial chromatin loop rearrangements soon after Matr3 depletion. Notably, YY1 binding was detected, accompanied by the emergence of novel YY1-mediated enhancer-promoter loops, which occurred concurrently with changes in histone modifications and chromatin-level binding patterns. Changes in chromatin occupancy by Matr3 also correlated with these alterations. Overall, our results suggest that Matr3 mediates differentiation through stabilizing chromatin accessibility and chromatin loop-domain interactions, and highlight a conserved and direct role for Matr3 in maintenance of chromosomal architecture.


Conflict of interest statement

The authors have no competing interests.

Figures

Fig. 1
Fig. 1. Matr3 loss leads to defects in myogenesis.
a Generation of Matr3 knockout (KO) bulk using Cas9/RNP transfection (see methods). Figure created with BioRender.com. b Matr3 protein level was reduced significantly in Matr3KO bulk. MATR3 expression was assessed in wildtype and Matr3 KO C2C12 cells by Western blot and quantified (n = 3 independent experiments). p = 1.25E-05, by two-sided t test. c Myotubes in Matr3 KO exhibited a significantly increased density than wildtype. C2C12 Matr3 KO and wildtype were differentiated for 4 days, and immunostained with Myosin heavy chain. The bottom images were magnified views from the regions marked with stars in upper images. Myotube intensity in Matr3KO and WT were quantified (n = 8 independent samples). p = 2.96E-05, by two-sided t test. All the images were taken from the same regions in each replicate using Yokogawa CV7000 microscope with the same setting. Scale bar, 500 µm. b, c data are presented as mean values ±SEM. d Knockout of Matr3 contributed to differential gene expression. RNA-seq of cells at myoblast (Day0) and myotube (Day4) stages. Expression changes were measured by KO-WT. In volcano plots, p values from the Wald test less than 0.05 (p < 0.05) for red line, and log2FC > 0.4 for the vertical blue lines denote significant DE genes. DE genes were associated with skeletal muscle development (GO term, bottom panel). e Duchenne muscular dystrophy gene (DMD) expression was reduced in Matr3 KO myotubes. C2C12 Matr3 KO and wildtype were differentiated 4 days, and immunostained with DMD (red) and MHC (green). Signal intensity was quantified (n = 3). Scale bar, 500 µm. p = 0.0089, by Mann-Whitney U test. Protein level of DMD was confirmed by Western blots (right panel), and 2 independent experiments were repeated with similar results. f DCAF8 expression was reduced in Matr3 KO myotubes. C2C12 Matr3 KO and wildtype were differentiated 4 days, and immunostained with DCAF8 (red) and MHC (green). Signal intensity was quantified (n = 3). Scale bar, 500 µm. p = 0.00016, by Welch’s t test. Protein level of DCAF8 was confirmed by Western blot (right panel), and 2 independent experiments were repeated with similar results. e, f data are presented as mean values ±SD. Source data are provided as a Source Data file.
Fig. 2
Fig. 2. dTAG-Matr3 could be degraded within 4 h., and acute depletion of Matr3 contributes to few changes in nascent RNA production.
a Strategy to knockin FKBP F36v at the 5’ end of Matr3. The dTAG-47 PROTAC recruits the CRBN E3 ligase complex to FKBP F36v-Matr3. b High-efficient knockin bulk FKBP F36v-Matr3 were sorted by GFP and confirmed by Western blot. Cells enriched in the top 0.2% highest GFP signal were sorted (GFP-sorted). FKBP F36v-Matr3 (refer as dTAG-Matr3) bands were enriched in the GFP-sorted bulk, and tagging efficiency was also confirmed by HA antibody. The confirmation of Knockin was repeated 3 times independently with similar results. c Matr3 protein was depleted within 4 h. upon dTAG47 exposure. Western blots of dTAG-Matr3 upon dTAG47 (500 nM) treatment in a time course. Confirmation of degradation was repeated 3 times independently with similar results. d Nascent RNA and total RNA were quantified by SLAM-seq upon 4 h. Matr3 depletion. In volcano plots, p values from the Wald test less than 0.05 (p < 0.05) for red line, and log2FC > 0.4 for the vertical blue lines denote significant DE genes. Source data are provided as a Source Data file.
Fig. 3
Fig. 3. Matr3 depletion alters chromatin accessibility and MyoD binding, which foreshadow later gene expression changes.
a Heatmap showing differential chromatin accessibility (ATAC-seq) at 4 h., 8 h. post Matr3 depletion and steady state (Matr3 KO). Bar chart: percentage of peak increased and decreased per time point. b Same panels with (a) for MyoD binding (CUT&RUN). Gains trended down over time while losses increased. c Genes mapped by differentially chromatin accessible peaks per time point (4 h., 8 h., steady), illustrating the magnitude and number of changes. Accessibility was primarily lost at steady state. d Genes mapped by differential MyoD binding. Particularly striking were MyoD binding gains at 4 h. and loss at steady state. e GO biological process enrichment on differentially ATAC-seq mapped genes (4 h.). f GO enrichment on differential MyoD bound genes (4 h.). In (e, f), hypergeometric test, two-sided were used and Padj values are shown. Adjusted for multiple comparisons by Benjamini and Hochberg (BH) method. g Overlap of differential ATAC and MyoD bound regions (4 h.). P: P value. Hypergeometric test (one-sided) with multiple comparisons by BH method. M: number of co-bound peaks. Number in circle: # of differential peaks. h, i Early differentially accessible and MyoD bound genes elicited expression changes later in development (days 4 and 6). Genes were selected from heatmap in (c, d) as having MyoD 4 h. binding gain or ATAC 4 h. gain/loss. Expression changes (measured by ∆=KO-WT) were followed during development. Expression changes were not significant at day 0 (steady state, both up and down p > 0.1), but evident at days 4, and 6 (both up and down p < 0.00016). Upregulated genes in Matr3 downregulated genes exhibited positive ∆ (h), downregulated genes in Matr3KO show negative ∆ (i). Error bars and bands represent 95% confidence interval of mean. Paired t test, one-sided was used. No multiple comparison is made. Source data are provided as a Source Data file.
Fig. 4
Fig. 4. Matr3 depletion extensively rearranges loop domain interactions.
a Substantial reduction of Rad21 binding 4 h. following Matr3 depletion. CTCF occupancy was marked by both gains and losses. The histograms below summarize the binding intensities (green: lost peaks, blue: gained peaks). b Example of loop rearrangements derived from Hi-C experiments that characterized the effect on chromatin structure at fragment resolution (on average 5 kb). Red circles denote sites of differential interactions. c Distribution of the number of differential interactions across all chromosomes. d Chromosomes 14, X, and 7 exhibited the greatest interaction changes with most rearranged regions indicated. e A ranking of gene promoters with most differential interactions on Chromosome 7, in which Tgfb1 was ranked near the top (see insert). f Interaction landscape at the Tgfb1 region on Chromosome 7 revealed interweaving patterns of interaction gains (green) and losses (red). Certain sites harbored more interaction changes than others. Notable was Tgfb1-Ltbp4 loop rearrangement (circled) which also overlapped with CTCF, MyoD, ATACseq peaks. Rearrangement was formed between Tgfb1 (highlighted by yellow line), and Ltbp4 (yellow line) and bore the signature of adjacent gains and losses at the same location. Source data are provided as a Source Data file.
Fig. 5
Fig. 5. Loss of Matr3 disrupts YY1 binding and YY1-enriched cohesin loading.
a YY1 binding enhanced upon Matr3 depletion (4 h.). Volcano plot showing the logFoldChange vs. -log P value of YY1 binding changes (measured by ∆=dTAG-DMSO treatment). Red line: significance line (P = 0.05). Wald test are corrected for multiple comparison using the BH method. b Co-occurrence of differential YY1 occupancy with MyoD, CTCF, Rad21, ATAC-seq. Number of shared differential peaks between YY1 increased (4 h.) and the gained/lost portion (4 h.) of MyoD, CTCF, Rad21, or ATAC-seq. Box: the overlap percentage with Rad21 binding loss was highest, showing a relationship between YY1 differential binding and cohesin loss. c Heatmap showing that Rad21 binding was lost at sites of YY1 binding increase. Dashed line on the histogram shows the reference line to aid comparison between dTAG47 treatment and DMSO. d Heatmap showing MyoD binding was enhanced at sites of YY1 binding increase. e Heatmap showing ATAC-seq peaks were decreased at sites of YY1 binding increase. Source data are provided as a Source Data file.
Fig. 6
Fig. 6. Loss of Matr3 disrupts YY1-mediated enhancer-promoter loop formation.
a Loci characterized by enhanced YY1 occupancy exhibited increased E-E and E-P loops. Mphosph8 locus was an example of a promoter with differential YY1 binding causing EP- loop gains with neighboring MyoD, ATAC-seq peaks. Mphosph8 (highlighted by yellow line) exhibited a dual YY1-gain and Rad21-loss signature. The gene formed increased interactions (highlighted by green arcs) with Cryl1 (2), Il17d (3), Xpo4 (4), and Lats (2) (highlighted by yellow lines), which displayed MyoD and ATAC peaks at these positions. Interaction dot map further reaffirmed the positive increase in EP-loop interactions. Histograms (bottom right) indicated the interaction gain/loss scores across the whole region in the plot. b YY1-mediated EP loops changed in a H3K27ac-dependent manner in the absence of Matr3. Loop gain/loss ratios were measured. YY1 enhancers with joint H3K27Ac change (∆YY1 & ∆H3K27Ac) were more likely to demonstrate loop gains than YY1 enhancers with no H3K27Ac changes (∆YY1 & H3K27Ac). c Increased YY1 and differential H3K4me3 sites were associated with reduction of E-P loop gain. YY1-mediated EP loops changed in a H3K4me3-dependent manner in the absence of Matr3. YY1p: YY1 promoters. YY1e: YY1 enhancers. YY1 promoters with co-differential H3K4me3 (∆YY1p & ∆H3K4me3) were compared to YY1 promoters with no H3K4me3 changes (∆YY1p & H3K4me3). In (b, c) Wilcoxon’s rank-sum test (one-sided), corrected for multiple comparisons by BH method. d Sites of 4-way (ATAC-seq, Rad21, MyoD, YY1) co-differential signatures were more likely to harbor loop interaction changes. Source data are provided as a Source Data file.
Fig. 7
Fig. 7. Matr3 depletion directly impacts Rad21, CTCF, MyoD and YY1 occupancy, chromatin accessibility, and chromatin looping.
a Overlap between Matr3 occupancy (profiled by CUT&RUN) and YY1, CTCF, MyoD, and Rad21 occupancy. Hypergeometric test (one-sided) with multiple comparisons by BH method. b Heatmap showing Matr3 occupancy (CUT&RUN) at 4 h. post Matr3 depletion (dTAG) compared with control (DMSO). c Heatmaps showing regions with reduced Matr3 occupancy exhibit differential CTCF occupancy and differential chromatin accessibility. Right: histograms showing Matr3 CUT&RUN signal magnitude. d Heatmaps showing regions with reduced Matr3 occupancy exhibit lost Rad21, gained Myod, gained YY1 occupancies. Right: histograms showing Matr3 CUT&RUN signal magnitude. Note that Matr3 signals at Rad21, MyoD, YY1 locations are stronger than those of CTCF and ATAC-seq in (c). e Co-occurrence of differential Matr3 occupancy with YY1, MyoD, CTCF, Rad21 occupancy and ATAC-seq. Number of shared differential peaks between Matr3 loss with YY1 gains was highest. f TSS (transcription start sites) and TTS (transcription-termination sites) that occupied by Matr3 are more enriched for loop rearrangements than random loci. n = 3 biologically independent experiments. For TSS boxplot: N = 16990 (all.loci), N = 1993 (Matr3.CR). For TTS boxplot: N = 16990 (all.loci), N = 1098 (Matr3.CR). Boxplot shows the median, 3rd quartile (upper-bound), and 1st quartile (lower-bound). Notches in the boxplot extend the range of median ± 1.58 * IQR/sqrt(n) where IQR is the inter-quartile range. The whiskers extend no further than 1.5 * IQR from the hinge, and no lower than 1.5*IQR of the bottom hinge. Welch’s t test (unequal variance), no multiple comparison. g Different scenarios of E-P & E-E loop gains and loss at Matr3-occupied anchors. Anchors characterized by reduced Matr3 occupancy exhibited increased E-E and E-P loops. Matr3E—Matr3P loops, E-P loop anchors with no Matr3 occupancy change (1st dataset). Matr3E—Matr3E loops, E-E loops with no Matr3 occupancy change (2nd dataset). Diff Matr3E—Diff Matr3P, E-P loop with reduced Matr3 occupancy (3rd dataset, p = 0.029). Diff Matr3E—Diff Matr3E, E-E loop with reduced Matr3 occupancy (4th dataset, p = 0.042). Diff Matr3P—Diff Matr3P, P-P loop with reduced Matr3 occupancy (5th dataset). Wilcoxon’s rank-sum test (one-sided), multiple comparisons by BH method. Source data are provided as a Source Data file.
Fig. 8
Fig. 8. Matr3 mediates differentiation through stabilizing chromatin accessibility and chromatin loop-domain interactions, and YY1 mediated enhancer-promoter interactions.
Acute depletion of Matr3 loss immediately reduced cohesin loading, and destabilized chromatin structural loops and affected long distance interactions. As a mechanism for partial compensation of loop re-arrangement, YY1 was recruited to sites of cohesin loss, as well as enhancers and promoter sites, and formed new E-P loops, thereby disrupting the E-P loop landscape. During myogenesis, MyoD was recruited to those chromatin sites, leading to gene expression changes as skeletal muscle development progressed.

Similar articles

Cited by

References

    1. Nakayasu H, Berezney R. Nuclear matrins: identification of the major nuclear matrix proteins. Proc. Natl. Acad. Sci. USA. 1991;88:10312–10316. doi: 10.1073/pnas.88.22.10312. - DOI - PMC - PubMed
    1. Engelke R, et al. The quantitative nuclear matrix proteome as a biochemical snapshot of nuclear organization. J. Proteome Res. 2014;13:3940–3956. doi: 10.1021/pr500218f. - DOI - PubMed
    1. Coelho MB, et al. Nuclear matrix protein Matrin3 regulates alternative splicing and forms overlapping regulatory networks with PTB. EMBO J. 2015;34:653–668. doi: 10.15252/embj.201489852. - DOI - PMC - PubMed
    1. Salton M, Lerenthal Y, Wang SY, Chen DJ, Shiloh Y. Involvement of Matrin 3 and SFPQ/NONO in the DNA damage response. Cell Cycle. 2010;9:1568–1576. doi: 10.4161/cc.9.8.11298. - DOI - PubMed
    1. Salton M, et al. Matrin 3 binds and stabilizes mRNA. PLoS One. 2011;6:e23882. doi: 10.1371/journal.pone.0023882. - DOI - PMC - PubMed