. 2024 Feb 10;14(1):3433.
doi: 10.1038/s41598-024-53261-3.

A novel theta-controlled vibrotactile brain-computer interface to treat chronic pain: a pilot study

Affiliations

A novel theta-controlled vibrotactile brain-computer interface to treat chronic pain: a pilot study

Phillip Demarest et al. Sci Rep. .

Abstract

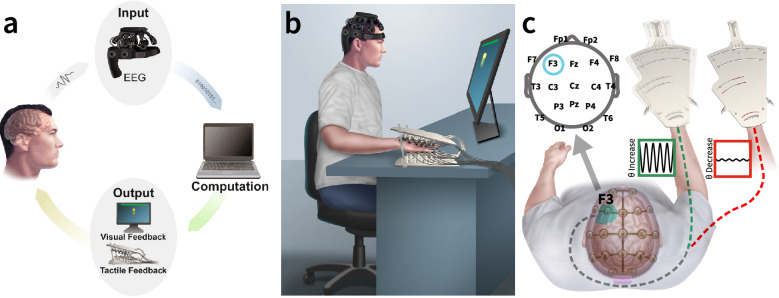
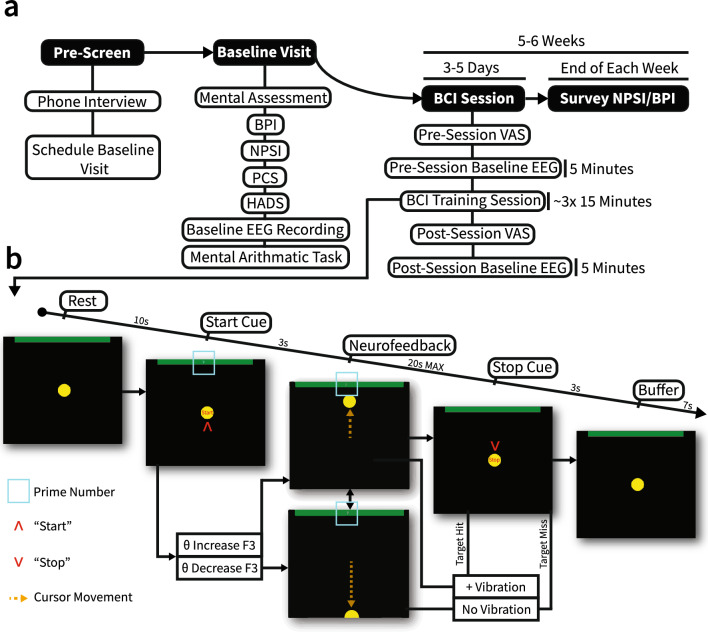
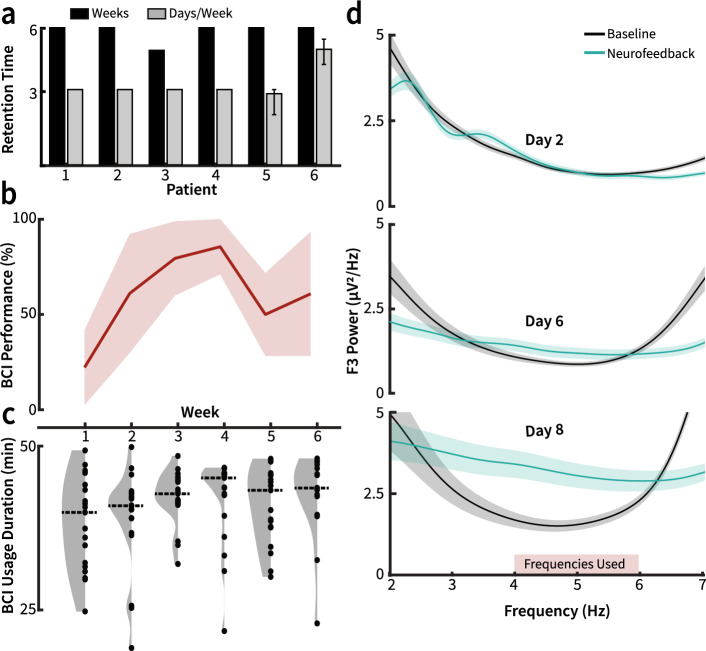
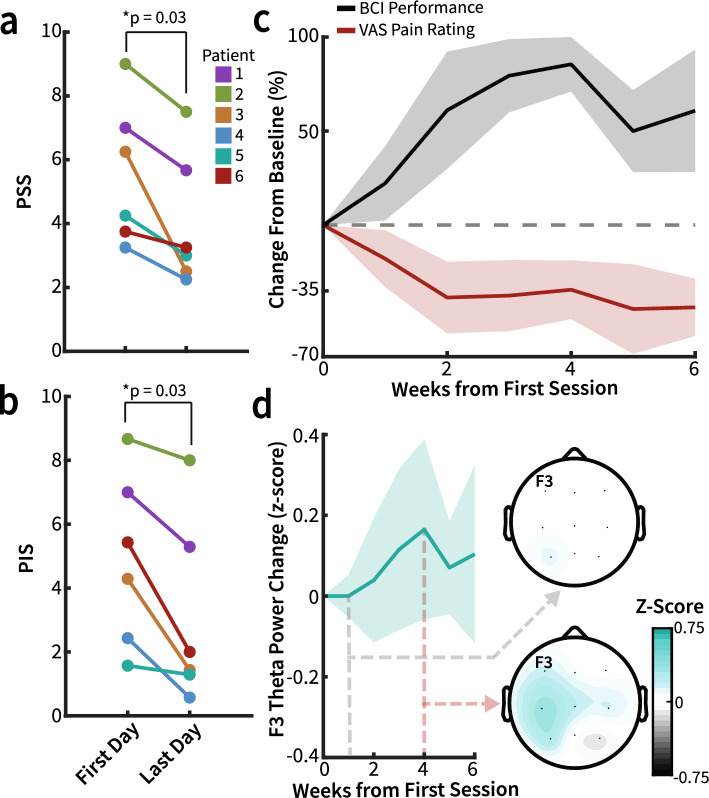
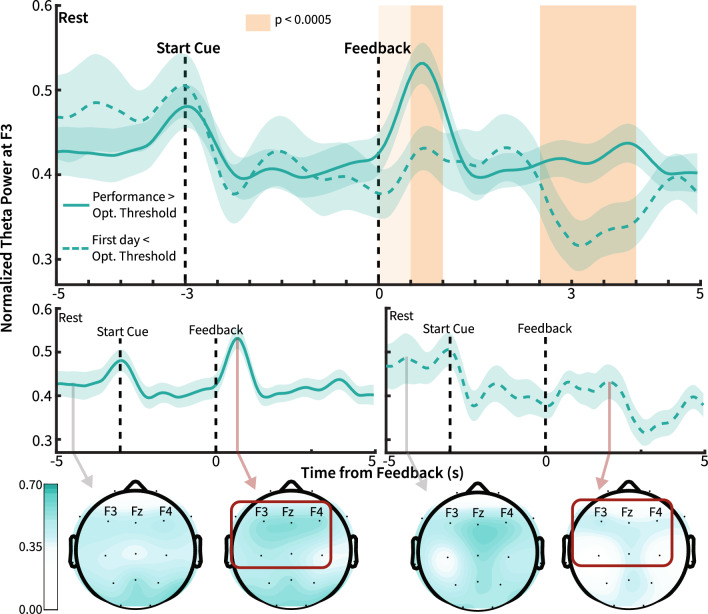
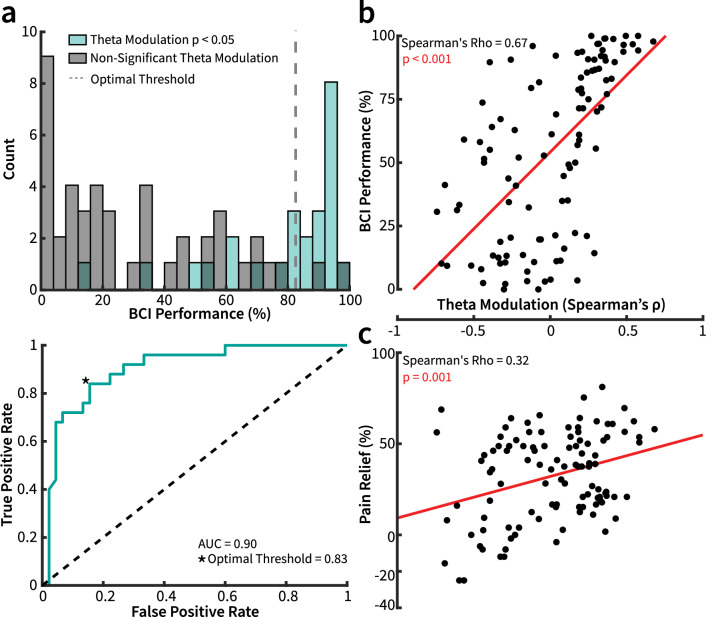
Limitations in chronic pain therapies necessitate novel interventions that are effective, accessible, and safe. Brain-computer interfaces (BCIs) provide a promising modality for targeting neuropathology underlying chronic pain by converting recorded neural activity into perceivable outputs. Recent evidence suggests that increased frontal theta power (4-7 Hz) reflects pain relief from chronic and acute pain. Further studies have suggested that vibrotactile stimulation decreases pain intensity in experimental and clinical models. This longitudinal, non-randomized, open-label pilot study's objective was to reinforce frontal theta activity in six patients with chronic upper extremity pain using a novel vibrotactile neurofeedback BCI system. Patients increased their BCI performance, reflecting thought-driven control of neurofeedback, and showed a significant decrease in pain severity (1.29 ± 0.25 MAD, p = 0.03, q = 0.05) and pain interference (1.79 ± 1.10 MAD p = 0.03, q = 0.05) scores without any adverse events. Pain relief significantly correlated with frontal theta modulation. These findings highlight the potential of BCI-mediated cortico-sensory coupling of frontal theta with vibrotactile stimulation for alleviating chronic pain.


Conflict of interest statement

The study was supported, in part, by start-up funding from Washington University Department of Anesthesiology to Simon Haroutounian. This work was also supported by the National Institutes of Health (NIH) grants R01-EB026439, U24-NS109103, P41-EB018783, and Fondazione Neurone. Simon Haroutounian has received in the past 36 months research grants and contracts from the US National Institutes of Health, US Department of Defense, Patient-Centered Outcomes Research Institute and Eli Lilly, and personal fees from Vertex Pharmaceuticals, Rafa Laboratories and GW Pharma, outside the scope of submitted work. Eric Leuthardt has stock ownership in Neurolutions, Osteovantage, Face to Face Biometrics, Caeli Vascular, Acera, Sora Neuroscience, Inner Cosmos, Kinetrix, NeuroDev, Inflexion Vascular, Aurenar, and Petal Surgical. He is a consultant for E15, Neurolutions, Inc., and Petal Surgical. Washington University owns equity in Neurolutions. All other authors do not report any conflicts of interest.

Figures

Figure 1
Figure 1
Schematic and description of BCI system. (a) System overview schematic of EEG-driven BCI system consisting of EEG signals as input and dual visual and vibrotactile sensory feedback. Electrophysiological activity is recorded using a 24-channel dry EEG headset connected to a PC laptop via Bluetooth. The PC uses BCI2000 for real-time signal processing (i.e., extrapolating frontal midline θ power changes) and command execution (i.e., initiating visual and tactile feedback in response to changes in frontal θ power). Visual feedback was delivered on an external monitor, and tactile feedback was delivered using the custom HVSA. (b) System set up with BCI system with vibrotactile feedback system enclosing the affected hand. (c) Overview of electrode configuration (Top-left) and vibrotactile neurofeedback. Increased F3 θ modulation (teal) during relevant phases of BCI therapy leads to vibrotactile feedback of the affected area (green). No modulation of θ or decreased modulation of θ leads to no vibrotactile feedback (red).
Figure 2
Figure 2
Overview of BCI therapy. (a) Overall treatment timeline. Solid black shapes indicate the main therapy sections. White shapes indicate specific breakdowns of each main section. (b) Overview of a single BCI trial. The teal box shows the numerical stimulus used in early BCI sessions to induce θ modulation. “Start” and “Stop” cues are indicated by red arrows. Cursor movement is indicated by the orange dotted arrow. Trial states progress from left to right. θ modulation direction leads to movement of the cursor during neurofeedback. The neurofeedback period was the only period with a variable duration, with 20 s being the maximum duration of the neurofeedback. If the cursor reaches the green target at the top of the screen, several pulses of vibration are delivered to the affected area over the duration of the “Stop” cue.
Figure 3
Figure 3
Intervention feasibility. (a) Each patient’s intervention time. Black bars represent the number of weeks each patient underwent BCI training. Gray bars represent the mean number of BCI training days per week. Error bars represent the range of days per week completed. All patients underwent at least 3 days of BCI training per week for 5 weeks. Four of the patients completed 3 days of BCI training every week. One patient completed 3 days of training per week for 5 weeks, then completed 2 days of training on the sixth week (range 2–3, where only two sessions were completed on the sixth week). One patient completed 4–5 days of training per week for 6 weeks (range 4–5). (b) Median BCI performance across all participants across 6 weeks of BCI therapy. The shaded region depicts the median absolute deviation. (c) Violin plots reflecting session duration across all patients each week. The dotted line represents the median session time across all patients each week. There was no significant difference in session duration between weeks (n = 19, 20, 19, 19, 19, 16; Kruskal–Wallis test, df = 5, χ2 = 8.28, p = 0.14). (d) Exemplar power spectral density plots comparing average θ range power during rest and neurofeedback phases of BCI training for patient 1. Shaded regions represent standard error. θ modulation increases over BCI training sessions. The red rectangle indicates frequencies used for BCI real-time signal processing.
Figure 4
Figure 4
Vibrotactile BCI therapy decreases chronic pain symptoms. Individual patient outcomes: (a) PSS (N = 6, Wilcoxon signed-rank, median decrease 1.29 ± 0.25 MAD p = 0.03, q = 0.05) and (b) PIS (N = 6, Wilcoxon signed-rank, median decrease 1.79 ± 1.10 MAD p = 0.03, q = 0.05) significantly decreases after the BCI intervention duration. (c) Median BCI performance and VAS rating for all participants across the BCI therapy intervention duration. Across sessions, BCI performance improves while VAS pain rating decreases. The shaded region depicts the median absolute deviation (MAD). (d) The median baseline θ power over the course of BCI therapy at electrode location F3 across participants with either significant pain reduction or consistent BCI performance over the ROC calculated optimal threshold (n = 4). Topography plots show median θ power across all electrodes during the first week (upper) and fourth week (lower, where baseline F3 θ was highest). Data were z-scored to baseline θ power, with shaded regions representing MAD.
Figure 5
Figure 5
Differential θ modulation before and after BCI control. Top and Center: Patient normalized θ power during sessions with performance above optimal threshold (solid line) and first-day sessions below optimal performance threshold (dashed line). The optimal threshold was determined using ROC analysis to estimate the performance cutoff for BCI sessions with the greatest likelihood of significant θ modulation during neurofeedback. Black dashed lines indicate the onset of the start cue and neurofeedback spans. Orange shading indicates p values at durations without standard error overlap. Light orange shows duration without overlap between traces (500 ms window, n = 60, p = 0.006). Dark orange indicates durations of statistically significant differences between time traces (500 ms window, n = 60, Wilcoxon rank sum test, p < 0.0005, Bonferroni Corrected). The line shows averaged power values across each within-subject average, with the shaded region showing average standard error. Bottom: Topography of the normalized θ power during baseline and peak normalized θ during neurofeedback before and after BCI control. Theta power increases are localized to frontal channels during high BCI performance.
Figure 6
Figure 6
The relationship between θ modulation, BCI performance, and pain relief. (a) Top: Distribution of all BCI sessions binned by performance. Blue shaded bars represent sessions where participants significantly increased their θ power during the neurofeedback period relative to the pre-intervention baseline (Rank-Biserial Spearman’s Correlation, cyan: p < 0.05 and ρ > 0). The dashed line shows the optimal threshold calculated via ROC analysis. Bottom: ROC curve of the patient performance distribution. AUC of 0.90 and threshold of 0.83 or 83% for optimally classifying sessions with significant θ modulation. (b,c) θ modulation correlates with BCI performance as well as pain relief. (b) Relationship between BCI performance and θ modulation (n = 106, Spearman’s ρ = 0.67, p < 0.001) across all subjects and sessions. (c) Relationship between pain relief (percent pre-intervention baseline) and θ modulation (n = 106, Spearman’s ρ = 0.32, p = 0.001, Bonferroni Corrected alpha = 0.005) across all subjects and sessions.

Similar articles

Cited by

References

    1. Hylands-White N, Duarte RV, Raphael JH. An overview of treatment approaches for chronic pain management. Rheumatol. Int. 2017;37:29–42. doi: 10.1007/s00296-016-3481-8. - DOI - PubMed
    1. Finnerup NB, et al. Neuropathic pain clinical trials: Factors associated with decreases in estimated drug efficacy. Pain. 2018;159:2339–2346. doi: 10.1097/j.pain.0000000000001340. - DOI - PMC - PubMed
    1. Vowles KE, et al. Rates of opioid misuse, abuse, and addiction in chronic pain: A systematic review and data synthesis. Pain. 2015;156:569–576. doi: 10.1097/01.j.pain.0000460357.01998.f1. - DOI - PubMed
    1. Ballantyne JC. Opioids for the treatment of chronic pain: Mistakes made, lessons learned, and future directions. Anesth. Analg. 2017;125:1769–1778. doi: 10.1213/ANE.0000000000002500. - DOI - PubMed
    1. Frizon LA, et al. Deep brain stimulation for pain in the modern era: A systematic review. Neurosurgery. 2020;86:191–202. doi: 10.1093/neuros/nyy552. - DOI - PubMed