

Establishing RTS,S/AS01 as a benchmark for comparison to next-generation malaria vaccines in a mouse model
- PMID: 38341502
- PMCID: PMC10858969
- DOI: 10.1038/s41541-024-00819-x
Establishing RTS,S/AS01 as a benchmark for comparison to next-generation malaria vaccines in a mouse model
Abstract
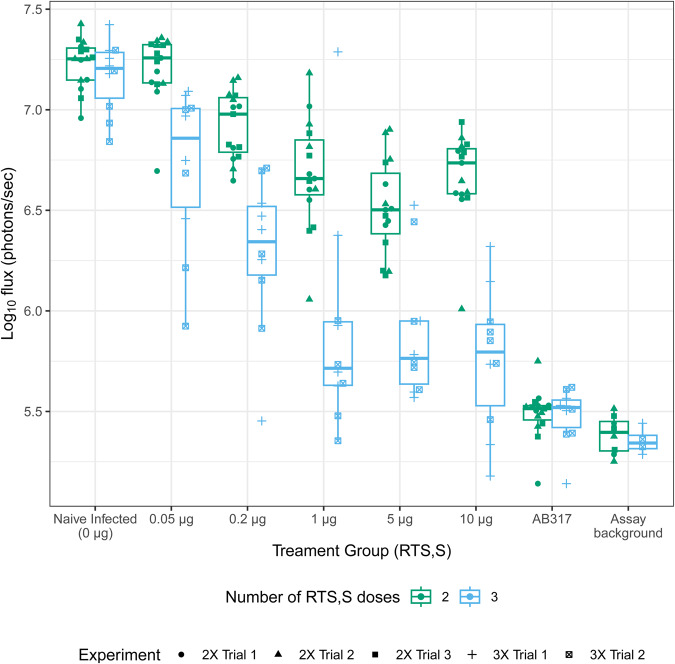
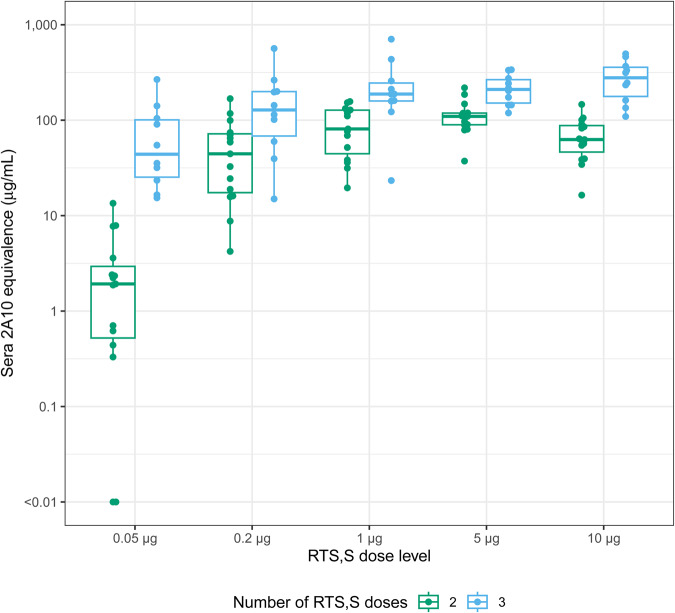
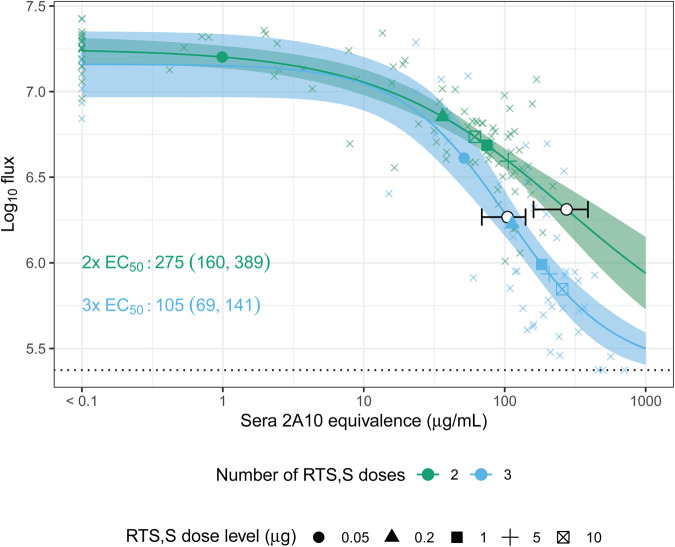
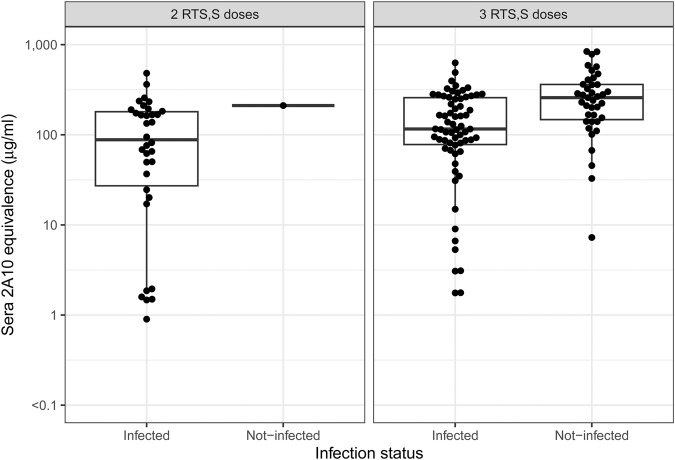
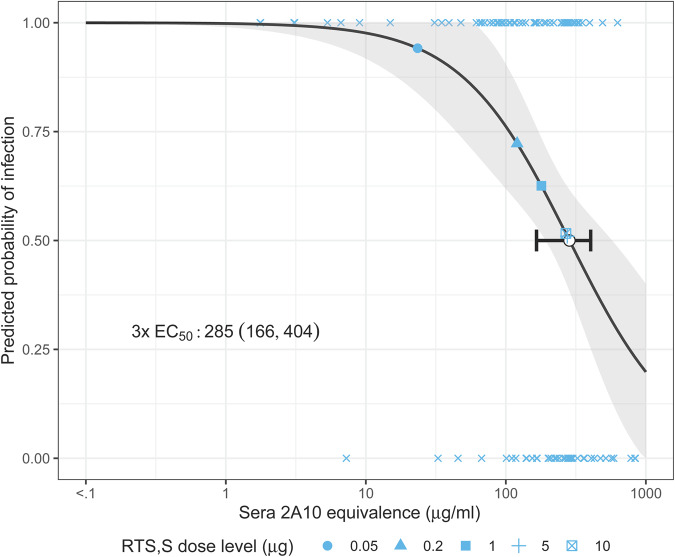
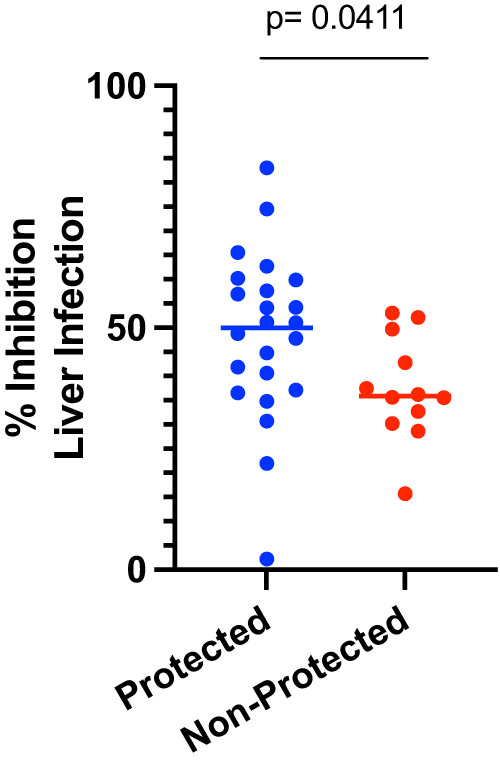
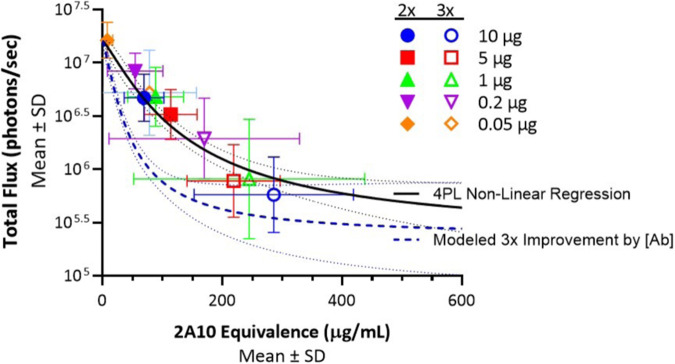
New strategies are needed to reduce the incidence of malaria, and promising approaches include vaccines targeting the circumsporozoite protein (CSP). To improve upon the malaria vaccine, RTS,S/AS01, it is essential to standardize preclinical assays to measure the potency of next-generation vaccines against this benchmark. We focus on RTS,S/AS01-induced antibody responses and functional activity in conjunction with robust statistical analyses. Transgenic Plasmodium berghei sporozoites containing full-length P. falciparum CSP (tgPb-PfCSP) allow two assessments of efficacy: quantitative reduction in liver infection following intravenous challenge, and sterile protection from mosquito bite challenge. Two or three doses of RTS,S/AS01 were given intramuscularly at 3-week intervals, with challenge 2-weeks after the last vaccination. Minimal inter- and intra-assay variability indicates the reproducibility of the methods. Importantly, the range of this model is suitable for screening more potent vaccines. Levels of induced anti-CSP antibody 2A10 equivalency were also associated with activity: 105 μg/mL (95% CI: 68.8, 141) reduced liver infection by 50%, whereas 285 μg/mL (95% CI: 166, 404) is required for 50% sterile protection from mosquito bite challenge. Additionally, the liver burden model was able to differentiate between protected and non-protected human plasma samples from a controlled human malaria infection study, supporting these models' relevance and predictive capability. Comparison in animal models of CSP-based vaccine candidates to RTS,S/AS01 is now possible under well controlled conditions. Assessment of the quality of induced antibodies, likely a determinant of durability of protection in humans, should be possible using these methods.
© 2024. The Author(s).
Conflict of interest statement
The authors declare no competing interests.
Figures
Similar articles
-
A monoclonal antibody-based immunoassay to measure the antibody response against the repeat region of the circumsporozoite protein of Plasmodium falciparum.Malar J. 2016 Nov 8;15(1):543. doi: 10.1186/s12936-016-1596-8. Malar J. 2016. PMID: 27825382 Free PMC article. Clinical Trial.
-
Protective antibody threshold of RTS,S/AS01 malaria vaccine correlates antigen and adjuvant dose in mouse model.NPJ Vaccines. 2023 Aug 10;8(1):114. doi: 10.1038/s41541-023-00714-x. NPJ Vaccines. 2023. PMID: 37563255 Free PMC article.
-
Vaccine-induced monoclonal antibodies targeting circumsporozoite protein prevent Plasmodium falciparum infection.J Clin Invest. 2014 Jan;124(1):140-4. doi: 10.1172/JCI70349. J Clin Invest. 2014. PMID: 24292709 Free PMC article.
-
Humoral Immune Responses to P. falciparum Circumsporozoite Protein (Pfcsp) Induced by the RTS, S Vaccine - Current Update.Infect Drug Resist. 2023 Apr 12;16:2147-2157. doi: 10.2147/IDR.S401247. eCollection 2023. Infect Drug Resist. 2023. PMID: 37077252 Free PMC article. Review.
-
Towards Eradication of Malaria: Is the WHO's RTS,S/AS01 Vaccination Effective Enough?Risk Manag Healthc Policy. 2021 Mar 12;14:1033-1039. doi: 10.2147/RMHP.S219294. eCollection 2021. Risk Manag Healthc Policy. 2021. PMID: 33737844 Free PMC article. Review.
Cited by
-
iDC-targeting PfCSP mRNA vaccine confers superior protection against Plasmodium compared to conventional mRNA.NPJ Vaccines. 2025 Feb 19;10(1):34. doi: 10.1038/s41541-025-01089-x. NPJ Vaccines. 2025. PMID: 39971939 Free PMC article.
-
A Head-to-Head Comparative Study of the Replication-Competent Vaccinia Virus and AAV1-Based Malaria Vaccine versus RTS,S/AS01 in Murine Models.Vaccines (Basel). 2024 Oct 10;12(10):1155. doi: 10.3390/vaccines12101155. Vaccines (Basel). 2024. PMID: 39460322 Free PMC article.
-
Virus-like particle vaccines targeting a key epitope in circumsporozoite protein provide sterilizing immunity against malaria.bioRxiv [Preprint]. 2025 May 30:2025.03.03.641239. doi: 10.1101/2025.03.03.641239. bioRxiv. 2025. Update in: NPJ Vaccines. 2025 Jul 30;10(1):176. doi: 10.1038/s41541-025-01241-7. PMID: 40463147 Free PMC article. Updated. Preprint.
-
Emerging Molecular Mechanisms in Malaria Pathogenesis and Novel Therapeutic Approaches: A Focus on P. falciparum Malaria.Biomolecules. 2025 Jul 17;15(7):1038. doi: 10.3390/biom15071038. Biomolecules. 2025. PMID: 40723909 Free PMC article. Review.
-
Virus-like particle vaccines targeting a key epitope in circumsporozoite protein provide sterilizing immunity against malaria.NPJ Vaccines. 2025 Jul 30;10(1):176. doi: 10.1038/s41541-025-01241-7. NPJ Vaccines. 2025. PMID: 40738902 Free PMC article.
References
-
- WHO. World Malaria Report (WHO, 2023).
-
- WHO. WHO Recommends Groundbreaking Malaria Vaccine for Children at Risk. https://www.who.int/news/item/06-10-2021-who-recommends-groundbreaking-m... (2021).
Grants and funding
- INV-001763/GATES/Bill & Melinda Gates Foundation/United States
- INV-007217/GATES/Bill & Melinda Gates Foundation/United States
- INV-027499/GATES/Bill & Melinda Gates Foundation/United States
- INV-007217/GATES/Bill & Melinda Gates Foundation/United States
- INV-027499/GATES/Bill & Melinda Gates Foundation/United States
LinkOut - more resources
Full Text Sources
