. 2024 Mar:94:102860.
doi: 10.1016/j.jhealeco.2024.102860. Epub 2024 Feb 2.

Estimating the effects of tobacco-21 on youth tobacco use and sales

Affiliations

Estimating the effects of tobacco-21 on youth tobacco use and sales

Rahi Abouk et al. J Health Econ. 2024 Mar.

Erratum in

Expression of concern in

Abstract

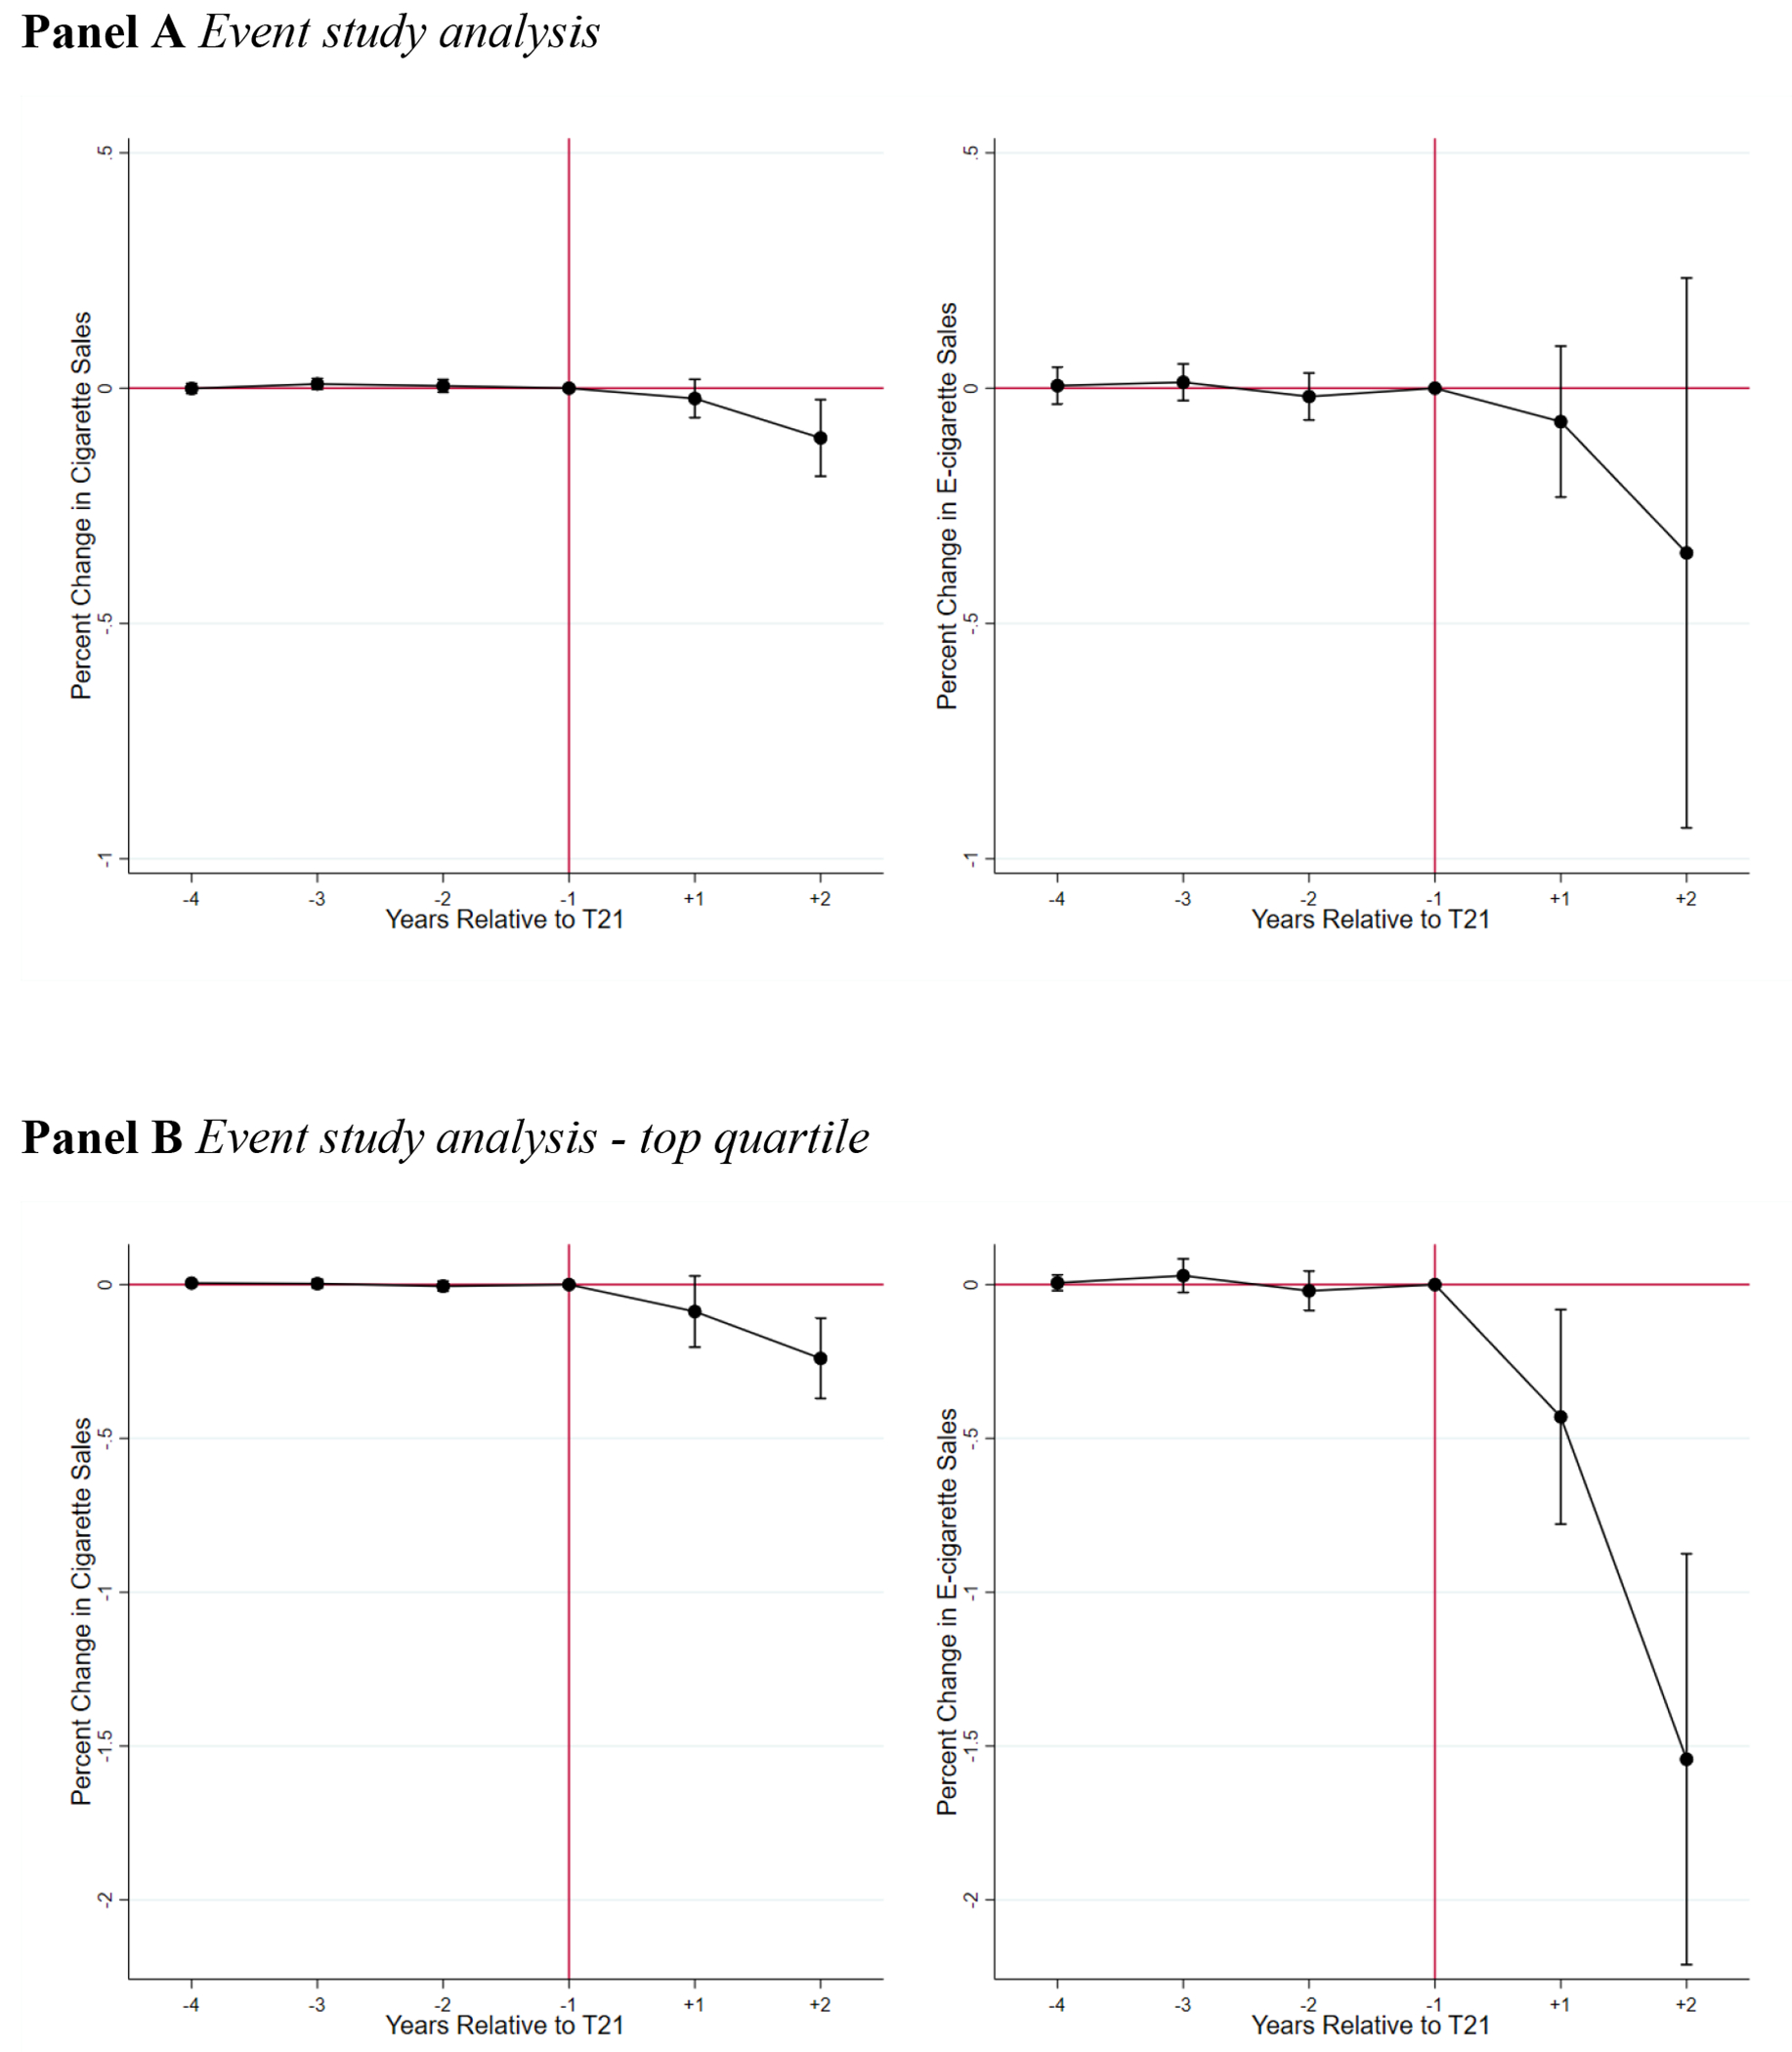
We examine the effect of raising the minimum legal sale age of tobacco to 21 (i.e., "T21"). We estimate difference-in-differences models using the Monitoring the Future (MTF) survey data and Nielsen Retail Scanner data from 2012 to 2019. Outcomes include cigarette and e-cigarette use and sales. We find sizable reductions in e-cigarette and cigarette use for 12th graders. T21 also reduced cigarette sales by 12.4 % and e-cigarette sales by 69.3 % in counties with the highest percent quartile of individuals under 21 years of age. In terms of mechanisms, we find that T21 increases ID checking and perceived risks of using both products.

Keywords: Tobacco 21; Youth tobacco use.


Figures

Figure A1.
Figure A1.. Event study of the effect of T21 on cigarette use past month Sun and Abraham (2021)
Notes: Each graph plots event study coefficients using the approach proposed by Sun and Abraham (2021). Regressions are weighted by MTF sampling weight and standard errors are clustered at the state level. In each of the diagrams, the estimated changes are presented on the vertical axis, and years relative to the implementation of T21 are presented on the horizontal axis. Capped spikes illustrate the 95% confidence intervals. The estimated coefficient for the year before the implementation of T21 is normalized to zero.
Figure A2.
Figure A2.. Event study of the effect of T21 on e-cigarette use past month Sun and Abraham (2021)
Notes: Each graph plots event study coefficients using the approach proposed by Sun and Abraham (2021). Regressions are weighted by MTF sampling weight and standard errors are clustered at the state level. In each of the diagrams, the estimated changes are presented on the vertical axis, and years relative to the implementation of T21 are presented on the horizontal axis. Capped spikes illustrate the 95% confidence intervals. The estimated coefficient for the year before the implementation of T21 is normalized to zero.
Figure A3.
Figure A3.. Event study of the effect of T21 on cigarette use past month among 12th graders, MTF 2010-2019
Notes: Each graph plots event study coefficients using a two-stage DID model (Gardner 2021). Regressions are weighted by MTF sampling weight and standard errors are clustered at the state level. In each of the diagrams, the estimated changes are presented on the vertical axis, and years relative to the implementation of T21 are presented on the horizontal axis. Capped spikes illustrate the 95% confidence intervals. The estimated coefficient for the year before the implementation of T21 is normalized to zero.
Figure A4.
Figure A4.. Event study of the effect of T21 on cigarette and e-cigarette risk perceptions among 12th graders, MTF
Notes: Each graph plots event study coefficients using a two-stage DID model (Gardner 2021). Regressions are weighted by MTF sampling weight and standard errors are clustered at the state level. In each of the diagrams, the estimated changes are presented on the vertical axis, and years relative to the implementation of T21 are presented on the horizontal axis. Capped spikes illustrate the 95% confidence intervals. The estimated coefficient for the year before the implementation of T21 is normalized to zero.
Figure A5.
Figure A5.. Event study of the effect of T21 on the MLSA retailer compliance, 2012-2019 MTF
Notes: Each graph plots event study coefficients using a two-stage DID model (Gardner 2021). Regressions are weighted by MTF sampling weight and standard errors are clustered at the state level. In each of the diagrams, the estimated changes are presented on the vertical axis, and years relative to the implementation of T21 are presented on the horizontal axis. Capped spikes illustrate the 95% confidence intervals. The estimated coefficient for the year before the implementation of T21 is normalized to zero.
Figure 1.
Figure 1.. Event study of the effect of T21 on cigarette use past 30 days
Notes: Each graph plots event study coefficients using a two-stage DID model (Gardner 2021). Regressions are weighted by MTF sampling weight and standard errors are clustered at the state level. In each of the diagrams, the estimated changes are presented on the vertical axis, and years relative to the implementation of T21 are presented on the horizontal axis. Capped spikes illustrate the 95% confidence intervals. The estimated coefficient for the year before the implementation of T21 is normalized to zero.
Figure 2.
Figure 2.. Event study of the effect of T21 on e-cigarette use past 30 days
Notes: Each graph plots event study coefficients using a two-stage DID model (Gardner 2021). Regressions are weighted by MTF sampling weight and standard errors are clustered at the state level. In each of the diagrams, the estimated changes are presented on the vertical axis, and years relative to the implementation of T21 are presented on the horizontal axis. Capped spikes illustrate the 95% confidence intervals. The estimated coefficient for the year before the implementation of T21 is normalized to zero.
Figure 3.
Figure 3.. Effect of T21 on cigarette and e-cigarette use past month by age
Notes: Each coefficient is the estimated effect of T21 on cigarette use (Panel A) and e-cigarette use (Panel B) for the reported age using pooled 8th/10th and 12th graders and a two-stage DID model (Gardner 2021). Regressions are weighted by MTF sampling weight and standard errors are clustered at the state level. Capped spikes illustrate the 95% confidence intervals.
Figure 4.
Figure 4.. Nielsen Retail Scanner Data analysis
Notes: Each graph plots event study coefficients using two-stage DID model (Gardner 2021). Regressions are weighted by MTF sampling weight and standard errors are clustered at the state level. In each of the diagrams, the estimated changes are presented on the vertical axis, and years relative to the implementation of T21 are presented on the horizontal axis. Capped spikes illustrate the 95% confidence intervals. The estimated coefficient for the year before the implementation of T21 is normalized to zero.

References

    1. Abouk R, & Adams S (2017a). Compliance inspections of tobacco retailers and youth smoking. American Journal of Health Economics, 3(1), 10–32.
    1. Abouk R, & Adams S (2017b). Bans on electronic cigarette sales to minors and smoking among high school students. Journal of Health Economics, 54, 17–24. - PubMed
    1. Abouk R, Courtemanche C, Dave D, Feng B, Friedman AS, Maclean JC, … & Safford S (2022). Intended and unintended effects of e-cigarette taxes on youth tobacco use. Journal of Health Economics, 102720. - PMC - PubMed
    1. Ali FRM, Rice K, Fang X, & Xu X (2020). Tobacco 21 policies in California and Hawaii and sales of cigarette packs: a difference-in-differences analysis. Tobacco control, 29(5), 588–592. - PubMed
    1. Allcott H, & Rafkin C (2021). Optimal regulation of e-cigarettes: Theory and evidence (No. w27000). American Economic Journal: Economic Policy (forthcoming).

LinkOut - more resources