

Geodiversity data for Europe
- PMID: 38342206
- PMCID: PMC10859234
- DOI: 10.1098/rsta.2023.0173
Geodiversity data for Europe
Abstract
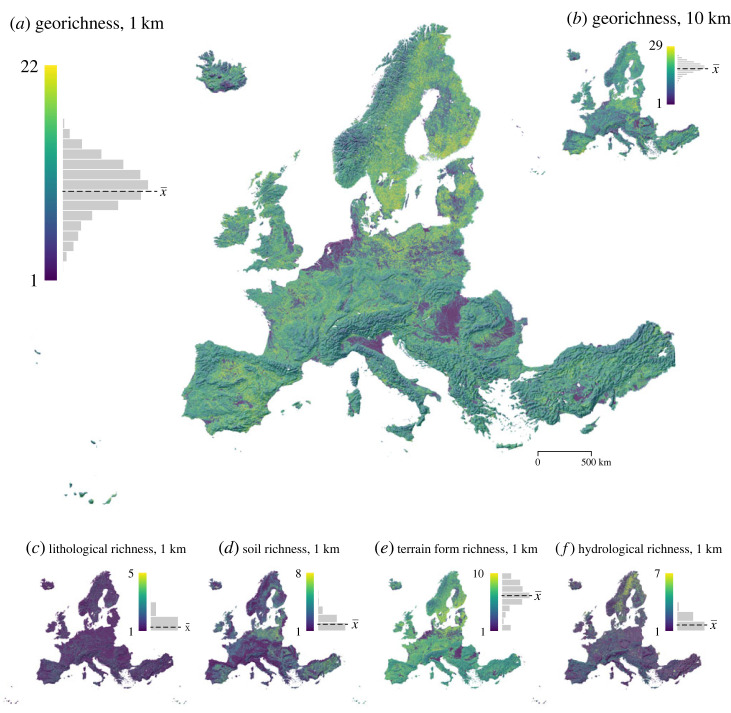
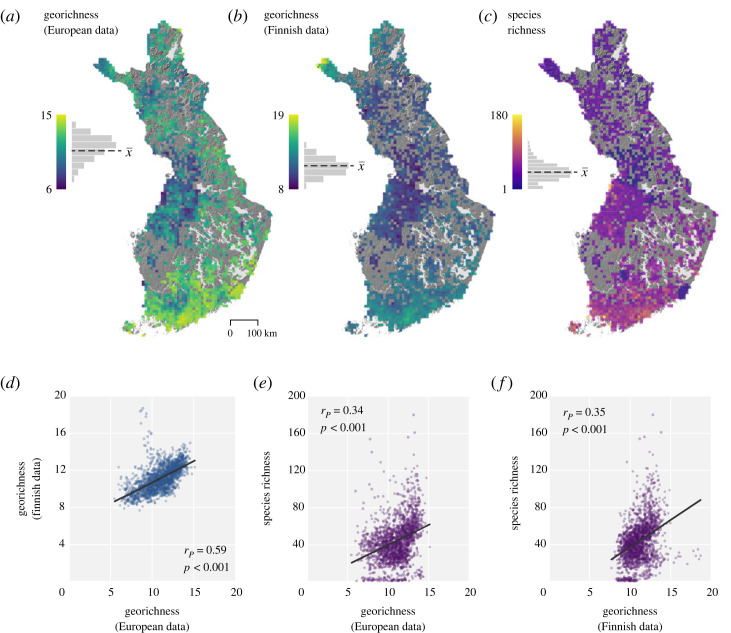
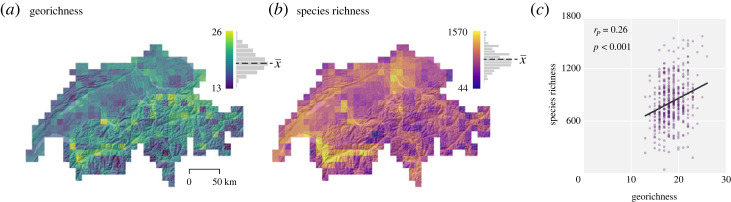
Geodiversity is an essential part of nature's diversity. However, geodiversity is insufficiently understood in terms of its spatial distribution and its relationship to biodiversity over large spatial extents. Here, we present European geodiversity data at resolutions of 1 km and 10 km. We assess terrestrial geodiversity quantitatively as a richness variable (georichness) using a commonly employed grid-based approach. The data incorporate aspects of geological, pedological, geomorphological and hydrological diversity, which are also available as separate richness variables. To evaluate the data, we correlated European georichness with empirically tested national georichness data from Finland, revealing a positive correlation at both 1 km (rp = 0.37, p < 0.001) and 10 km (rp = 0.59, p < 0.001) resolutions. We also demonstrate potential uses of the European data by correlating georichness with vascular plant species richness in two contrasting example areas: Finland and Switzerland. The positive correlations between georichness and species richness in Finland (rp = 0.34, p < 0.001) and Switzerland (rp = 0.26, p < 0.001) further support the use of our data in geodiversity-biodiversity research. Moreover, there is great potential beyond geodiversity-biodiversity questions, as the data can be exploited across different regions, ecosystems and scales. These geodiversity data provide an insight on abiotic diversity in Europe and establish a quantitative large-scale geodiversity assessment method applicable worldwide. This article is part of the Theo Murphy meeting issue 'Geodiversity for science and society'.
Keywords: biodiversity; geological diversity; geomorphological diversity; georichness; hydrological diversity; pedological diversity.
Conflict of interest statement
Authors have no competing interests. Professional relationships with the Guest Editors are as follows: Hjort has joint publication(s) with the Guest Editors (J.J.B., R.F., F.S. and D.R.). Toivanen, Maliniemi, Hjort, Salminen, Kemppinen, Alahuhta and Tukiainen have joint publication(s) or manuscript(s) under consideration with the Guest Editors (J.J.B., R.F. and F.S.).
Figures

References
-
- Gray M. 2013. Geodiversity: valuing and conserving abiotic nature. Chichester, UK: Wiley-Blackwell.
-
- Gray M. 2022. Some observations and reflections on geodiversity, the oft-forgotten half of nature. Geol. Soc. Special Publ. 530, 13-29. (10.1144/SP530-2022-100) - DOI
-
- Gordon JEBailey JJ, Larwood JG. 2022. Conserving nature's stage provides a foundation for safeguarding both geodiversity and biodiversity in protected and conserved areas. In Parks stewardship forum, vol. 38. (10.5070/P538156118) - DOI
-
- Tukiainen H, Toivanen M, Maliniemi T. 2022. Geodiversity and biodiversity. Geol. Soc. Special Publ. 530, 31-47. (10.1144/SP530-2022-107) - DOI
-
- Wolniewicz P. 2023. Quantifying geodiversity at the continental scale: limitations and prospects. Resources 12, 59. (10.3390/resources12050059). MDPI AG. - DOI
MeSH terms
LinkOut - more resources
Full Text Sources
