. 2024 Apr;382(2269):20230057.
doi: 10.1098/rsta.2023.0057. Epub 2024 Feb 12.

The influence of scale-dependent geodiversity on species distribution models in a biodiversity hotspot

Affiliations

The influence of scale-dependent geodiversity on species distribution models in a biodiversity hotspot

Beth E Gerstner et al. Philos Trans A Math Phys Eng Sci. 2024 Apr.

Abstract

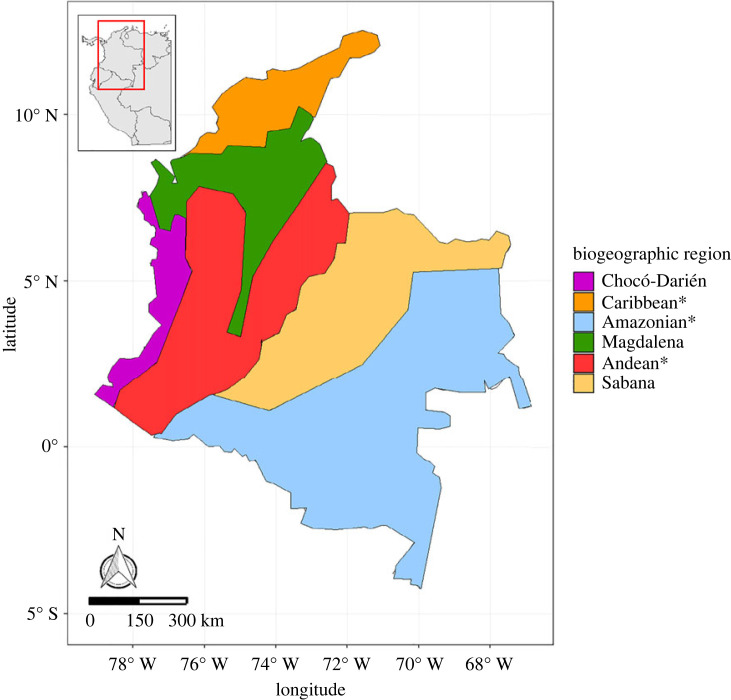
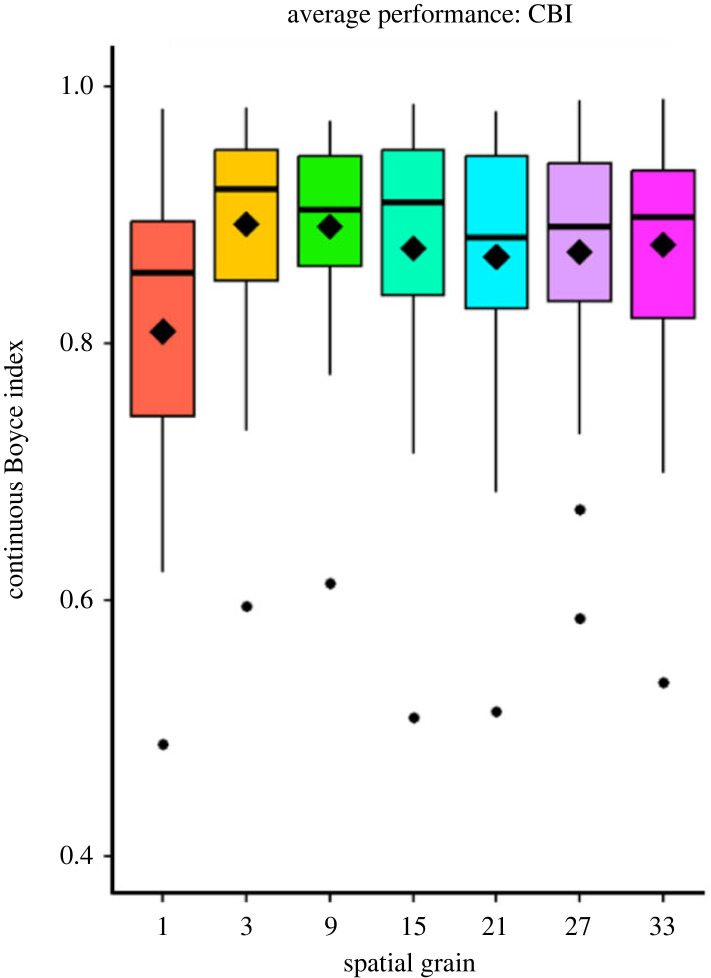
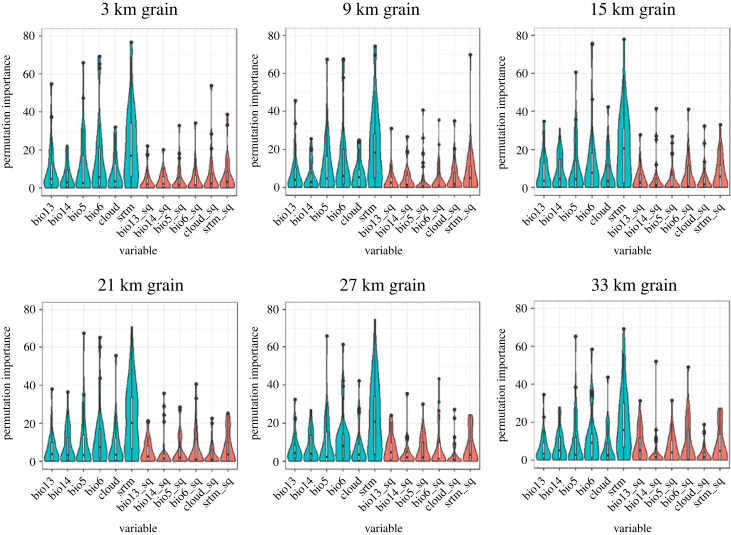
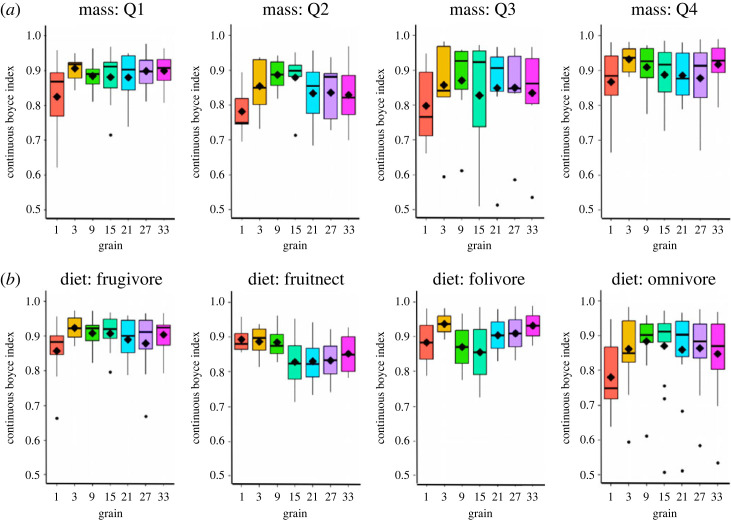
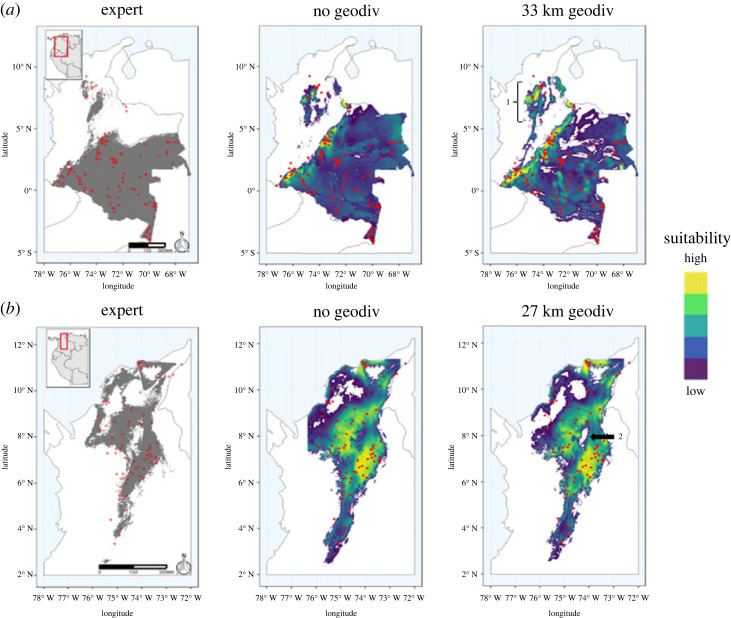
Improving models of species' distributions is essential for conservation, especially in light of global change. Species distribution models (SDMs) often rely on mean environmental conditions, yet species distributions are also a function of environmental heterogeneity and filtering acting at multiple spatial scales. Geodiversity, which we define as the variation of abiotic features and processes of Earth's entire geosphere (inclusive of climate), has potential to improve SDMs and conservation assessments, as they capture multiple abiotic dimensions of species niches, however they have not been sufficiently tested in SDMs. We tested a range of geodiversity variables computed at varying scales using climate and elevation data. We compared predictive performance of MaxEnt SDMs generated using CHELSA bioclimatic variables to those also including geodiversity variables for 31 mammalian species in Colombia. Results show the spatial grain of geodiversity variables affects SDM performance. Some variables consistently exhibited an increasing or decreasing trend in variable importance with spatial grain, showing slight scale-dependence and indicating that some geodiversity variables are more relevant at particular scales for some species. Incorporating geodiversity variables into SDMs, and doing so at the appropriate spatial scales, enhances the ability to model species-environment relationships, thereby contributing to the conservation and management of biodiversity. This article is part of the Theo Murphy meeting issue 'Geodiversity for science and society'.

Keywords: Colombia; geodiversity; mammal conservation; spatial heterogeneity; species distribution models.


Conflict of interest statement

We declare we have no competing interests.

Figures

Figure 1.
Figure 1.
Major biogeographic regions within Colombia based on regions defined in [46]. Fine-scale details have been simplified for clarity, while still depicting the main biogeographic regions. Region names denoted with (*) have been modified from the original publication to ensure easier recognition and understanding. (Online version in colour.)
Figure 2.
Figure 2.
The average continuous Boyce index (CBI), represented by a diamond, reflects the mean value, while the upper and lower whiskers depict the range of observations within 1.5 times the interquartile range (IQR) above the upper hinge or below the lower hinge. This provides an overview of the variations in model performance across different spatial grains and highlights the impact of incorporating geodiversity variables on the CBI. At every spatial grain greater than 1 km, all models with geodiversity variables increased in CBI when compared with the 1 km non-geodiversity models (Mann–Whitney U tests, p < 0.05). (Online version in colour.)
Figure 3.
Figure 3.
Permutation importance values (i.e. impact or contribution of individual environmental variables in a MaxEnt) across geodiversity variables calculated at different spatial grains. Blue bars (left) indicate non-geodiversity variables and red (right) indicate geodiversity variables. The shape of each bar represents the density distribution of the permutation importance values for each predictor across all species. (Online version in colour.)
Figure 4.
Figure 4.
Boxplots of model performance for functional groups based on mass and diet preference. The functional groups were defined using quartiles of mass and diet information [50,51]. The analysis reveals varying impacts of spatial grain on model performance within these groups. When considering mass, subtle differences in performance were observed across spatial grains, with Quantile 1 and 4 species showing slight average increases in performance at fine and coarse scales, while Quantile 2 exhibited higher performance at low and intermediate scales and Quantile 3 had higher performance at low scales. In terms of feeding types, more pronounced differences in model performance were found. Folivores demonstrated the highest average performance at both fine and coarse scales, and frugivores had highest average performance at fine to intermediate scales. Fruit/nectar specialists had the highest average performance at fine scales. Omnivores exhibited the highest performance at low to intermediate scales. This figure excludes one nectarivorous species. (Online version in colour.)
Figure 5.
Figure 5.
Comparisons of expert maps and thresholded models made without and with geodiversity variables for two species, the Common woolly monkey (Lagothrix lagotricha) and Grey-handed night monkey (Aotus griseimembra). Lighter shades indicate higher suitability and occurrence records for each species are denoted by red circles. Panel (a) represents the expert map and thresholded models for species L. lagotricha, where there is less suitability in northeastern Colombia in the geodiversity model than the model without geodiversity and aligns better with the expert map. Predictions in the northernmost part of the species range in the geodiversity model (label 1) better capture the occurrence records than both the expert map and the non-geodiversity model. Panel (b) represents the expert maps and models for A. griseimembra. Both the non-geodiversity and geodiversity models capture the occurrence records better than the expert model; however, the non-geodiversity model predicts suitability in high elevation areas whereas the geodiversity model does not (label 2), the latter being more closely aligned to the species’ ecology as a lowland primate. (Online version in colour.)

Similar articles

  • Models of upland species' distributions are improved by accounting for geodiversity.
    Bailey JJ, Boyd DS, Field R. Bailey JJ, et al. Landsc Ecol. 2018;33(12):2071-2087. doi: 10.1007/s10980-018-0723-z. Epub 2018 Oct 28. Landsc Ecol. 2018. PMID: 30930538 Free PMC article.
  • Geodiversity data for Europe.
    Toivanen M, Maliniemi T, Hjort J, Salminen H, Ala-Hulkko T, Kemppinen J, Karjalainen O, Poturalska A, Kiilunen P, Snåre H, Leppiniemi O, Makopoulou E, Alahuhta J, Tukiainen H. Toivanen M, et al. Philos Trans A Math Phys Eng Sci. 2024 Apr;382(2269):20230173. doi: 10.1098/rsta.2023.0173. Epub 2024 Feb 12. Philos Trans A Math Phys Eng Sci. 2024. PMID: 38342206 Free PMC article.
  • Why geodiversity matters in valuing nature's stage.
    Hjort J, Gordon JE, Gray M, Hunter ML Jr. Hjort J, et al. Conserv Biol. 2015 Jun;29(3):630-9. doi: 10.1111/cobi.12510. Epub 2015 Apr 28. Conserv Biol. 2015. PMID: 25923307
  • The status and future of essential geodiversity variables.
    Schrodt F, Vernham G, Bailey J, Field R, Gordon JE, Gray M, Hjort J, Hoorn C, Hunter ML Jr, Larwood J, Lausch A, Monge-Ganuzas M, Miller S, van Ree D, Seijmonsbergen AC, Zarnetske PL, Daniel Kissling W. Schrodt F, et al. Philos Trans A Math Phys Eng Sci. 2024 Apr;382(2269):20230052. doi: 10.1098/rsta.2023.0052. Epub 2024 Feb 12. Philos Trans A Math Phys Eng Sci. 2024. PMID: 38342208 Free PMC article. Review.
  • Monitoring vegetation- and geodiversity with remote sensing and traits.
    Lausch A, Selsam P, Pause M, Bumberger J. Lausch A, et al. Philos Trans A Math Phys Eng Sci. 2024 Apr;382(2269):20230058. doi: 10.1098/rsta.2023.0058. Epub 2024 Feb 12. Philos Trans A Math Phys Eng Sci. 2024. PMID: 38342219 Free PMC article. Review.

Cited by

References

    1. Parks KE, Mulligan M. 2010. On the relationship between a resource based measure of geodiversity and broad scale biodiversity patterns. Biodivers. Conserv. 19, 2751-2766. (10.1007/s10531-010-9876-z) - DOI
    1. Lawler JJ et al. 2015. The theory behind, and the challenges of, conserving nature's stage in a time of rapid change. Conserv. Biol. 29, 618-629. (10.1111/cobi.12505) - DOI - PubMed
    1. Zarnetske PL et al. 2019. Towards connecting biodiversity and geodiversity across scales with satellite remote sensing. Glob. Ecol. Biogeogr. 28, 548-556. (10.1111/geb.12887) - DOI - PMC - PubMed
    1. Benito-Calvo A, Pérez-González A, Magri O, Meza P. 2009. Assessing regional geodiversity: the Iberian Peninsula. Earth Surf. Process. Landf. 34, 1433-1445. (10.1002/esp.1840) - DOI
    1. Record S et al. 2020. Remote sensing of geodiversity as a link to biodiversity. In Remote sensing of plant biodiversity (eds Cavender-Bares J, Gamon JA, Townsend PA), pp. 225-253. Cham: Springer International Publishing. (10.1007/978-3-030-33157-3_10) - DOI