. 2024 Apr;11(15):e2305316.
doi: 10.1002/advs.202305316. Epub 2024 Feb 11.

A Dual-domain Engineered Antibody for Efficient HBV Suppression and Immune Responses Restoration

Affiliations

A Dual-domain Engineered Antibody for Efficient HBV Suppression and Immune Responses Restoration

Yichao Jiang et al. Adv Sci (Weinh). 2024 Apr.

Abstract

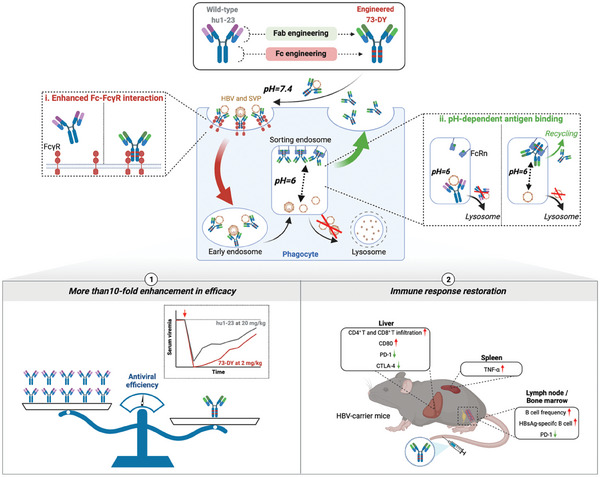
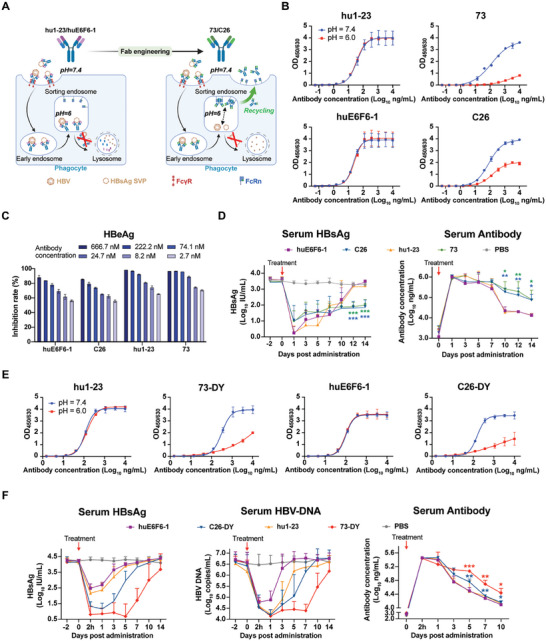
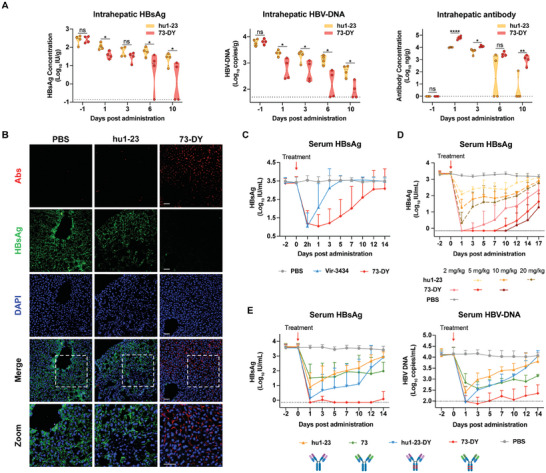
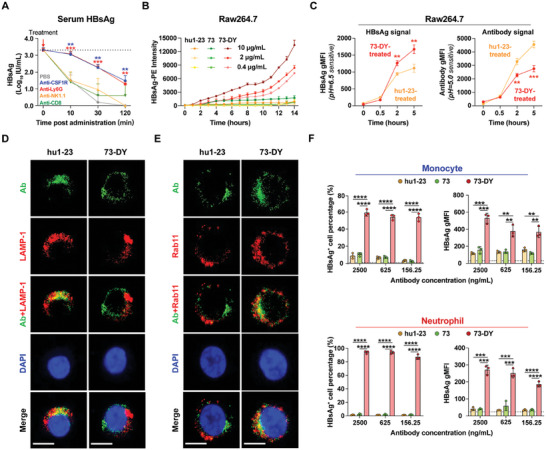
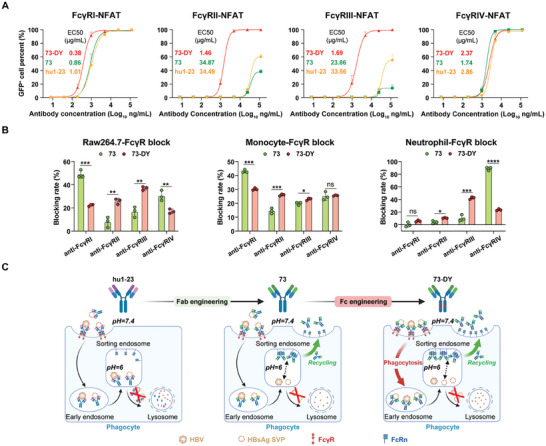
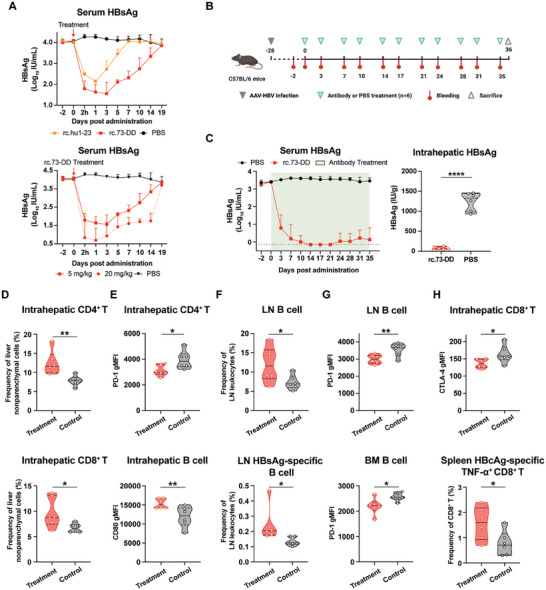
Chronic hepatitis B (CHB) remains a major public health concern because of the inefficiency of currently approved therapies in clearing the hepatitis B surface antigen (HBsAg). Antibody-based regimens have demonstrated potency regarding virus neutralization and HBsAg clearance. However, high dosages or frequent dosing are required for virologic control. In this study, a dual-domain-engineered anti-hepatitis B virus (HBV) therapeutic antibody 73-DY is developed that exhibits significantly improved efficacy regarding both serum and intrahepatic viral clearance. In HBV-tolerant mice, administration of a single dose of 73-DY at 2 mg kg-1 is sufficient to reduce serum HBsAg by over 3 log10 IU mL-1 and suppress HBsAg to < 100 IU mL-1 for two weeks, demonstrating a dose-lowering advantage of at least tenfold. Furthermore, 10 mg kg-1 of 73-DY sustainably suppressed serum viral levels to undetectable levels for ≈ 2 weeks. Molecular analyses indicate that the improved efficacy exhibited by 73-DY is attributable to the synergy between fragment antigen binding (Fab) and fragment crystallizable (Fc) engineering, which conferred sustained viral suppression and robust viral eradication, respectively. Long-term immunotherapy with reverse chimeric 73-DY facilitated the restoration of anti-HBV immune responses. This study provides a foundation for the development of next-generation antibody-based CHB therapies.

Keywords: antibody‐based immunotherapy; chronic hepatitis B; immune restoration; therapeutic efficacy.


Conflict of interest statement

The author declares no conflicts of interest.

Figures

Scheme 1
Scheme 1
Design of the dual‐domain engineered anti‐HBV therapeutic antibody. Dual‐domain engineering was applied to the wild‐type anti‐HBV antibody hu1‐23. The engineering modification in the Fc domains enhances the FcγR‐dependent antibody‐mediated phagocytosis of viral particles, which translates into enhanced serum and intrahepatic viral clearance. Additionally, Fab engineering confers pH‐dependent antigen‐binding capability to the antibody, thereby enabling the antibody to dissociate from HBV antigens in acidic sorting endosomes, and facilitating antibody recycling. Consequently, the dual‐domain‐engineered anti‐HBV antibody 73‐DY exhibited higher efficacy in viremia suppression compared to the wild‐type antibody, but at a 10‐fold lower dose, indicating its potential to significantly reduce dosing requirements. Moreover, 73‐DY‐based immunotherapy facilitated the reversal of systemic tolerance in HBV carrier mice. This figure was created with BioRender.com.
Figure 1
Figure 1
Identification and in vivo therapeutic evaluation of anti‐HBV dual‐domain engineered antibodies. A) Schematic representation of the engineering of anti‐HBV recycling antibody with pH‐dependent HBsAg‐binding property. The recycling antibody can capture HBV and its SVPs at neutral plasma (pH = 7.4) while losing antigen binding in the acidic endosomes (pH = 6.0). The dissociated antibody will be rescued by FcRn and recycled back into the plasma for antigen recapture. This figure was created with BioRender.com. B) Binding activities of the antibodies hu1‐23, 73, huE6F6‐1, and C26 against HBsAg under different pH conditions by ELISA analysis (n = 3). The data are expressed as the mean ± SD. C) Neutralization of HBV infection in the hNTCP‐expressing cell line by anti‐HBV antibodies (n = 3). The levels of HBeAg were used to evaluate the HBV neutralization activity of the antibodies. The data were normalized to the virus infection control and expressed as the mean ± SD. D) Serum HBsAg and antibody levels of AAV/HBV mice after treatment with antibodies or PBS (Control). Each group of mice (n = 5) received antibody infusion at a dose of 10 mg kg−1. The data are expressed as the mean ± SD. The serum HBsAg and antibody levels of the 73‐ and C26‐treated groups at day 10, 12, and 14 post‐administration were compared to those of the hu1‐23‐ and huE6F6‐1‐treated groups by a two‐sided Student's t‐test, respectively (*p < 0.05; **p < 0.01; ***p < 0.001). E) Binding activities of the antibodies hu1‐23, 73‐DY, huE6F6‐1, and C26‐DY against HBsAg under different pH conditions by ELISA analysis (n = 3). The data are expressed as the mean ± SD. F) Serum HBsAg, HBV‐DNA, and antibody levels of AAV/HBV mice after treatment with antibody or PBS (Control). Each group of mice (n = 4) received antibody infusion at a dose of 5 mg kg−1. The data are expressed as the mean ± SD. The serum antibody levels of the 73‐DY‐ and C26‐DY‐treated groups at day 5, 7, and 10 post‐administration were compared to those of the hu1‐23‐ and huE6F6‐1‐treated groups by a two‐sided Student's t‐test, respectively (*p < 0.05; **p < 0.01; ***p < 0.001).
Figure 2
Figure 2
In vivo therapeutic efficacy of 73‐DY. A) Cohorts of AAV/HBV mice (n = 4 mice per time point) were injected with hu1‐23 or 73‐DY at a dose of 10 mg kg−1 and euthanized at different time points after treatment. The intrahepatic HBsAg, HBV‐DNA, and antibody levels were quantified. P values were calculated using a two‐sided Student's t‐test (*p < 0.05; **p < 0.01; ****p < 0.0001; “ns” represents not significant). The horizontal dotted lines indicate the lowest detection limits. B) Immunofluorescence staining of HBsAg and antibodies in the liver sections of AAV/HBV mice after 10 mg kg−1 of hu1‐23 or 73‐DY infusion or PBS infusion. Assays were performed 6 days post‐treatment. Antibodies (red) were labeled with DyLight 650‐labeled anti‐human IgG, and HBsAg (green) was labeled with DyLight 488‐labeled 129G1‐Fab recognizing the “second loop” linear epitope of HBsAg, which would not be recognized by hu1‐23 or 73‐DY. Representative images from random fields of view in one of the four biologically independent samples. Scale bars of the merge and zoom views: 40 µm. C) Comparison of the therapeutic efficacies of 73‐DY and Vir‐3434 at a dose of 2 mg kg−1 in AAV/HBV mice (n = 5 mice per group). Serum HBsAg was quantified and the data are expressed as the mean ± SD. D) Serum HBsAg levels of mice (n = 5 mice per group) treated with 73‐DY and hu1‐23 at indicated doses (2, 5, and 10 mg kg−1 for 73‐DY; 5, 10, and 20 mg kg−1 for hu1‐23). The data are expressed as the mean ± SD. The horizontal dotted line indicates the lowest detection limit. E) Serum HBsAg and HBV‐DNA profiles of AAV/HBV mice receiving hu1‐23, hu1‐23‐DY, 73, 73‐DY, or PBS (Control). Each group of mice (n = 5) received antibody infusion at a dose of 10 mg kg−1. The data are expressed as the mean ± SD. The horizontal dotted lines indicate the lowest detection limits.
Figure 3
Figure 3
73‐DY achieved increased antibody recycling through Fab engineering and mediated enhanced cellular phagocytosis of viral pathogens through Fc engineering. A) The roles that different effector immune cells played in 73‐DY‐mediated viral clearance in AAV/HBV mice (n = 5 mice per group). Depletion of monocytes/macrophages (anti‐CSF1R), neutrophils (anti‐Ly6G), NK cells (anti‐NK 1.1), or CD8+ T cells (anti‐CD8α) was performed 1 day before 73‐DY infusion. The serum HBsAg levels were quantified and are expressed as the mean ± SD. The P values were calculated by comparing to the values from the PBS‐treated group using a two‐sided Student's t‐test (**p < 0.01; ***p < 0.001). The dotted line indicates the average level of HBsAg before treatment. B) Dynamic monitoring of antibody‐mediated phagocytosis of HBsAg by Raw264.7 cells with an IncuCyte SX5 Live‐Cell Analysis Instrument (n = 3). HBsAg was labeled with a pH 6.5‐sensitive dye to emit fluorescence once phagocytosed. The fluorescence intensity was calculated using IncuCyte evaluation software, and the data are expressed as the mean ± SD. C) In vitro antibody‐mediated HBsAg phagocytosis in Raw264.7 cells (n = 3). HBsAg was labeled with a pH 6.5‐sensitive dye as described above, and antibodies (hu1‐23 and 73‐DY) were labeled with a pH 5.0‐sensitive dye that only emits deep red fluorescence in lysosomes. Flow cytometry was used to detect the intracellular fluorescence intensity and the gMFI of HBsAg or antibody was calculated respectively. The data are expressed as the mean ± SD. The P values were calculated by comparing to the values from the hu1‐23‐treated group using a two‐sided Student's t‐test (**p < 0.01; ***p < 0.001). (D‐E) Confocal microscopy images of Raw264.7 cells incubated with hu1‐23‐ or 73‐DY‐HBsAg immune complexes to show distribution of antibodies and lysosomes or recycling endosomes. hu1‐23 or 73‐DY was pre‐incubated with recombinant HBsAg for 60 min and then added to Raw264.7 cells for a further 60 min. Cells were washed, fixed, and permeabilized. Antibodies (green) were labeled with DyLight 488‐labeled mouse anti‐human IgG (H+L) secondary antibody. Lysosomes or recycling endosomes (red) were labeled with rabbit anti‐mouse lysosome‐associated membrane protein‐1 (LAMP‐1) D) or rabbit anti‐mouse Rab11 E), respectively, followed by DyLight 568‐labeled donkey anti‐rabbit IgG. The co‐localization between antibodies and lysosomes or recycling endosomes is shown in yellow (overlap of green and red). Representative images from random fields of view in one of the three biologically independent samples. Scale bar: 10 µm. F) hu1‐23, 73, and 73‐DY induced in vitro phagocytosis of HBsAg in primary murine monocytes and neutrophils (n = 3). Cells were evaluated by flow cytometric analysis, and the percentage of HBsAg+ cells and the HBsAg gMFI in these phagocytes were calculated. The horizontal dotted lines indicate the percentages of HBsAg+ cells and the HBsAg gMFI for spontaneous HBsAg phagocytosis in the absence of antibody treatment. The data are expressed as the mean ± SD. The P values were calculated using a two‐sided Student's t‐test (**p < 0.01; ***p < 0.001; ****p < 0.0001).
Figure 4
Figure 4
Increased Fc‐FcγR interactions conferred the enhanced ADCP activity of 73‐DY. A) Identification of antibody‐mediated signaling activation with four genetically modified 2B4 cell lines expressing specific FcγRs with an inducible GFP luciferase reporter gene (n = 3). Fluorescence was analyzed by confocal microscopy, and the percentage of GFP+ cells was calculated by Columbus Analysis system. The data are expressed as the mean ± SD, and a nonlinear regression best‐fit curve was generated for each dataset. EC50 values were calculated by GraphPad Prism (v.9.0). B) Comparison of the reductions in 73‐ and 73‐DY‐mediated ADCP after complete blocking of specific FcγRs (n = 3). The blocking rate was calculated with the following formula: [(gMFI of 73‐DY‐mediated phagocytosis without FcγR blocking – gMFI of 73‐DY‐mediated phagocytosis with indicated FcγR blocking) / (gMFI of 73‐DY‐mediated phagocytosis without FcγR blocking – gMFI of spontaneous phagocytosis without 73‐DY treatment)] × 100%. The data are expressed as the mean ± SD. P values were calculated using a two‐sided Student's t‐test (*p < 0.05; **p < 0.01; “ns” represents not significant). C) Schematic representation of the dual‐domain engineered anti‐HBV antibody, 73‐DY. This antibody exhibits an enhanced capacity to promote phagocytosis of HBV antigens by increasing its interaction with FcγRs. Upon the internalization of antibody‐antigen immune complexes into sorting endosomes with a pH of 6, the antibody dissociates from the antigen and undergoes recycling back to the plasma via binding with FcRn. Meanwhile, the antigen is subjected to degradation within lysosomes. This figure was created with BioRender.com.
Figure 5
Figure 5
The restoration of immune responses in AAV/HBV mice by reverse chimeric 73‐DY‐based immunotherapy. A) Serum HBsAg levels of AAV/HBV mice after antibody or PBS (Control) infusion at the dose of 5 mg kg−1 (n = 5 mice per group). The data are expressed as the mean ± SD. B) Diagram of the experimental procedure. Six mice were used in each group. At each time point of antibody or PBS injection, blood samples were collected in advance. This figure was created with BioRender.com. C) Serum HBsAg levels during the whole course and intrahepatic HBsAg quantification at the end of the treatment period. The data of serum HBsAg are expressed as the mean ± SD. P values in the intrahepatic HBsAg data were calculated using a two‐sided Student's t‐test (****p < 0.0001). The horizontal dotted line indicates the lowest detection limit. (D‐H) Comparison of immune responses between the rc.73‐DD‐treated group and the control group by flow cytometric analysis (n = 6). Data were statistically analyzed by a two‐sided Student's t‐test (*p < 0.05; **p < 0.01). D) Frequencies of T cells in liver nonparenchymal cells. E) PD‐1 expression profiles of intrahepatic CD4+ T cells (the upper row) and CD80 expression profiles of intrahepatic B cells (the lower row). F) B‐cell and HBsAg‐specific B‐cell frequencies in the lymph nodes. G) PD‐1 expression profiles of B cells from the lymph nodes and bone marrow. H) Profiles of CD8+ T‐cell responses. CTLA‐4 expression profiles of intrahepatic CD8+ T cells (the upper row) and the frequencies of HBcAg‐specific TNF‐α secreting CD8+ T cells in the spleens (the lower row).

Similar articles

Cited by

References

    1. Asrani S., Devarbhavi H., Eaton J., Kamath P., J Hepatol 2019, 70, 151. - PubMed
    1. Tang L., Covert E., Wilson E., Kottilil S., JAMA, J. Am. Med. Assoc. 2018, 319, 1802. - PubMed
    1. Wang J., Wu W., Huang T., Wong M., Kwak K., Ozato K., Hung C., Roden R., J. Virol. 2018, 92. - PMC - PubMed
    1. World Health Organization . Hepatitis B. 2023 July 18 [cited 2023 October]; Available from: https://www.who.int/en/news‐room/fact‐sheets/detail/hepatitis‐b.
    1. Jeng W., Papatheodoridis G., Lok A., Lancet 2023, 401, 1039. - PubMed

LinkOut - more resources