. 2024 Apr;11(15):e2304609.
doi: 10.1002/advs.202304609. Epub 2024 Feb 11.

Radiotherapy-Induced Astrocyte Senescence Promotes an Immunosuppressive Microenvironment in Glioblastoma to Facilitate Tumor Regrowth

Affiliations

Radiotherapy-Induced Astrocyte Senescence Promotes an Immunosuppressive Microenvironment in Glioblastoma to Facilitate Tumor Regrowth

Jianxiong Ji et al. Adv Sci (Weinh). 2024 Apr.

Abstract

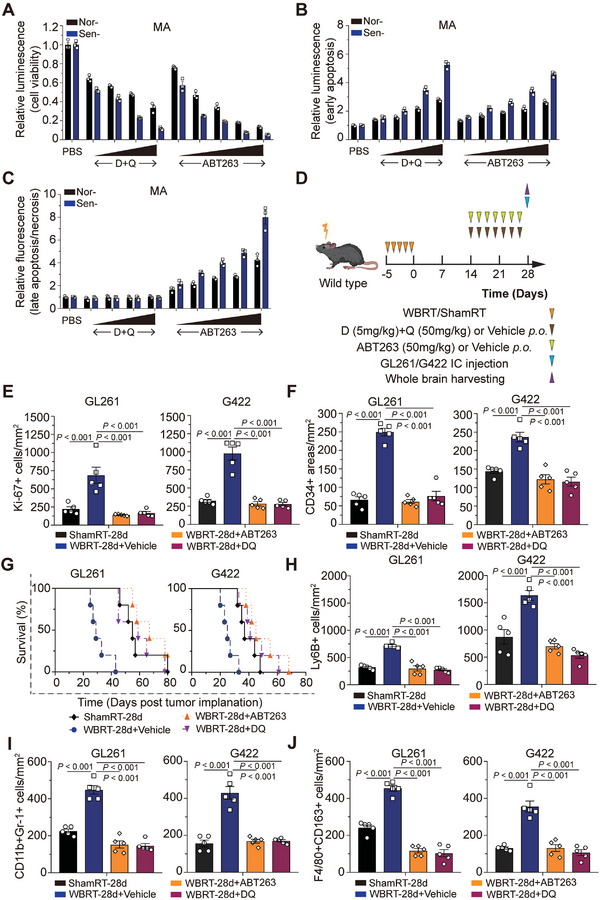
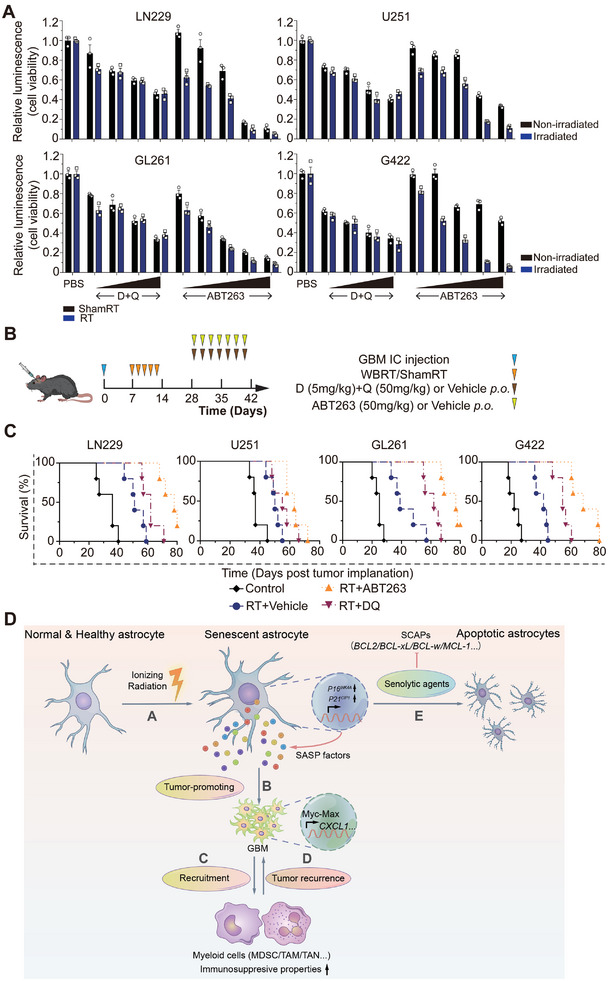
Accumulating evidence suggests that changes in the tumor microenvironment caused by radiotherapy are closely related to the recurrence of glioma. However, the mechanisms by which such radiation-induced changes are involved in tumor regrowth have not yet been fully investigated. In the present study, how cranial irradiation-induced senescence in non-neoplastic brain cells contributes to glioma progression is explored. It is observed that senescent brain cells facilitated tumor regrowth by enhancing the peripheral recruitment of myeloid inflammatory cells in glioblastoma. Further, it is identified that astrocytes are one of the most susceptible senescent populations and that they promoted chemokine secretion in glioma cells via the senescence-associated secretory phenotype. By using senolytic agents after radiotherapy to eliminate these senescent cells substantially prolonged survival time in preclinical models. The findings suggest the tumor-promoting role of senescent astrocytes in the irradiated glioma microenvironment and emphasize the translational relevance of senolytic agents for enhancing the efficacy of radiotherapy in gliomas.

Keywords: Glioma; astrocytes; myeloid inflammatory cells; radiation‐induced senescence; senolytic agents.


Conflict of interest statement

The authors declare no conflict of interest.

Figures

Figure 1
Figure 1
SnCs accumulate in the brain after ionizing radiation (IR) and promote glioma progression. A) Schematic representation of the experimental design. B) Representative immunofluorescence images showing the γH2AX foci (green) in the DAPI‐stained nuclei (blue) of irradiated or mock‐irradiated mouse brains. Brains were harvested and fixed at 2 hours after the final IR. Scale bars, 1000 µm (upper) and 50 µm (lower). C) Kaplan–Meier graphs showing the survival time of irradiated or mock‐irradiated mice with orthotopic implantation of GL261 xenografts at indicated time points after IR (n = 5 per group); log‐rank test. D,E) Representative images (D) and quantification (E) of P16INK4A RNA FISH of mouse brains at indicated time points after IR. Scale bar, 25 µm. F) Representative images and quantification of Ki‐67 immunofluorescence staining of GL261‐ and G422‐derived xenografts. Scale bar, 25 µm. G) Representative images and quantification of CD34 immunofluorescence staining of GL261‐ and G422‐derived xenografts. Scale bar, 75 µm.
Figure 2
Figure 2
Pharmacogenetic approach prolongs the survival time of pre‐irradiated CDKN2A‐DTR mice bearing GL261 cells. A) CDKN2A‐DTR mice were generated by crossing Rosa26‐LSL‐iDTR with CDKN2A‐Luc‐tdTomato‐CreERT2 . Mice were injected tamoxifen for consecutive 5 days at 14 days after the final IR, followed by the administration of diphtheria toxin for another 3 days to selectively eliminate P16INK4A + SnCs. B) Schematic representation of the experimental design. C–E) Representative images (C) and quantification (D,E) of the in vivo bioluminescence imaging of CDKN2A‐DTR mice at the indicated time points after IR. F) Kaplan–Meier graph showing the survival time of pre‐irradiated CDKN2A‐DTR mice bearing GL261 cells (n = 8 per group); log‐rank test. G) Representative images and quantification of Ki‐67 immunofluorescence staining from GL261‐derived xenografts in CDKN2A‐DTR mice. Scale bar, 25 µm. H) Representative images and quantification of CD34 immunofluorescence staining from GL261‐derived xenografts in CDKN2A‐DTR mice. Scale bar, 25 µm.
Figure 3
Figure 3
IR triggers the most prominent increase in senescent astrocyte population in the brain. A,B) UMAP embeddings with the expression of P21CIP1 (A) or P16INK4A (B) for snRNA‐seq datasets. Cell type annotations were represented as indicated color frames. The percentage of cells positive for high levels of P16INK4A or P21CIP1 is indicated next to each cell population. C) Quantification of P16INK4A and GFAP in the brain sections of wild‐type C57BL6/J mice via immune‐RNA FISH. D) Quantification of P16INK4A ‐tdTomato‐positive astrocytes (GFAP+) in the brain sections of CDKN2A‐DTR mice. E) Quantification of P16INK4A and GFAP in paired primary and recurrent glioma samples (n = 12) via immune‐RNA FISH.
Figure 4
Figure 4
Senescent astrocytes exhibit changes in secretory cytokine profile. A) Representative images of GFAP and γH2AX immunofluorescence costaining in irradiated or mock‐irradiated MA and HA at 2 h after IR. Scale bars, 25 and 10 µm. B) Representative images of senescence‐associated β‐galactosidase staining in irradiated or mock‐irradiated MA and HA at indicated time points after IR. Scale bar, 200 µm. C) Quantification of senescence‐associated β‐galactosidase staining of irradiated or mock‐irradiated mouse astrocytes (MA) and human astrocytes (HA) at indicated time points after IR. D) MA were irradiated or mock‐irradiated; after 7 days, conditioned medium (CM) was collected and subjected to multiple cytokine array analysis. Fold increase and indicated p‐values of the irradiated and mock‐irradiated groups are shown in the table. Experiments were performed in triplicate. E) mRNA was extracted and subjected to qRT‐PCR. β‐actin was used as internal control. F) GBM cells (GL261, G422, U251, and LN229) were incubated with the indicated MA/HA‐CM for 72 h and subjected to CellTiter Glo assay.
Figure 5
Figure 5
TNF‐α derived from senescent astrocytes drives the production of immunosuppressive cytokines in GBM cells. A) GL261 cells were incubated with Control‐/Nor‐MA‐/Sen‐MA‐CM for 48 h; then, supernatants were collected and subjected to multiplex cytokine array analysis. The fold increase of Nor‐/Sen‐MA‐CM groups over that of the control is shown in the heatmap. B) CXCL1‐ELISA revealed the stimulation of CXCL1 production in GL261 cells by incubation with Sen‐MA‐CM. CXCL1 levels in Nor‐MA/Sen‐MA‐CM were assessed and served as controls. C) GL261 cells were incubated with differentially expressed cytokines from Sen‐MA‐CM and compared with Nor‐MA‐CM (CXCL12, G‐CSF, TNF‐α, sICAM‐1 and IL‐6) at gradient concentrations (0, 50, 250, 500, and 1000 pg mL−1) for 24 h. The supernatants were collected and subjected to CXCL1‐ELISA. D) ELISA showing increased TNF‐α level in Sen‐MA‐CM relative to Nor‐MA‐CM. E) CXCL1 production in GL261 cells was increased following TNF‐α treatment at the concentration detected in Sen‐MA‐CM (80 pg mL−1). F) Increased CXCL1 production induced by TNF‐α was reduced following treatment with TNF‐α‐ or TNFR1‐neutralizing antibodies. G) Kaplan–Meier graph showing the survival time of pre‐irradiated mice bearing GL261‐sh‐NC or ‐sh‐CXCL1‐1/2 cells (n = 5 per group); log‐rank test.
Figure 6
Figure 6
TNF‐α derived from senescent astrocytes activates Myc‐Max signaling in GBM cells. A) GL261 cells were treated with TNF‐α (80 pg mL−1) for 72 h. Nuclei proteins were extracted and subjected to multiplex profiling analysis for transcriptional activation. The activity of each transcriptional factor was normalized to that of the PBS‐treated group. B) GL261 cells were transfected with control or c‐Myc‐Max promoter firefly luciferase constructs along with renilla luciferase reporters, followed by TNF‐α treatment for 48 h. Firefly luciferase activity was normalized by renilla luciferase activity and compared with the control group. C) Western blot analysis of c‐Myc and Max proteins in lysates prepared from GL261 cells. D) Schematic diagram of the firefly luciferase constructs of a 1985‐bp region upstream of CXCL1 TSS and indicated truncates designed by predicting binding sites of c‐Myc. E) GL261 cells were transfected with constructs in (D) and renilla reporter, followed by TNF‐α treatment for 48 h. Firefly luciferase activity was normalized by renilla luciferase activity and compared with the control group. F,G) Nuclear extracts were subjected to chromatin immunoprecipitation assay. Immunoprecipitants analyzed by PCR and electrophoresis (F) and qRT‐PCR (G) showing elevated fold enrichment of the promoter site −978/971 in the anti‐c‐Myc group. H) GL261 cells were transfected with control or c‐Myc‐Max promoter firefly luciferase constructs along with renilla luciferase reporters, followed by TNF‐α or TNF‐α plus MYCi975 treatment for 48 h. Firefly luciferase activity was normalized by renilla luciferase activity and compared with the control group. (I) CXCL1 production induced by TNF‐α was reduced after coadministration with MYCi975 measured by ELISA.
Figure 7
Figure 7
Tumor immune microenvironment is remodeled by clearance of senescent cells using senolytic drugs in vivo. A) Nor‐/Sen‐MA were incubated with gradient concentrations of ABT263 (1, 5, 20, 50, 100 µM) or D+Q (1/20, 10/20, 10/40, 20/40 µm) for 72 h and subjected to CellTiter Glo assay. B,C) Nor‐/Sen‐MA were incubated with gradient concentrations of ABT263 (1, 5, 20, 50, 100 µm) or D+Q (1/20, 10/20, 10/40, 20/40 µm) for 24 h and subjected to RealTime‐Glo Annexin V Apoptosis Assay. D) Schematic representation of the experimental design. E,F) Quantification of Ki‐67 (E) and CD34 (F) immunofluorescence staining from GL261‐ and G422‐derived xenografts. G) Kaplan–Meier graph showing the survival time of preirradiated mice bearing GL261 cells administrated with ABT263 or D+Q (n = 5 per group); log‐rank test. H) Quantification of Ly6B immunofluorescence staining of GL261‐ and G422‐derived xenografts. Scale bar, 25 µm. I) Quantification of immunofluorescence costaining against CD11b and Gr‐1 of GL261‐ and G422‐derived xenografts. Scale bar, 25 µm. J) Quantification of immunofluorescence costaining against F4/80 and CD163 from GL261‐ and G422‐derived xenografts. Scale bar, 25 µm.
Figure 8
Figure 8
Senolytic drugs help enhance the efficacy of radiotherapy. A) Irradiated and mock‐irradiated GBM cells were incubated with gradient concentrations of ABT263 (1, 5, 20, 50, 100 µm) or D+Q (1/20, 10/20, 10/40, 20/40 µm) for 72 h and subjected to CellTiter Glo assay. B) Schematic representation of the experimental design. C) Kaplan–Meier graph showing the survival time of tumor‐bearing mice with indicated treatment (n = 5 per group); log‐rank test. D) Schematic model of the mechanism. Senescent astrocytes (SnAs) induced by IR modulate the secretory profiles of GBM cells via SASP to remodel the tumor immue microenvironment and promote GBM recurrence. DNA damage is induced by IR in normal astrocytes in the peritumoral regions. These cells undergo cellular senescence by upregulating cell cycle inhibitors such as P16INK4A and P21CIP1 , followed by the release of a large amount of SASP factors. SnAs‐derived soluble cytokines, such as TNF‐α, activates downstream Myc‐Max signaling and induces transcription of CXCL1 in GBM cells, which is responsible for the recruitment of myeloid inflammatory cells, in turn leading to tumor recurrence. Selectively clearance of these SnAs by senolytic drugs can delay tumor growth.

References

    1. a) Ostrom Q. T., Patil N., Cioffi G., Waite K., Kruchko C., Barnholtz‐Sloan J. S., Neuro Oncol. 2020, 22, iv1; - PMC - PubMed
    2. b) Alexander B. M., Cloughesy T. F., J. Clin. Oncol. 2017, 35, 2402. - PubMed
    1. a) Stupp R., Hegi M. E., Mason W. P., van den M. J., Bent M. J., Taphoorn R. C., Janzer S. K., Ludwin A., Allgeier B., Fisher K., Belanger P., Hau A. A., Brandes J., Gijtenbeek C., Marosi C. J., Vecht K., Mokhtari P., Wesseling S., Villa E., Eisenhauer T., Gorlia M., Weller D., Lacombe J. G., Cairncross R. O., Mirimanoff R., Lancet Oncol. 2009, 10, 459,; - PubMed
    2. b) Sulman E. P., Ismaila N., Armstrong T. S., Tsien C., Batchelor T. T., Cloughesy T., Galanis E., Gilbert M., Gondi V., Lovely M., Mehta M., Mumber M. P., Sloan A., Chang S. M., J. Clin. Oncol. 2017, 35, 361. - PubMed
    1. Wernicke A. G., Smith A. W., Taube S., Mehta M. P., Pract Radiat Oncol 2016, 6, 298. - PubMed
    1. Barker H. E., Paget J. T., Khan A. A., Harrington K. J., Nat. Rev. Cancer 2015, 15, 409. - PMC - PubMed
    1. Jiang W., Chan C. K., Weissman I. L., Kim B. Y. S., Hahn S. M., Trends Cancer 2016, 2, 638. - PubMed

Substances