. 2024 Feb 11;16(1):26.
doi: 10.1186/s13148-024-01632-y.

Molecular map of disulfidptosis-related genes in lung adenocarcinoma: the perspective toward immune microenvironment and prognosis

Affiliations

Molecular map of disulfidptosis-related genes in lung adenocarcinoma: the perspective toward immune microenvironment and prognosis

Fangchao Zhao et al. Clin Epigenetics. .

Abstract

Background: Disulfidptosis is a recently discovered form of programmed cell death that could impact cancer development. Nevertheless, the prognostic significance of disulfidptosis-related genes (DRGs) in lung adenocarcinoma (LUAD) requires further clarification.

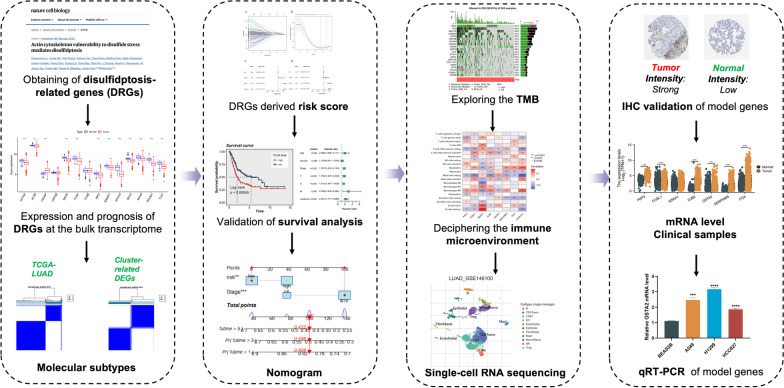
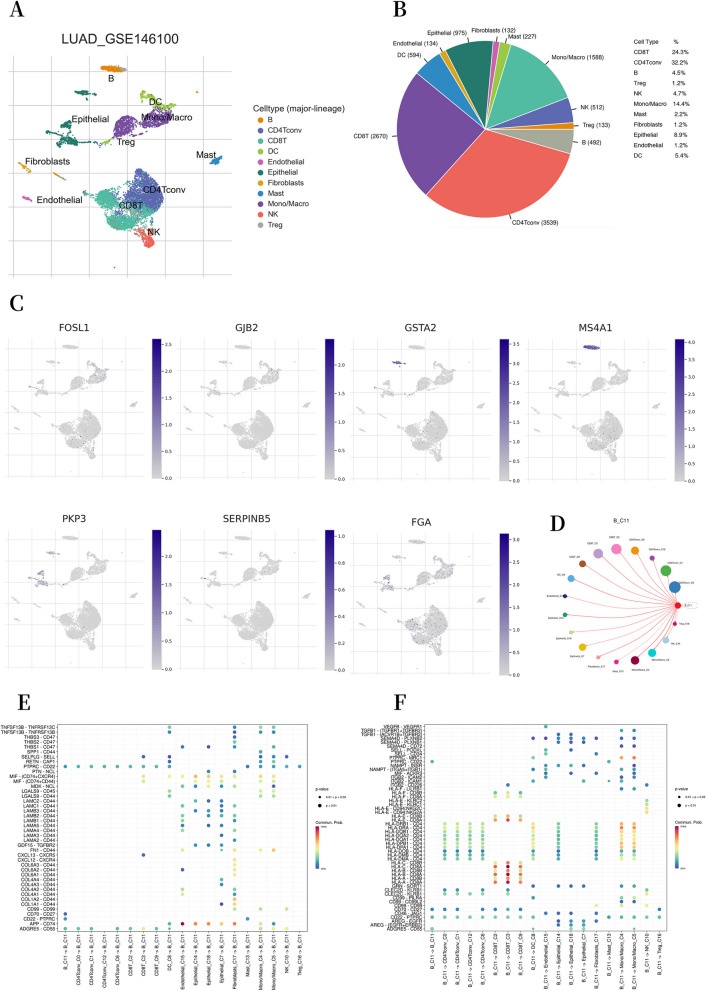
Methods: This study systematically explores the genetic and transcriptional variability, prognostic relevance, and expression profiles of DRGs. Clusters related to disulfidptosis were identified through consensus clustering. We used single-sample gene set enrichment analysis and ESTIMATE to assess the tumor microenvironment (TME) in different subgroups. We conducted a functional analysis of differentially expressed genes between subgroups, which involved gene ontology, the Kyoto encyclopedia of genes and genomes, and gene set variation analysis, in order to elucidate their functional status. Prognostic risk models were developed using univariate Cox regression and the least absolute shrinkage and selection operator regression. Additionally, single-cell clustering and cell communication analysis were conducted to enhance the understanding of the importance of signature genes. Lastly, qRT-PCR was employed to validate the prognostic model.

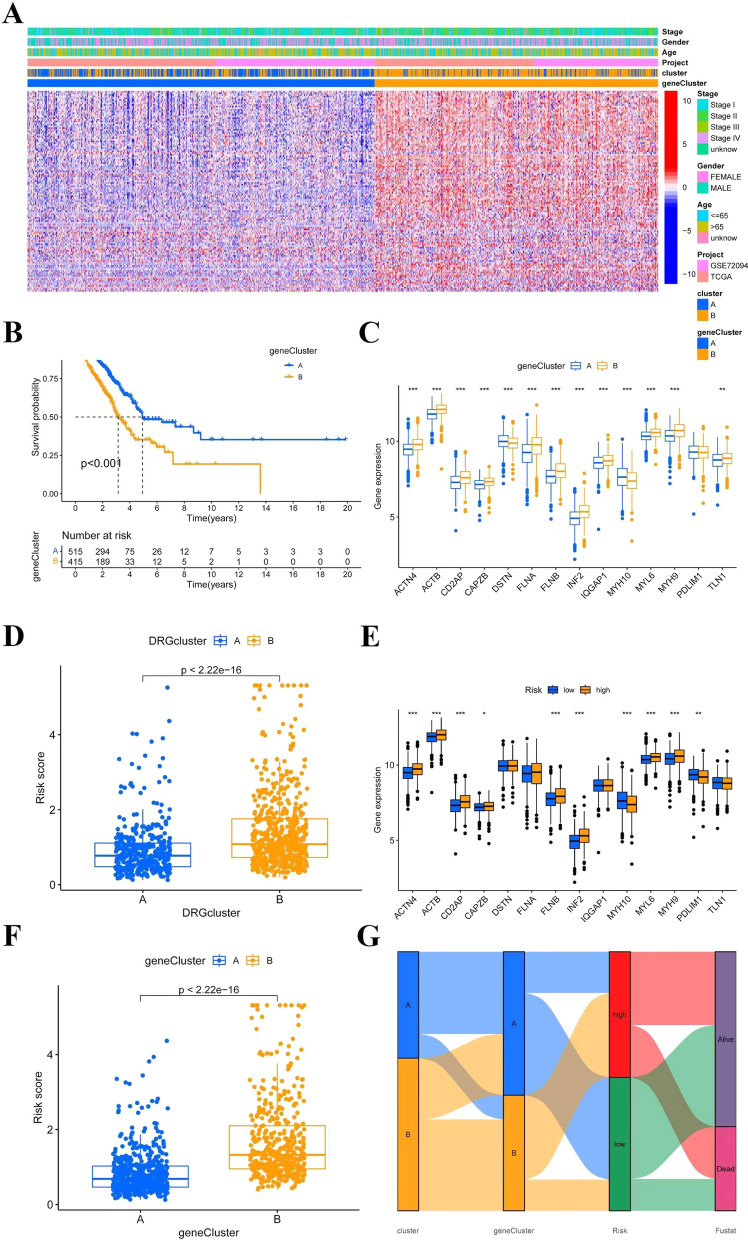
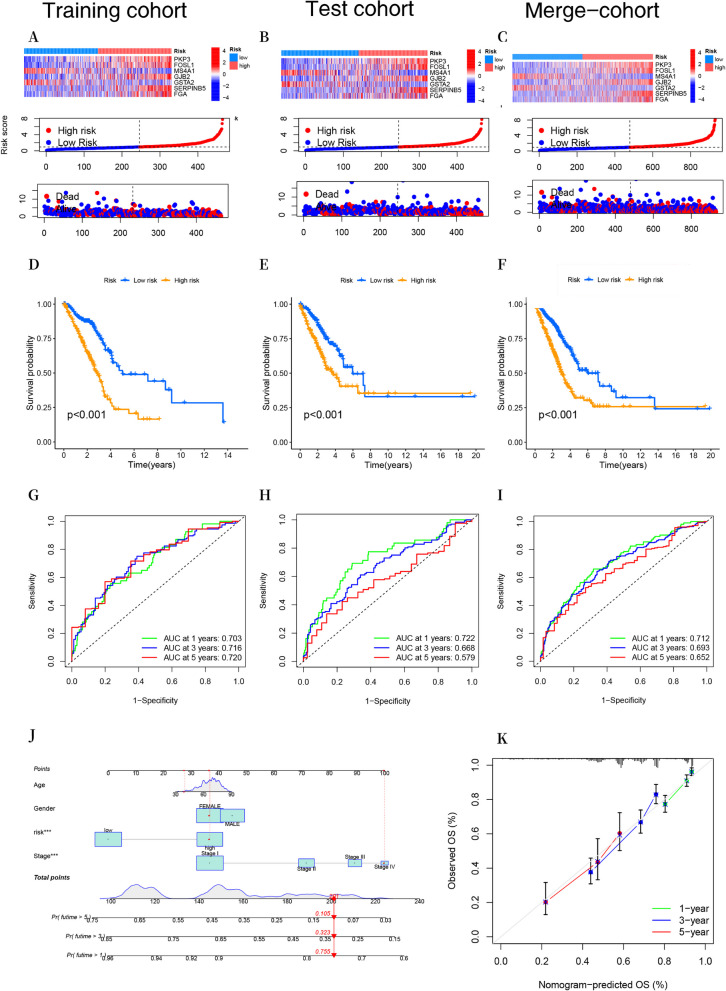
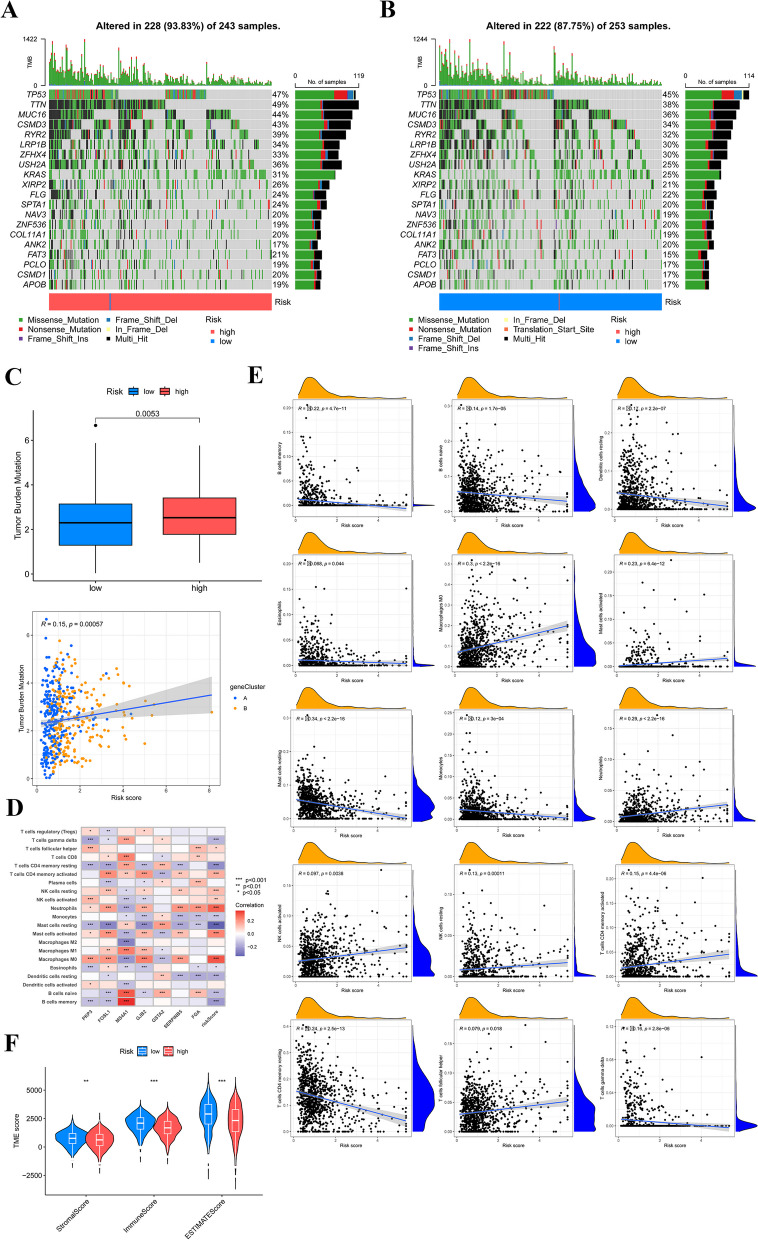
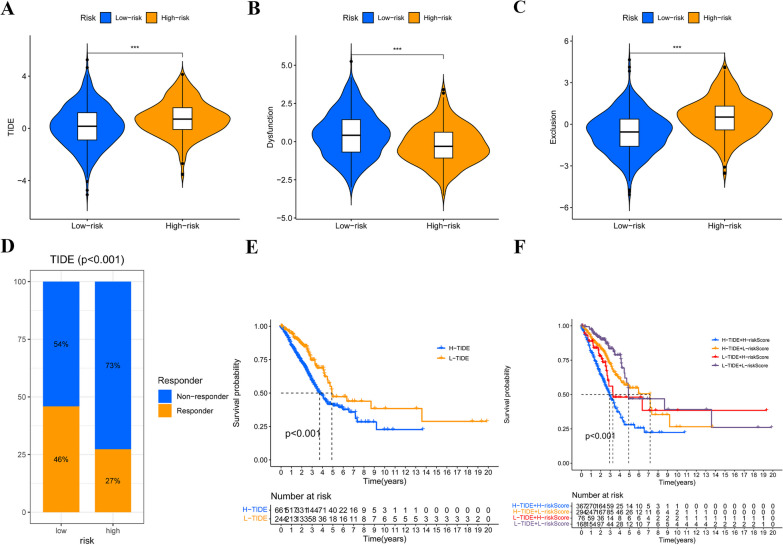
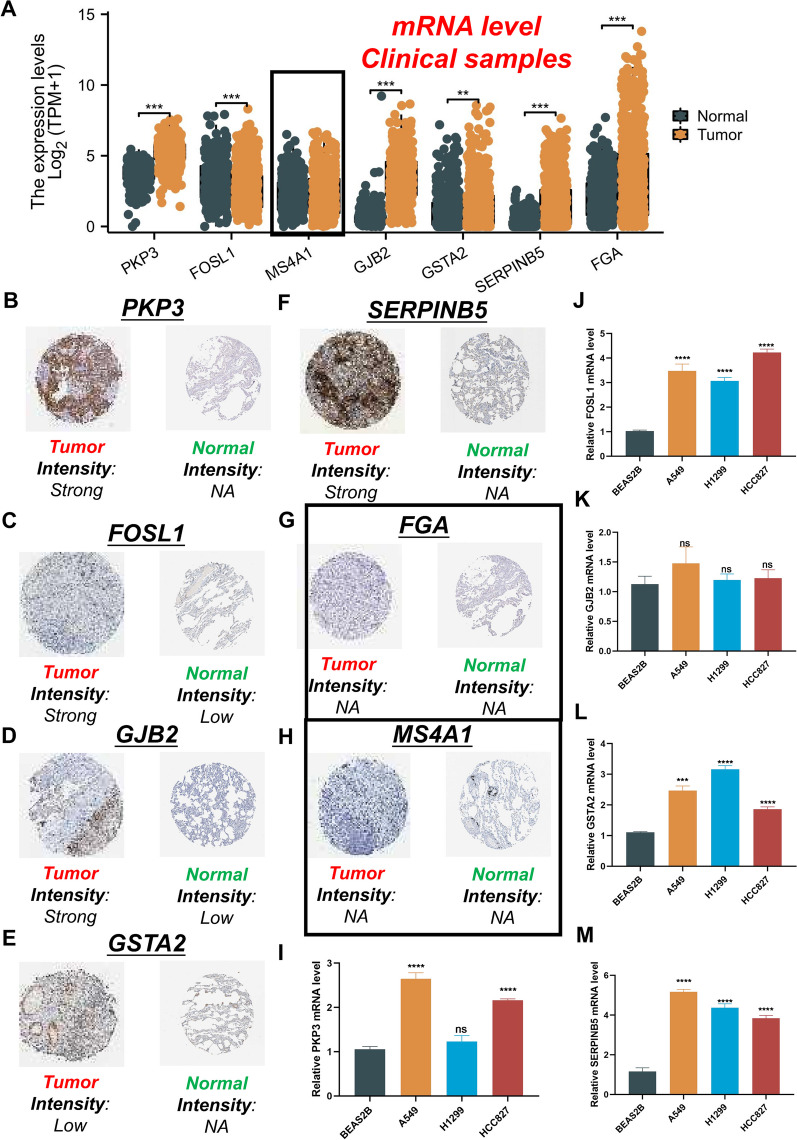
Results: Two clearly defined DRG clusters were identified through a consensus-based, unsupervised clustering analysis. Observations were made concerning the correlation between changes in multilayer DRG and various clinical characteristics, prognosis, and the infiltration of TME cells. A well-executed risk assessment model, known as the DRG score, was developed to predict the prognosis of LUAD patients. A high DRG score indicates increased TME cell infiltration, a higher mutation burden, elevated TME scores, and a poorer prognosis. Additionally, the DRG score showed a significant correlation with the tumor mutation burden score and the tumor immune dysfunction and exclusion score. Subsequently, a nomogram was established for facilitating the clinical application of the DRG score, showing good predictive ability and calibration. Additionally, crucial DRGs were further validated by single-cell sequencing data. Finally, crucial DRGs were further validated by qRT-PCR and immunohistochemistry.

Conclusion: Our new DRG signature risk score can predict the immune landscape and prognosis of LUAD. It also serves as a reference for LUAD's immunotherapy and chemotherapy.

Keywords: Disulfidptosis; Immune checkpoint inhibitors; Lung adenocarcinoma; Molecular subtypes; Tumor microenvironment.


Conflict of interest statement

The authors declare no potential competing interests.

Figures

Fig.1
Fig.1
Workflow of this study
Fig.2
Fig.2
Landscape of genetic and transcriptional variations of DRGs in LUAD. A, B Summary of the variation patterns observed in 616 patients with LUAD, including the classification and type of genetic variations, SNV classification, frequency of occurrence of mutations in each sample, and the top 10 most frequently mutated genes. C, D Landscape of genetic variations of 616 LUAD patients in TCGA cohort. E CNV amplifications and deletions of DRGs in LUAD patients. F Variations in the gene expression levels of 14 DRGs in tumor samples compared to their normal counterparts. G The circus plot depicted the spatial distribution of CNV in DRGs across 23 chromosomes. H The observed network revealed the interconnections between different DRGs in LUAD. In node connections, red indicates positive correlation, while blue signifies negative correlation. The node's size represents the P-value of the prognosis, its color indicates the gene's risk—purple for high-risk and green for low-risk. **P < 0.01, ***P < 0.001
Fig.3
Fig.3
The associations between DRG clusters and clinical features, CRSGs, ICGs, and TME. A TCGA-LUAD cohort was grouped into 2 clusters according to the consensus clustering matrix (k = 2). B Uniform clustering CDF with k from 2 to 9. C The change of area under CDF curve with k from 2 to 9. D The heatmap demonstrated distinctive expressions of DRGs in relation to clinicopathological characteristics, distinguished DRG cluster A from B. E Survival analysis of two DRG clusters using landmark methodology. F–J ICGs, immune and stromal scores, MHC molecules expression level, CRSGs, and immune cell infiltration between DRG cluster A and B. *P < 0.05, **P < 0.01, ***P < 0.001
Fig.4
Fig.4
Functional enrichment analysis and discerning DEGs between distinct clusters of DRG. A GSVA of KEGG terms between DRG cluster A and B. B The GSVA was conducted to assess the differences in GOBP terms between DRG cluster A and B. The color red was assigned to indicate activation, while blue was assigned to indicate inhibition. C–F GSEA analysis between DRG cluster A and B. G, H GO, and KEGG enrichment analyses of DEGs between two DRG clusters
Fig.5
Fig.5
Detection of gene clusters and establishment of the prognostic model associated with disulfidptosis in LUAD. A The heatmap displayed distinctive patterns of expression for OS-related DEGs across various gene clusters and clinicopathological characteristics. K-M OS curves for patients in the two gene clusters (log-rank test). C Variations in the expression levels of 14 DRGs within distinct gene clusters. D The DRG score significant dissimilarities between DRG clusters A and B. E Variations in the expression levels of 14 DRGs between groups classified as high risk and low risk. Differences in DRG scores among gene cluster A to B. G The Sankey diagram depicts the distribution of subtypes in various cohorts classified by their DRG score and survival rates. *P < 0.05, **P < 0.01, ***P < 0.001
Fig.6
Fig.6
Assessment of the prognostic model associated with disulfidptosis. A The heatmap exhibited distinct gene expression patterns in the prognostic model for both high- and low-risk groups across the training, test, and merge-cohorts. B The distribution of the DRG score across the training, test, and merge-cohorts. C The risk point plot effectively portrayed the survival time and survival status patterns observed within the high-risk and low-risk groups across the training, test, and merge datasets. D–F The log-rank test was utilized to analyze the K–M OS curves of patients categorized into high- and low-risk groups across the training, test, and merge-cohorts. G–I The prognostic capacity of the prognostic model was evaluated in the training, test, and merge-cohorts using ROC curves. J A nomogram was developed to estimate the likelihood of overall survival at 1, 3, and 5 years for patients with LUAD in the merge-cohort. K The calibration curves for the nomogram. ***P < 0.001
Fig.7
Fig.7
Correlations of the DRG score with TMB and TME. A, B The mutational profile of low- and high-risk groups in LUAD patients. C The potential correlations that may exist between the TMB and the DRG score across various gene clusters and the discrepancies in TMB score between high- and low-risk groups. D The associations between the abundance of immune cells and seven genes in the prognostic model. E The association between the prevalence of immune cells and the DRG score. F Correlations between DRG score and TME scores. *P < 0.05, **P < 0.01, ***P < 0.001
Fig.8
Fig.8
Estimation of the DRG prognostic model in immunotherapy response. A A disparity in the TIDE score when compared groups classified as high-risk versus those categorized as low risk. B The dissimilarity in exclusion scores observed between groups classified as high risk and low risk. C Comparison of dysfunction scores between high- and low-risk groups. D The immunotherapeutic response distribution within identified groups has been stratified using the DRG scores derived from the TIDE algorithm. E The K-M OS curves were generated to compare two groups categorized based on the TIDE score. F The K-M curves were examined to assess the OS of four discrete groups categorized by their DRG and TIDE scores. ***P < 0.001
Fig.9
Fig.9
The distribution of the DRG score in tumor microenvironment. A, B Eleven cell types from 10,996 cells. C Single-cell sequencing analysis has been utilized to investigate the cellular localization of seven modeling genes. D Communication between B cells and other cells. E Receptor ligand pairs for interactions between B cells and other cell types. F Receptor-ligand pairs for interactions between B cells and other cell types. The relative significance of the P-value was represented by the size of the circles, with larger circles indicating smaller P-value. Additionally, the color of the circles depicted the probability of interactions, with shades of red indicating a higher likelihood of interactions
Fig.10
Fig.10
Validation of the expression of the seven signature genes in LUAD. The mRNA expression profile of the seven genes in tumor tissues from the TCGA database and normal lung tissues from the TCGA and GTEx databases. B-H The protein expression of the seven genes in LUAD tumor tissues and normal tissues. The data were obtained from the HPA database. I–M Further verification of the mRNA expression levels of five signature genes in human LUAD cancer cell lines and human normal lung epithelial cell line by qRT-PCR analysis. ns, not significant, *P < 0.05, **P < 0.01, ***P < 0.001

Similar articles

Cited by

References

    1. Ferlay J, Soerjomataram I, Dikshit R, Eser S, Mathers C, Rebelo M, et al. Cancer incidence and mortality worldwide: sources, methods and major patterns in GLOBOCAN 2012. Int J Cancer. 2015;136(5):E359–E386. doi: 10.1002/ijc.29210. - DOI - PubMed
    1. Bade BC, Dela Cruz CS. Lung cancer 2020: epidemiology, etiology, and prevention. Clin Chest Med. 2020;41(1):1–24. doi: 10.1016/j.ccm.2019.10.001. - DOI - PubMed
    1. Couraud S, Zalcman G, Milleron B, Morin F, Souquet PJ. Lung cancer in never smokers–a review. Eur J Cancer. 2012;48(9):1299–1311. doi: 10.1016/j.ejca.2012.03.007. - DOI - PubMed
    1. Seo JS, Ju YS, Lee WC, Shin JY, Lee JK, Bleazard T, et al. The transcriptional landscape and mutational profile of lung adenocarcinoma. Genome Res. 2012;22(11):2109–2119. doi: 10.1101/gr.145144.112. - DOI - PMC - PubMed
    1. Hao CC, Xu CY, Zhao XY, Luo JN, Wang G, Zhao LH, et al. Up-regulation of VANGL1 by IGF2BPs and miR-29b-3p attenuates the detrimental effect of irradiation on lung adenocarcinoma. J Exp Clin Cancer Res. 2020;39(1):256. doi: 10.1186/s13046-020-01772-y. - DOI - PMC - PubMed

Publication types