. 2024 Feb 12;24(1):105.
doi: 10.1186/s12885-023-11807-0.

Identification and characterization of stromal-like cells with CD207+/low CD1a+/low phenotype derived from histiocytic lesions - a perspective in vitro model for drug testing

Affiliations

Identification and characterization of stromal-like cells with CD207+/low CD1a+/low phenotype derived from histiocytic lesions - a perspective in vitro model for drug testing

Agnieszka Śmieszek et al. BMC Cancer. .

Abstract

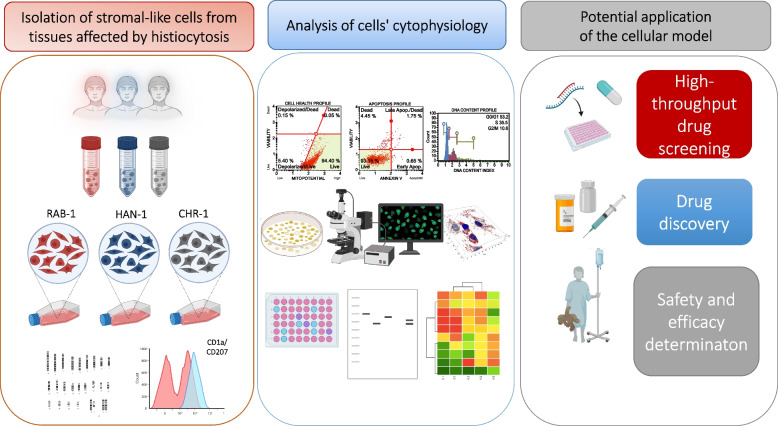
Background: Histiocytoses are rare disorders manifested by increased proliferation of pathogenic myeloid cells sharing histological features with macrophages or dendritic cells and accumulating in various organs, i.a., bone and skin. Pre-clinical in vitro models that could be used to determine molecular pathways of the disease are limited, hence research on histiocytoses is challenging. The current study compares cytophysiological features of progenitor, stromal-like cells derived from histiocytic lesions (sl-pHCs) of three pediatric patients with different histiocytoses types and outcomes. The characterized cells may find potential applications in drug testing.

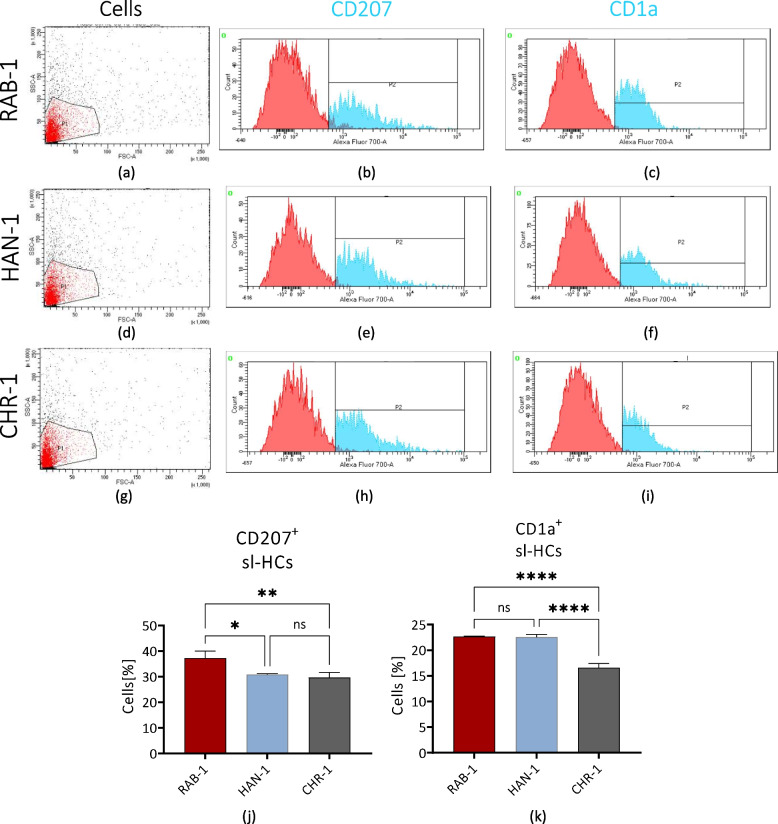
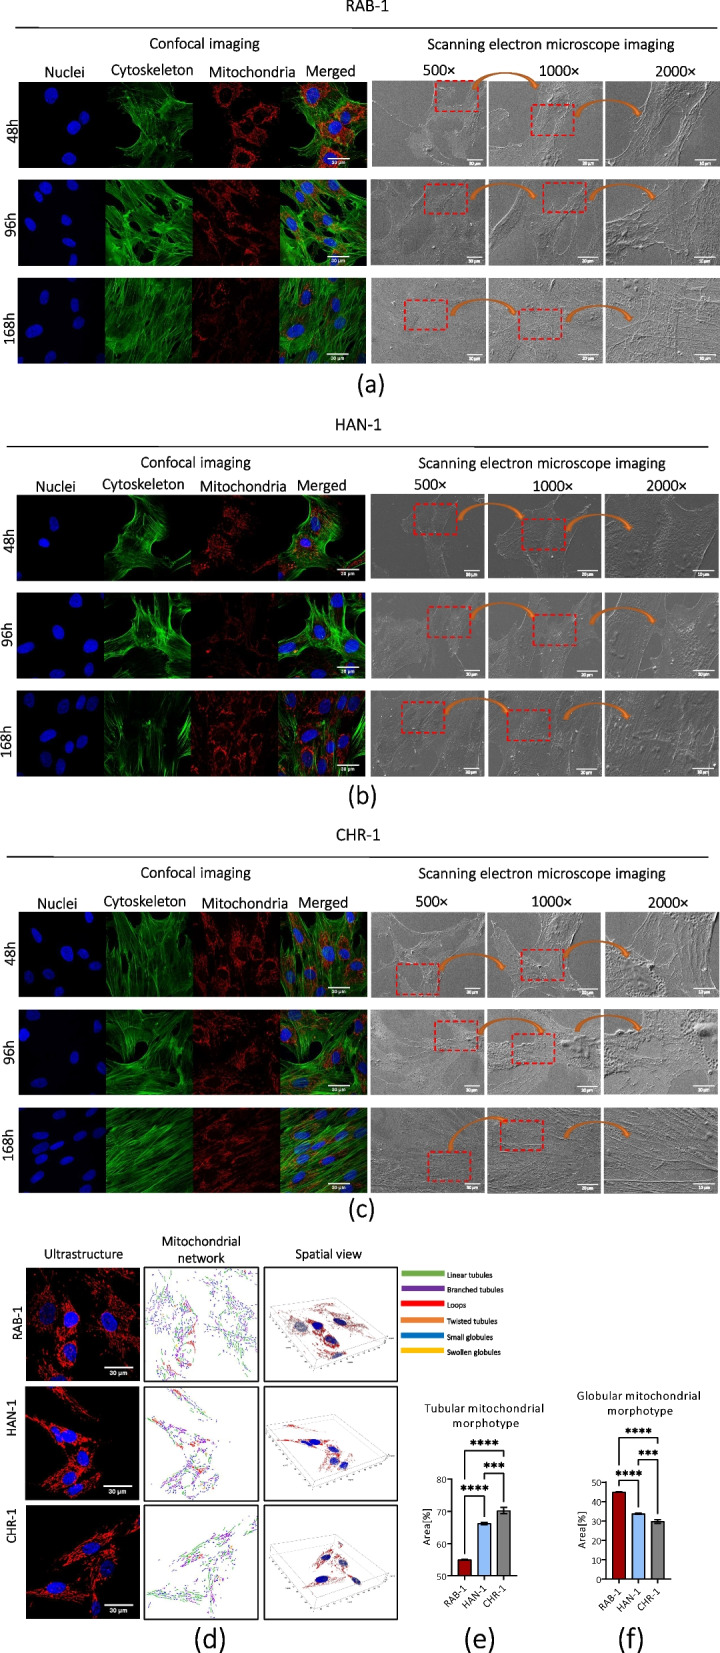
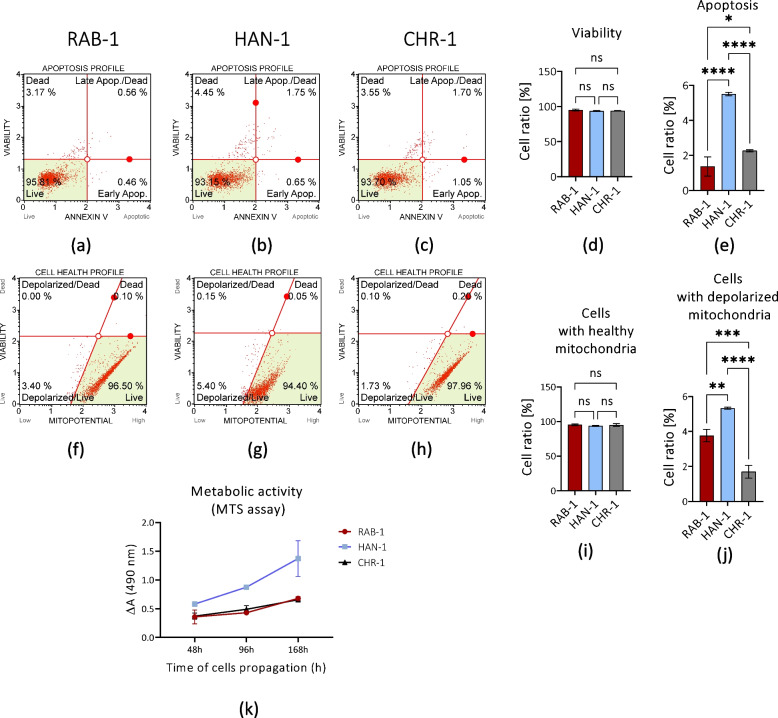
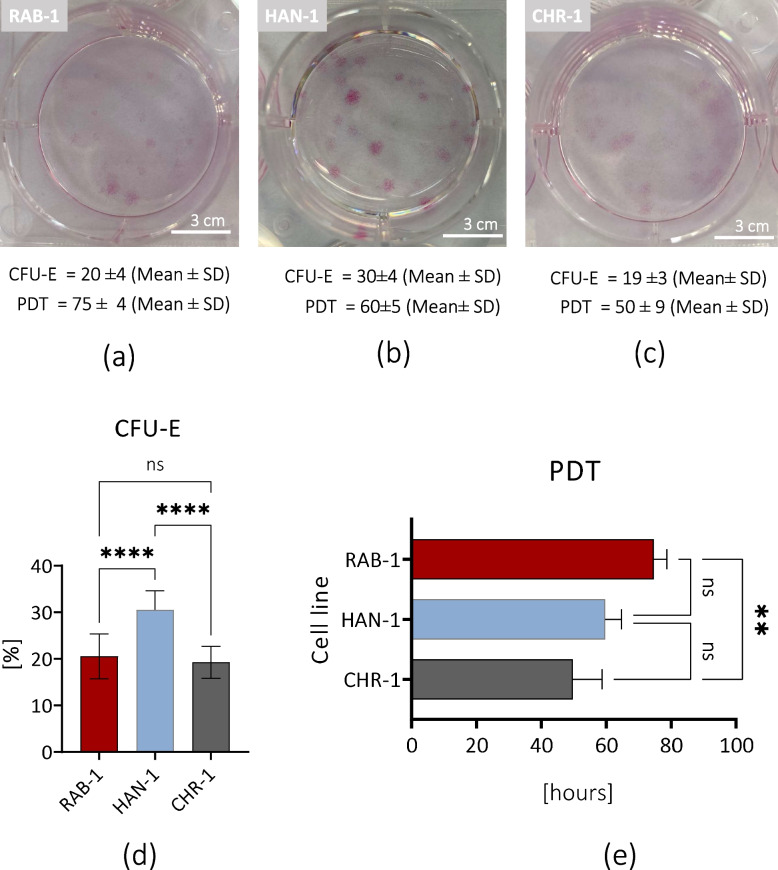
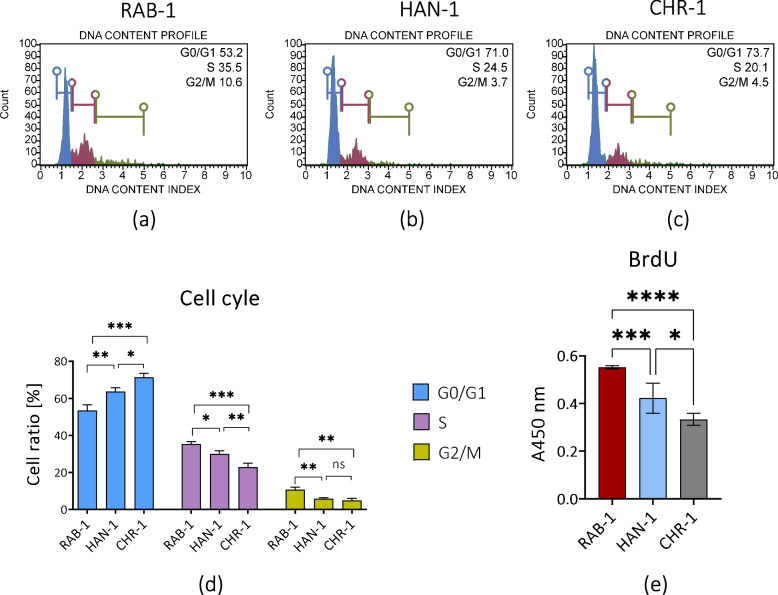
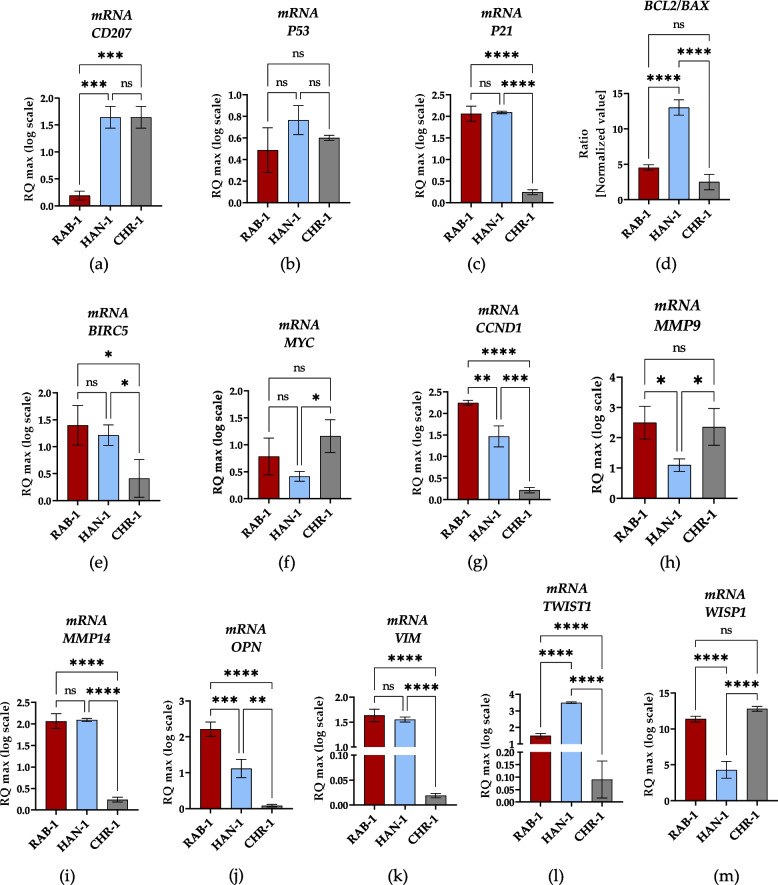
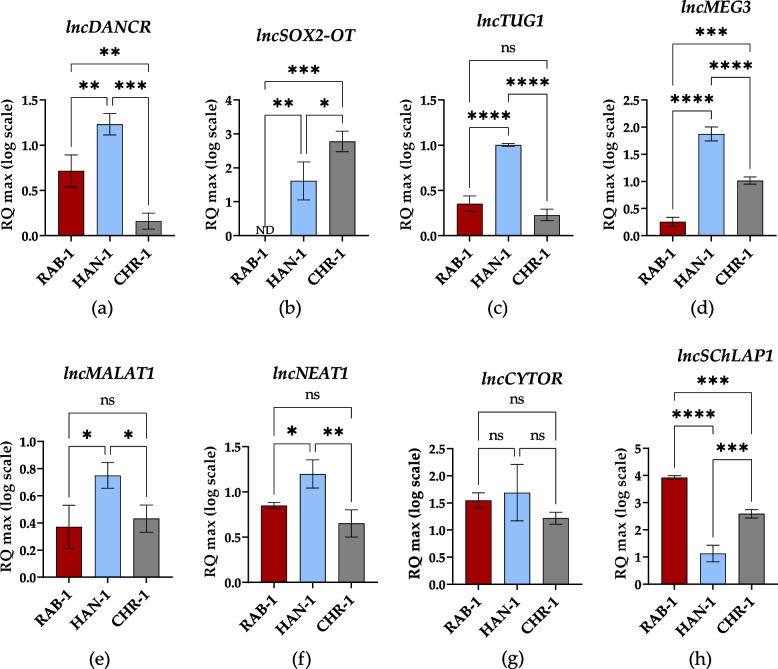
Methods: Molecular phenotype of the cells, i.e. expression of CD1a and CD207 (langerin), was determined using flow cytometry. Cytogenetic analysis included GTG-banded metaphases and microarray (aCGH) evaluation. Furthermore, the morphology and ultrastructure of cells were evaluated using a confocal and scanning electron microscope. The microphotographs from the confocal imaging were used to reconstruct the mitochondrial network and its morphology. Basic cytophysiological parameters, such as viability, mitochondrial activity, and proliferation, were analyzed using multiple cellular assays, including Annexin V/7-AAD staining, mitopotential analysis, BrdU test, clonogenicity analysis, and distribution of cells within the cell cycle. Biomarkers potentially associated with histiocytoses progression were determined using RT-qPCR at mRNA, miRNA and lncRNA levels. Intracellular accumulation of histiocytosis-specific proteins was detected with Western blot. Cytotoxicyty and IC50 of vemurafenib and trametinib were determined with MTS assay.

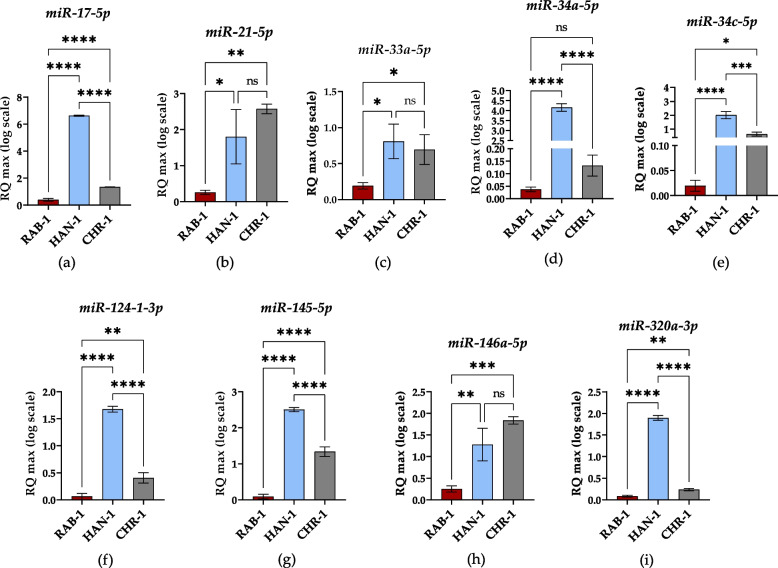
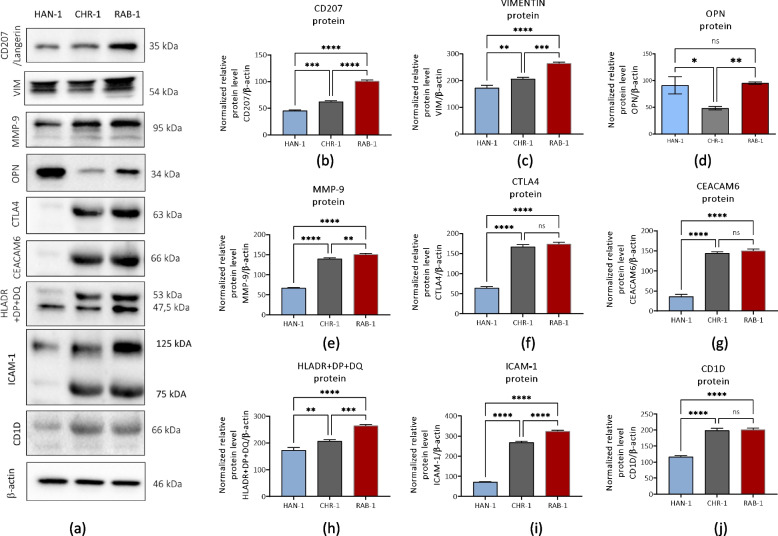
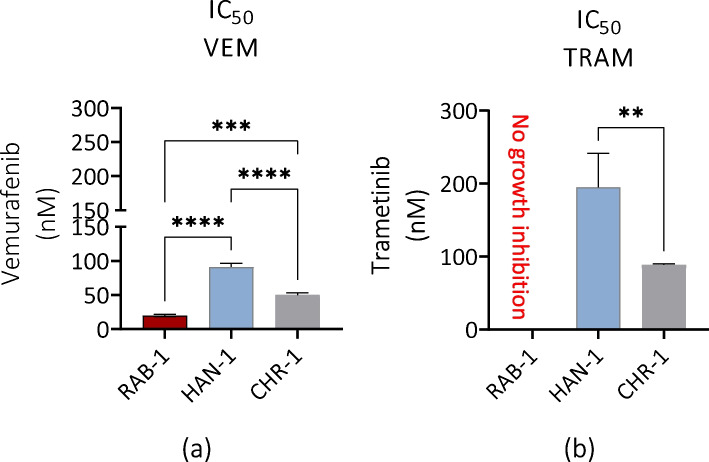
Results: Obtained cellular models, i.e. RAB-1, HAN-1, and CHR-1, are heterogenic in terms of molecular phenotype and morphology. The cells express CD1a/CD207 markers characteristic for dendritic cells, but also show intracellular accumulation of markers characteristic for cells of mesenchymal origin, i.e. vimentin (VIM) and osteopontin (OPN). In subsequent cultures, cells remain viable and metabolically active, and the mitochondrial network is well developed, with some distinctive morphotypes noted in each cell line. Cell-specific transcriptome profile was noted, providing information on potential new biomarkers (non-coding RNAs) with diagnostic and prognostic features. The cells showed different sensitivity to vemurafenib and trametinib.

Conclusion: Obtained and characterized cellular models of stromal-like cells derived from histiocytic lesions can be used for studies on histiocytosis biology and drug testing.

Keywords: Cell lines; Cellular model; Histiocytoses; In vitro study; Langerhans cell histiocytosis; Rare disorders.


Conflict of interest statement

The authors declare no competing interests.

Figures

Fig. 1
Fig. 1
The experimental design and aims of the research. Three primary cell lines were obtained from patients with histiocytoses, i.e. RAB-1, HAN-1 and CHR-1. The cells share cytophysiological features of stromal cells with the phenotype of histiocytes progenitors (sl-pHCs). Their proliferative and metabolic activity was determined, including profiling the expression of transcripts and proteins associated with histiocytoses progression. The sl-pHCs were also used to test the cytotoxicity of vemurafenib and trametinib. Obtained and characterized cell lines present a valuable tool for further studies for
Fig. 2
Fig. 2
Flow cytometric analyses of sl-HCs at p3. The histiocytes markers analyzed were CD1a and CD207 (langerin). The study was performed for RAB-1 cells (a-c), HAN-1 (d-f), and CHR-1 (g-i). The obtained data were used for comparative analysis. Columns with bars represent mean value ± SD. Statistical differences were indicated: * p-value < 0.05, ** p-value < 0.01, and ****p-value < 0.0001, while the “ns” symbol refers to non-significant differences
Fig. 3
Fig. 3
The results of the analysis aimed at evaluation of sl-pHCs’ morphology and ultrastructure. Basic cellular features, including nuclei, cytoskeleton, and mitochondrial network, were captured under a confocal microscope in sl-pHCs. In contrast, cell attachment to the surface and intercellular connections were monitored under SEM. The analysis was performed for RAB-1 (a), HAN-1 (b), and CHR-1 (c). Moreover, the mitochondrial network was reconstructed in 3D, and its cellular distribution and morphology were studied (d). The comparative analysis determined the characteristic pattern of mitochondrial morphology in the obtained sl-pHCs primary cell lines. Scale bars are indicated in the representative microphotographs. Results are presented as a column with bars representing means ± SD. *** p-value < 0.001, and ****p-value < 0.0001
Fig. 4
Fig. 4
The results of assays aimed at determining sl-pHCs viability and mitochondrial activity. The cellular health of sl-pHCs was evaluated based on Annexin-V/7AAD staining to detect apoptotic cells (a-e), and mitochondrial membrane potential status (f-j). MTS assay was performed to monitor the metabolic activity of sl-pHCs in time (k). Columns/Boxes with bars represent mean value ± SD. Statistical differences were indicated: * p-value < 0.05, ** p-value < 0.01, *** p-value < 0.001, and ****p-value < 0.0001, while the “ns” symbol refers to non-significant differences
Fig. 5
Fig. 5
Characteristics of clonogenic activity (a-d) and population doubling time (PDT; a-c, e) determined for primary cultures of sl-pHCs. Results for comparative analysis are presented as columns with bars representing mean value ± SD. Statistical differences were indicated: ** p-value < 0.01, and ****p-value < 0.0001, while the “ns” symbol refers to non-significant differences
Fig. 6
Fig. 6
The results of tests aimed at evaluation of sl-pHCs proliferative activity. Representative histograms show the distribution of sl-pHCs in the cell cycle (a-c). Obtained data were used for comparative analysis (d). The proliferation of sl-pHCs was also assessed in the BrdU assay (e). Statistical differences were indicated: * p-value < 0.05, ** p-value < 0.01, *** p-value < 0.001, and ****p-value < 0.0001, while the “ns” symbol refers to non-significant differences
Fig. 7
Fig. 7
The results of RT-qPCR analysis aimed at the detection of mRNA transcripts. Results for comparative analysis are presented as columns with bars representing mean value ± SD. Statistical differences were indicated: * p-value < 0.05, ** p-value < 0.01, *** p-value < 0.001, and ****p-value < 0.0001, while the “ns” symbol refers to non-significant differences
Fig. 8
Fig. 8
The results of RT-qPCR analysis aimed at the detection of lncRNA transcripts. Results for comparative analysis are presented as columns with bars representing mean value ± SD. Statistical differences were indicated: * p-value < 0.05, ** p-value < 0.01, *** p-value < 0.001, and ****p-value < 0.0001, while the “ns” symbol refers to non-significant differences
Fig. 9
Fig. 9
The results of RT-qPCR analysis aimed at the detection of miRNA transcripts. Results for comparative analysis are presented as columns with bars representing mean value ± SD. Statistical differences were indicated: * p-value < 0.05, ** p-value < 0.01, *** p-value < 0.001, and ****p-value < 0.0001, while the “ns” symbol refers to non-significant differences
Fig. 10
Fig. 10
The results of immunodetection of intracellularly accumulated proteins. The representative immunoblots (a) show bands characteristic for detected proteins. A comparative analysis was performed to analyse the difference in the expression of histiocytosis-related biomarkers, including CD207 (b), vimentin (c), osteopontin (d), MMP-9 (e), CTLA4 (f), CEACAM6 (g), HLADR + DP + DQ (h), ICAM-1 (i), and CD1D (j). Results are presented as columns with bars representing mean value ± SD. Statistical differences were indicated: * p-value < 0.05, ** p-value < 0.01, *** p-value < 0.001, and ****p-value < 0.0001, while the “ns” symbol refers to non-significant differences
Fig. 11
Fig. 11
Comparison of IC50 values for vemurafenib (a) and trametinib (b) using a model of sl-pHCs. IC50 values are presented as columns with bars representing mean value ± SD. Statistical differences were indicated: ** p-value < 0.01, *** p-value < 0.001, and ****p-value < 0.0001, while the “ns” symbol refers to non-significant differences

Similar articles

References

    1. Emile J-F, Cohen-Aubart F, Collin M, Fraitag S, Idbaih A, Abdel-Wahab O, Rollins BJ, Donadieu J, Haroche J. Histiocytosis. Lancet. 2021;398:157–170. doi: 10.1016/S0140-6736(21)00311-1. - DOI - PMC - PubMed
    1. McClain KL, Bigenwald C, Collin M, Haroche J, Marsh RA, Merad M, Picarsic J, Ribeiro KB, Allen CE. Histiocytic disorders. Nat Rev Dis Primers. 2021;7:73. doi: 10.1038/s41572-021-00307-9. - DOI - PMC - PubMed
    1. Emile J-F, Abla O, Fraitag S, Horne A, Haroche J, Donadieu J, Requena-Caballero L, Jordan MB, Abdel-Wahab O, Allen CE, et al. Revised classification of histiocytoses and neoplasms of the macrophage-dendritic cell lineages. Blood. 2016;127:2672–2681. doi: 10.1182/blood-2016-01-690636. - DOI - PMC - PubMed
    1. Egan C, Jaffe ES. Non-neoplastic histiocytic and dendritic cell disorders in lymph nodes. Semin Diagn Pathol. 2018;35:20–33. doi: 10.1053/j.semdp.2017.11.002. - DOI - PMC - PubMed
    1. Huynh KN, Nguyen BD. Histiocytosis and neoplasms of macrophage-dendritic cell lineages: multimodality imaging with emphasis on PET/CT. Radiographics. 2021;41:576–594. doi: 10.1148/rg.2021200096. - DOI - PubMed