. 2024 Feb 12;9(1):31.
doi: 10.1038/s41392-024-01740-4.

Nutrient restriction-activated Fra-2 promotes tumor progression via IGF1R in miR-15a downmodulated pancreatic ductal adenocarcinoma

Affiliations

Nutrient restriction-activated Fra-2 promotes tumor progression via IGF1R in miR-15a downmodulated pancreatic ductal adenocarcinoma

Gian Luca Rampioni Vinciguerra et al. Signal Transduct Target Ther. .

Abstract

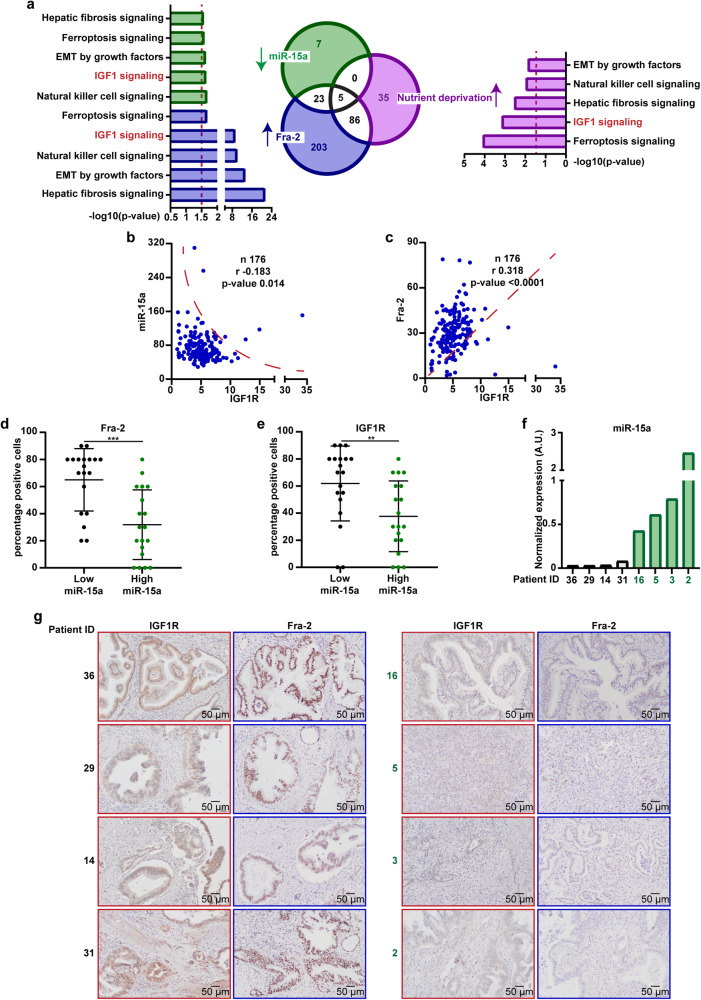
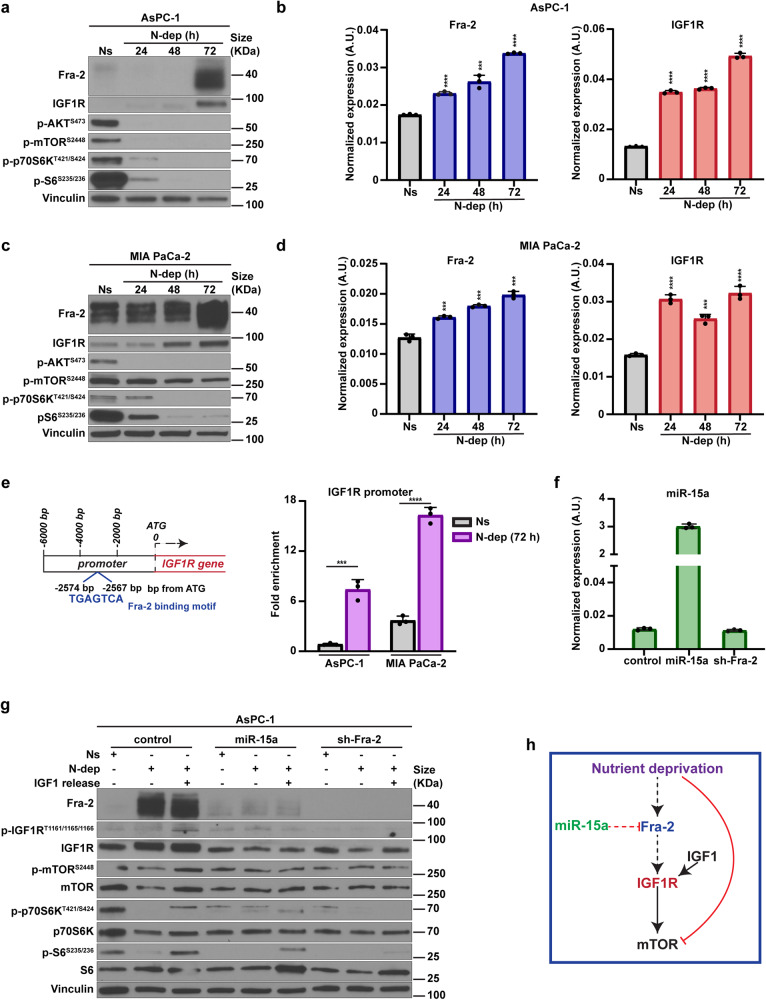
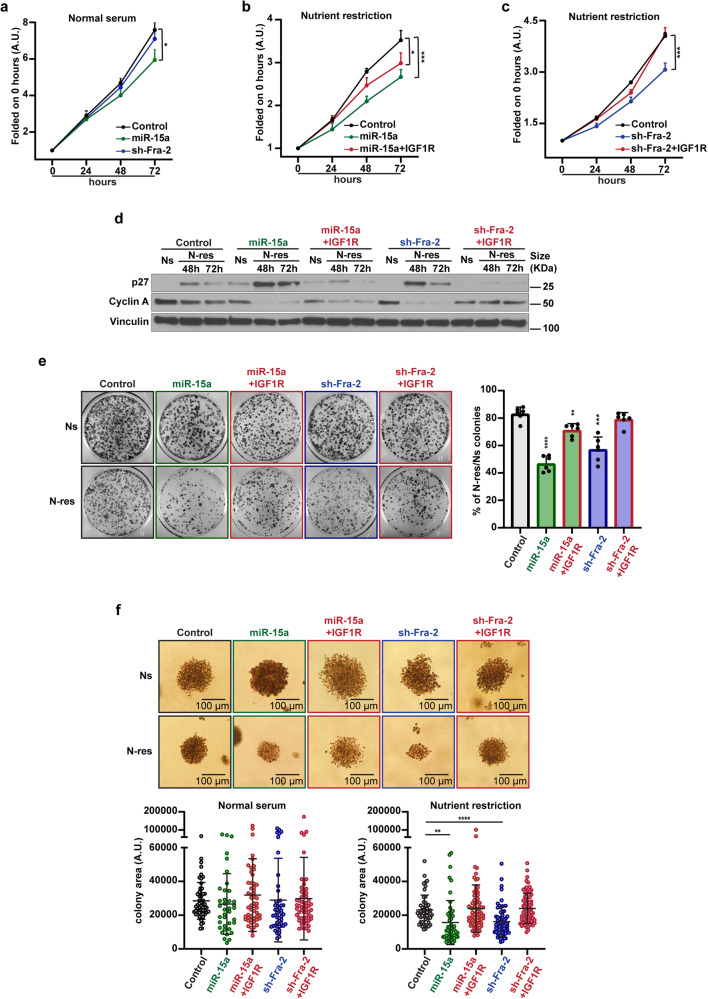
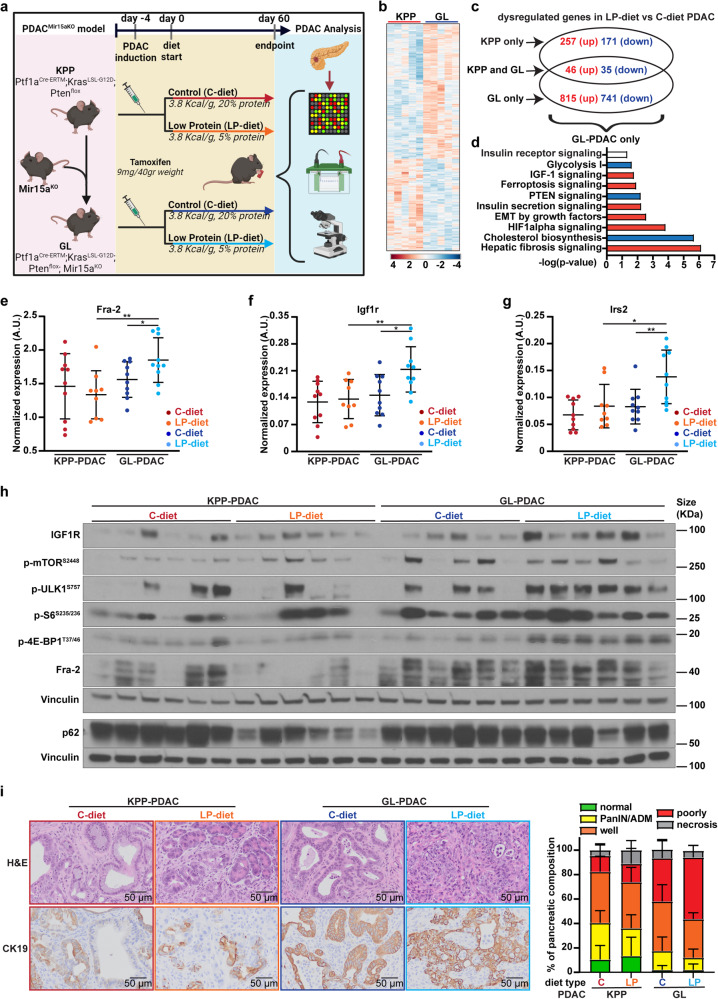
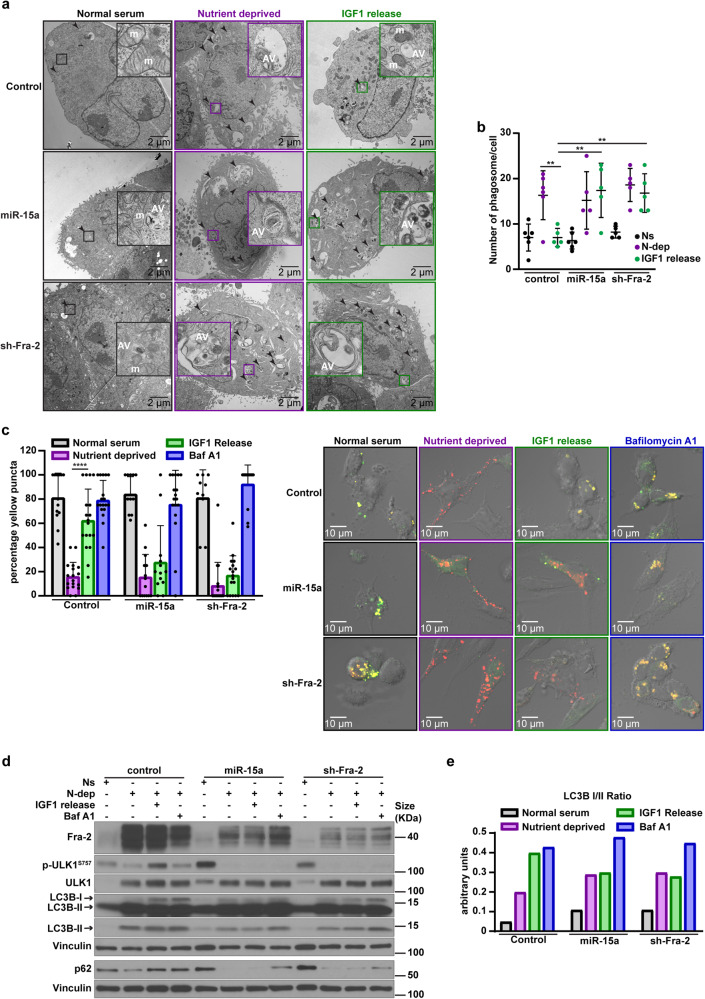
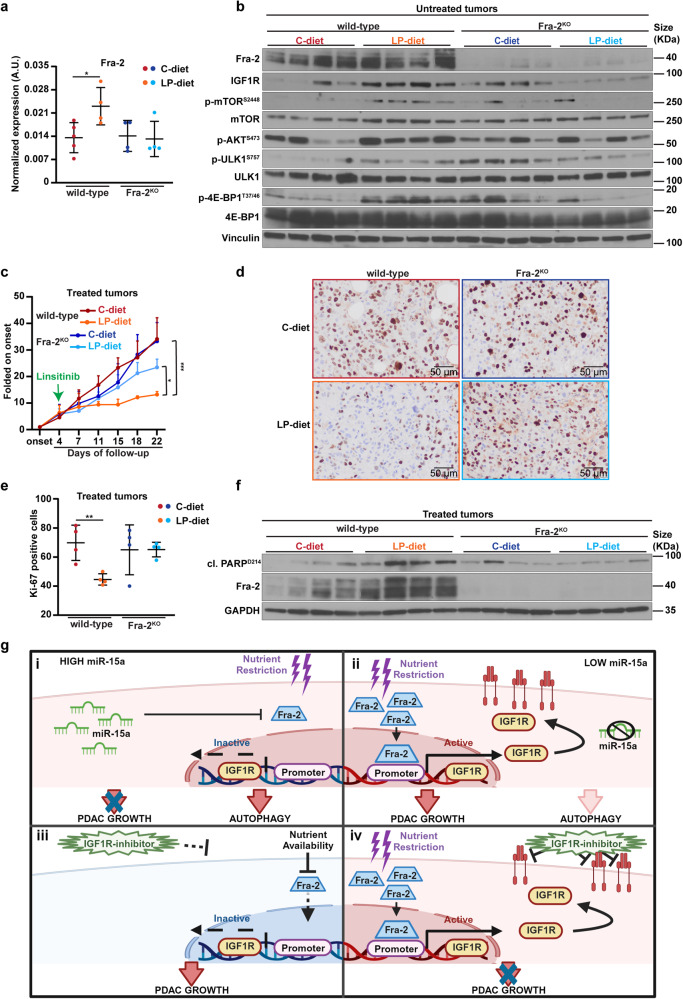
Pancreatic ductal adenocarcinoma (PDAC) is a lethal disease, characterized by an intense desmoplastic reaction that compresses blood vessels and limits nutrient supplies. PDAC aggressiveness largely relies on its extraordinary capability to thrive and progress in a challenging tumor microenvironment. Dysregulation of the onco-suppressor miR-15a has been extensively documented in PDAC. Here, we identified the transcription factor Fos-related antigen-2 (Fra-2) as a miR-15a target mediating the adaptive mechanism of PDAC to nutrient deprivation. We report that the IGF1 signaling pathway was enhanced in nutrient deprived PDAC cells and that Fra-2 and IGF1R were significantly overexpressed in miR-15a downmodulated PDAC patients. Mechanistically, we discovered that miR-15a repressed IGF1R expression via Fra-2 targeting. In miR-15a-low context, IGF1R hyperactivated mTOR, modulated the autophagic flux and sustained PDAC growth in nutrient deprivation. In a genetic mouse model, Mir15aKO PDAC showed Fra-2 and Igf1r upregulation and mTOR activation in response to diet restriction. Consistently, nutrient restriction improved the efficacy of IGF1R inhibition in a Fra-2 dependent manner. Overall, our results point to a crucial role of Fra-2 in the cellular stress response due to nutrient restriction typical of pancreatic cancer and support IGF1R as a promising and vulnerable target in miR-15a downmodulated PDAC.


Conflict of interest statement

The authors declare no competing interests. C.M.C. is one of the Editors-in-Chief of Signal Transduction and Targeted Therapy, but he has not been involved in the process of the manuscript handling.

Figures

Fig. 1
Fig. 1
IGF1 signaling pathway is activated in response to nutrient deprivation and potentially regulated by miR-15a and Fra-2 in PDAC. a Venn diagram showing the number of molecular pathways enriched in nutrient deprived PDAC cells (purple) and potentially upregulated by miR-15a downregulation (green) and Fra-2 expression (blue) in PDAC patients from the TCGA dataset (n = 176). For nutrient deprivation (purple), data were obtained by performing ingenuity pathway analysis (IPA®) on the overexpressed genes in AsPC-1 and MIA PaCa-2 cell lines, cultured in nutrient deprivation (0% FBS) for 72 h. For miR-15a (green) and Fra-2 (blue), data were obtained by performing IPA® analyses on the genes significantly correlated with Fra-2 expression and the putative target genes inversely correlated with miR-15a levels in PDAC patients from the TCGA dataset. Histograms showing the significance of the five commonly activated pathways, as obtained by the Venn diagram. Dotted red lines indicate the established threshold of 1.5 of −log10(p value). Scatter plots representing the correlation of IGF1R expression with levels of miR-15a (b) and Fra-2 (c) in PDAC samples from the TCGA dataset. The number of analyzed samples (n), the Spearman correlation value (r), and its significance (p value) are reported in the graphs. Box plots showing the expression of Fra-2 (d) and IGF1R (e) in an independent cohort of 38 PDAC samples stratified according to miR-15a levels. miR-15a expression was assessed by qRT-PCR, Fra-2 and IGF1R were evaluated by immunohistochemistry and data represent the percentage of positive cells in each tumor. Unpaired t test was used for statistical analyses and asterisks indicate significant differences. **p < 0.01; ***p < 0.001. f Histograms showing miR-15a expression in patients from the lower quartile (in black) and from the upper quartile (in green). g Representative images of immunohistochemical staining of IGF1R and Fra-2 in PDAC samples stratified according to miR-15a levels, as shown in (f) (10x, magnification)
Fig. 2
Fig. 2
Fra-2 directly regulates IGF1R expression in PDAC response to nutrient deprivation. a Western blot analysis of the indicated proteins in AsPC-1 cells, cultured in normal serum (10% FBS, Ns) or in nutrient deprivation (0% FBS, N-dep) and collected at the indicated timepoints (hours, h). Vinculin was used as loading control. b Graphs report the normalized expression of Fra-2 (left) and IGF1R (right), evaluated by qRT-PCR analysis in AsPC-1 parental cells cultured as described in (a). c Western blot analysis of the indicated proteins in MIA PaCa-2 cells, cultured in normal serum (10% FBS, Ns) or in nutrient deprivation (0% FBS, N-dep) and collected at the indicated timepoints (hours, h). Vinculin was used as loading control. d Graphs report the normalized expression of Fra-2 (left) and IGF1R (right), evaluated by qRT-PCR analysis in MIA PaCa-2 parental cells cultured as described in (c). e On the left, schematic representation of Fra-2-binding sequence on IGF1R promoter. On the right, chromatin immunoprecipitation (ChIP) analysis of Fra-2 bound to the IGF1R promoter in AsPC-1 and MIA PaCa-2 cells cultured in normal serum (Ns) or in nutrient deprivation (N-dep) for 72 h (h). f qRT-PCR analysis of miR-15a normalized expression in control, miR-15a overexpressing and Fra-2 silenced (sh-Fra-2) AsPC-1 cells, as used in the experiment described in (g). Data represent the mean (±SD) of three independent experiments. g Expression of the indicated proteins and phospho-proteins in cell lysates of control, miR-15a overexpressing and Fra-2 silenced AsPC1 cells, cultured in normal serum (Ns), nutrient deprivation (N-dep) and released with IGF1 (80 ng/ml) for 1 h (IGF1 release), as indicated. Vinculin was used as loading control. h Working model for miR-15a modulation of mTOR activity via Fra-2/IGF1R in nutrient deprived PDAC cells. Nutrient deprivation-induced cell stress triggers Fra-2 transcriptional activity that, in turn, increases IGF1R expression and eventually restores the phosphorylation of mTOR pathway members. This mechanism is counteracted by miR-15a targeting of IGF1R via Fra-2. Dashed lines indicate the novel interaction between miR-15a/Fra-2 and IGF1R, whereas solid lines represent the well-established effects of nutrient deprivation and IGF1R activity on mTOR pathway. In (b, d, e), data represent the mean (±SD) of three independent experiments performed in triplicate. Unpaired t test was used for statistical analyses and asterisks indicate significant differences compared to the Ns condition. ***p < 0.001; ****p < 0.0001
Fig. 3
Fig. 3
miR-15a impairs PDAC cell growth during nutrient restriction, via Fra-2 targeting and IGF1R signaling downmodulation. a Graph reports the growth rate of control, miR-15a overexpressing and Fra-2 silenced AsPC-1 cells cultured in normal serum (10% FBS) over a period of 72 h. b Graph reports the growth rate of control, miR-15a and miR-15a + IGF1R overexpressing AsPC-1 cells, cultured in nutrient restriction (2.5% FBS) over a period of 72 h. c Graph reports the growth rate of control, Fra-2 silenced and Fra-2 silenced+IGF1R overexpressing AsPC-1 cells, cultured in nutrient restriction (2.5% FBS) over a period of 72 h. In (ac), data are folded on the 0 h timepoint and represent the mean (±SD) of three independent experiments performed in triplicate. Two-way ANOVA was used to verify the statistical significance and asterisks indicate significant differences compared to controls. *p < 0.05; ***p < 0.001. d Western blot analysis evaluating p27 and Cyclin A protein levels in AsPC-1 cells transfected as indicated and cultured in normal serum (10% FBS, Ns) and nutrient restriction (2.5% FBS, N-res). e Representative images (left) and graph (right) of colony formation assay of control, miR-15a, miR15a + IGF1R overexpressing, Fra-2 silenced, and Fra-2 silenced+IGF1R overexpressing AsPC-1 cells, cultured in normal serum (10% FBS, Ns) and in nutrient restriction (2.5% FBS, N-res). Data represent the percentage of colonies in N-res folded on the colonies number counted in Ns condition. Data collect the mean (±SD) of three independent experiments performed in duplicate. f Representative images (top) and graphs (bottom) of soft agar assay of the indicated cells, as described in (e), cultured in normal serum (10% FBS, Ns) and in nutrient restriction (2.5% FBS, N-res). Bottom graphs report the measured areas, and each dot represents a different colony as evaluated in three independent experiments. In (e, f), unpaired t test was used for statistical analyses and asterisks indicate significant differences compared to controls. **p < 0.01; ***p < 0.001; ****p < 0.0001
Fig. 4
Fig. 4
In vivo, protein-restricted diet induces Fra-2 and IGF1R overexpression and IGF1 signaling activation in Mir15aKO PDAC. a Schematic representation of the experimental workflow used for the generation and study of an inducible transgenic mouse model of PDAC. The crossbreeding of the KrasLSL-G12D, Ptf1aCre-ERTM, Ptenflox (named KPP) inducible PDAC model with the Mir15aKO mouse resulted in the KPP/Mir15aKO mouse (named GL). At 6–8 weeks of age, KPP and GL mice were induced by three intraperitoneal injections of Tamoxifen (9 mg/40 gr mouse weight), and at the third injection mice were randomly distributed in two different cohorts, fed with control (3.8 Kcal/g, 20% of proteins, C-diet) or isocaloric, low protein diet (3.8 Kcal/g, 5% of proteins, LP-diet). After 60 days, mice were sacrificed and pancreata were collected and analyzed. Created with BioRender.com. b Heat map of deregulated genes in PDAC from KPP and GL mice after 60 days from tumor induction and C-diet feeding (n = 5 mice each group). c Venn diagram showing the number of dysregulated genes in PDAC from KPP and GL mice fed with LP-diet versus C-diet (n = 5 mice each group). Numbers in red represent upregulated genes in response to LP-diet; numbers in blue represent downregulated genes in response to LP-diet compared to C-diet. d Histograms showing molecular networks significantly modulated in GL-PDAC fed with LP-diet compared to C-diet. Data were obtained by performing IPA® analyses on the genes specifically altered in GL-PDAC only (n = 815 upregulated and n = 741 downregulated), obtained from the comparison in (c). Blue and red bars represent a profile of negatively and positively enriched pathways, respectively, based on the z-score. White bar represents a neutral profile of enriched pathway, in which the z-score was undetermined. e-f Graphs report the normalized expression of Fra-2 (e), Igf1r (f) and Irs2 (g), evaluated by qRT-PCR analysis in PDAC from KPP and GL mice fed with C- and LP-diet, as indicated. Each dot represents a different tumor and unpaired t test was used to assess the statistical significance. *p < 0.05; **p < 0.01. h Western blot analysis of the indicated proteins in PDAC from KPP and GL mice fed with C- and LP-diet, as indicated. Vinculin was used as loading control. i Histology evaluation of KPP- and GL-PDAC fed with C- and LP-diet. On the left, representative images of H&E and CK19 stained sections from PDAC tumors (20x, magnification); on the right, graph represents the percentage of phenotypic components of pancreatic tissues: normal epithelium (non-neoplastic, green), Pancreatic intraepithelial neoplasia and acinar-to-ductal metaplasia (PanIN/ADM, yellow), well-differentiated PDAC (Well, orange), poorly differentiated PDAC (Poorly, red), or necrosis (gray). (n = 10 KPP C-diet; 9 KPP LP-diet; 10 GL C-diet; 10 GL LP-diet)
Fig. 5
Fig. 5
miR-15a modulates autophagic flux via Fra-2 and IGF1R targeting in nutrient deprived PDAC cells. a Transmission electron microscopy (TEM) ultrastructure analyses of control, miR-15a overexpressing and Fra-2 silenced AsPC-1, cultured in normal serum (10% FBS), nutrient deprivation (0% FBS) and released with IGF1 (80 ng/ml) for 2 h. Arrowheads indicate autophagic vacuoles and insets show an enlargement to highlight the ultrastructure of autophagic vacuoles. Indicated intracellular organelles are mitochondria (m) and autophagic vacuoles (AV). b Graph reports the number of autophagic vacuoles per cell, as assessed by TEM. Each dot represents a different evaluated cell and unpaired t test was used to verify the statistical significance. **p < 0.01. c Confocal microscopy analyses of control, miR-15a overexpressing and Fra-2 silenced AsPC-1 cells transfected with ptfLC3 construct. Cells were cultured in normal serum, nutrient deprivation and released or not with IGF1 (80 ng/ml, 2 h) or Bafilomycin A1 (0.2 μM for 1 h), as indicated. On the left, the graph reports the percentage of yellow LC3 puncta counted per cell (number of cells/experimental condition = 7–12). Unpaired t test was used to verify the statistical significance. ****p < 0.0001. On the right, typical confocal images of the described experiment. d Western blot analysis evaluating the expression of the indicated autophagy markers in control, miR-15a overexpressing and Fra-2 silenced AsPC-1 cells, cultured in normal serum (10% FBS, Ns), in nutrient deprivation (0% FBS, N-dep), and released with IGF1 (80 ng/ml, 2 h) or Bafilomycin A1 (0.2 μM for 1 h), as indicated. Vinculin was used as loading control. e Graph reporting the normalized LC3B I/II ratio in cell lysates, as evaluated in (d)
Fig. 6
Fig. 6
Fra-2 dictates sensitivity to IGF1R inhibition in nutrient deprived PDAC. a Graph reports the normalized expression of Fra-2, evaluated by qRT-PCR analysis in tumors explanted from untreated mice cohort (vehicle) as summarized in Supplementary Fig. S10a. Nude mice were injected in the flank with either wild-type or Fra-2KO AsPC-1 cells. Once tumor onset was established, mice were randomly subdivided in two different cohorts, fed with control diet (C-diet) or isocaloric, low protein diet (LP-diet) and treated daily with vehicle. Each dot represents a different tumor and unpaired t test was used to assess the statistical significance. *p < 0.05. b Western blot analysis evaluating the expression of the indicated proteins in tumors explanted from the untreated (vehicle) cohort of mice described in (a). Vinculin was used as loading control. c Graph reporting the growth rate of tumors (n = 4 tumor/group) from the cohort of mice treated with Linsitinib. Nude mice were injected in the flank with either wild-type or Fra-2KO AsPC-1 cells. Once tumor onset was established, mice were randomly subdivided in two different cohorts, fed with control diet (C-diet) or isocaloric, low protein diet (LP-diet) and treated daily with Linsitinib for 3 weeks. Green arrow indicates the starting point of Linsitinib administration. Data are represented as the mean (±SD) of 4 tumor/group folded on their respective volume at the onset and two-way ANOVA was used to verify the statistical significance. *p < 0.05; ***p < 0.001. d Typical images of Ki-67 expression evaluated by immunohistochemistry (IHC) in tumors explanted from mice treated with Linsitinib as described in (c) (20x, magnification). e Graph reports the percentage of Ki67-positive cells in tumors represented in (d). Data are expressed as mean (±SD) of Ki-67 percentage counted in five randomly selected fields per tumor. Each dot represents a different tumor. Unpaired t test was used to verify the statistical significance. **p < 0.01. f Western blot analysis evaluating the expression of the indicated proteins in tumors explanted from the cohort of mice treated with Linsitinib as described in (c). GAPDH was used as loading control. g Working model for miR-15a/Fra-2 modulation of IGF1R signaling and sensitivity to IGF1R-inhibitor in PDAC cells exposed to different conditions of nutrient availability. i High levels of miR-15a inhibit IGF1R expression via Fra-2 targeting, impinging on PDAC growth during nutrient restriction. ii In miR-15a downmodulated PDAC, nutrient restriction triggers expression and transcriptional activity of Fra-2 that, in turn, leads to PDAC growth by upregulating IGF1R. iii In presence of nutrient availability, does not activate IGF1R transcription and administration of IGF1R-inhibitor results ineffective. iv Fra-2 induces IGF1R overexpression in response to nutrient restriction, sensitizing PDAC cells to IGF1R inhibition. Created with Biorender.com

Similar articles

Cited by

References

    1. Park W, Chawla A, O’Reilly EM. Pancreatic cancer: a review. JAMA. 2021;326:851–862. doi: 10.1001/jama.2021.13027. - DOI - PMC - PubMed
    1. Aier I, Semwal R, Sharma A, Varadwaj PK. A systematic assessment of statistics, risk factors, and underlying features involved in pancreatic cancer. Cancer Epidemiol. 2019;58:104–110. doi: 10.1016/j.canep.2018.12.001. - DOI - PubMed
    1. Kalli M, Li R, Mills GB, Stylianopoulos T, Zervantonakis IK. Mechanical stress signaling in pancreatic cancer cells triggers p38 MAPK- and JNK-dependent cytoskeleton remodeling and promotes cell migration via Rac1/cdc42/Myosin II. Mol. Cancer Res. 2022;20:485–497. doi: 10.1158/1541-7786.MCR-21-0266. - DOI - PMC - PubMed
    1. Perera RM, Bardeesy N. Pancreatic cancer metabolism - breaking it down to build it back up. Cancer Discov. 2015;5:1247–1261. doi: 10.1158/2159-8290.CD-15-0671. - DOI - PMC - PubMed
    1. McAndrews KM, et al. Identification of functional heterogeneity of carcinoma-associated fibroblasts with distinct IL6-mediated therapy resistance in pancreatic cancer. Cancer Discov. 2022;12:1580–1597. doi: 10.1158/2159-8290.CD-20-1484. - DOI - PMC - PubMed

Publication types