

Mapping the distribution of Amblyomma americanum in Georgia, USA
- PMID: 38342907
- PMCID: PMC10860309
- DOI: 10.1186/s13071-024-06142-7
Mapping the distribution of Amblyomma americanum in Georgia, USA
Abstract
Background: Amblyomma americanum, the lone star tick, is an aggressive questing species that harbors several pathogens dangerous to humans in the United States. The Southeast in particular has large numbers of this tick due to the combined suitable climate and habitats throughout the region. No studies have estimated the underlying distribution of the lone star tick across the state of Georgia, a state where it is the dominant species encountered.
Methods: Ticks were collected by flagging 198 transects of 750 m2 at 43 state parks and wildlife management areas across the state from March to July of 2022. A suite of climate, landscape, and wildlife variables were assembled, and a logistic regression model was used to assess the association between these environmental factors and the presence of lone star ticks and to predict the distribution of these ticks across the state.
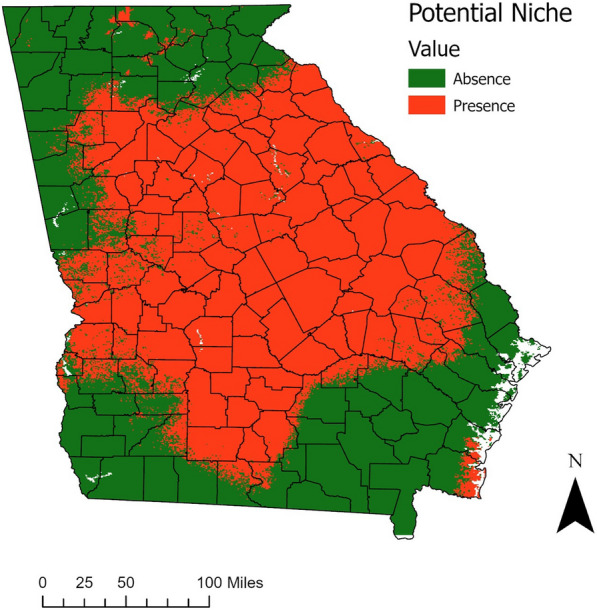
Results: A total of 59/198 (30%) transects sampled contained adult or nymph A. americanum, with the majority of transects containing these ticks (54/59, 91.5%) in forested habitats. The presence of A. americanum was associated with elevation, normalized difference vegetation index (NDVI) on January 1, isothermality, temperature seasonality, and precipitation in the wettest quarter. Vast regions of central, eastern, and southern coastal Georgia (57% of the state) were categorized as suitable habitat for the lone star tick.
Conclusions: This study describes the distribution of the lone star tick across the state of Georgia at a finer scale than the current county-level information available. It identifies specific variables associated with tick presence and provides a map that can be used to target areas for tick prevention messaging and awareness.
Keywords: Amblyomma americanum; Georgia USA; Predictive vector map; Species distribution; Tick.
© 2024. The Author(s).
Conflict of interest statement
The authors declare that they have no competing interests.
Figures


Similar articles
-
The effects of Solenopsis invicta (Hymenoptera: Formicidae) and burned habitat on the survival of Amblyomma americanum (Acari: Ixodidae) and Amblyomma maculatum (Acari: Ixodidae).J Med Entomol. 2013 Mar;50(2):270-6. doi: 10.1603/me12168. J Med Entomol. 2013. PMID: 23540113
-
Optimization of artificial membrane feeding system for lone star ticks, Amblyomma americanum (Acari: Ixodidae), and experimental infection with Rickettsia amblyommatis (Rickettsiales: Rickettsiaceae).J Med Entomol. 2024 Mar 13;61(2):442-453. doi: 10.1093/jme/tjad158. J Med Entomol. 2024. PMID: 38104248 Free PMC article.
-
Detection of Rickettsia Species, and Coxiella-Like and Francisella-Like Endosymbionts in Amblyomma americanum and Amblyomma maculatum from a Shared Field Site in Georgia, United States of America.Vector Borne Zoonotic Dis. 2021 Jul;21(7):509-516. doi: 10.1089/vbz.2020.2683. Epub 2021 May 5. Vector Borne Zoonotic Dis. 2021. PMID: 33956519
-
Role of the lone star tick, Amblyomma americanum (L.), in human and animal diseases.Vet Parasitol. 2009 Mar 9;160(1-2):1-12. doi: 10.1016/j.vetpar.2008.10.089. Epub 2008 Oct 28. Vet Parasitol. 2009. PMID: 19054615 Review.
-
The expanding spectrum of disease caused by the Lone Star Tick, Amblyomma americanum.Infez Med. 2021 Sep 10;29(3):378-385. doi: 10.53854/liim-2903-8. eCollection 2021. Infez Med. 2021. PMID: 35146342 Free PMC article. Review.
References
-
- CDC. Tickborne disease surveillance dashboard Atlanta, GA: Centers for Disease Control and Prevention; 2022. Accessed 13 Sept 2023. https://www.cdc.gov/ticks/data-summary/index.html.
-
- CDC. Regions where ticks live: Centers for Disease Control and Prevention. 2022. Accessed 13 Sept 2023. https://www.cdc.gov/ticks/geographic_distribution.html.
MeSH terms
Grants and funding
LinkOut - more resources
Full Text Sources
