

Low pre-existing endemic human coronavirus (HCoV-NL63)-specific T cell frequencies are associated with impaired SARS-CoV-2-specific T cell responses in people living with HIV
- PMID: 38343437
- PMCID: PMC10853422
- DOI: 10.3389/fimmu.2023.1291048
Low pre-existing endemic human coronavirus (HCoV-NL63)-specific T cell frequencies are associated with impaired SARS-CoV-2-specific T cell responses in people living with HIV
Abstract
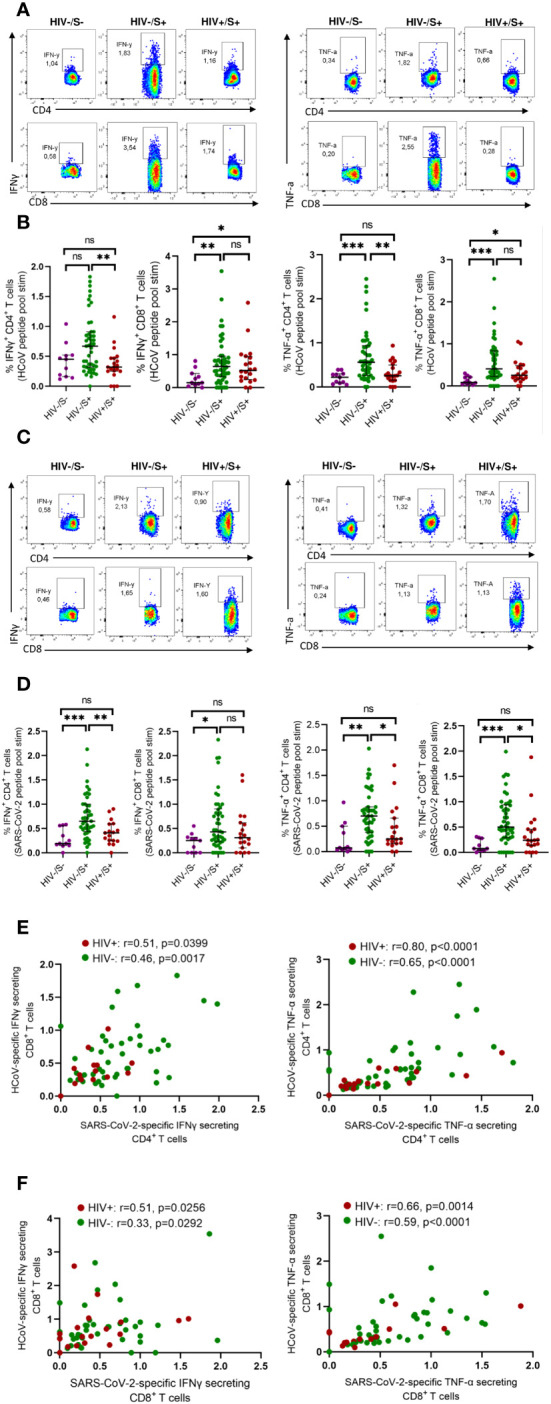
Background: Understanding how HIV affects SARS-CoV-2 immunity is crucial for managing COVID-19 in sub-Saharan populations due to frequent coinfections. Our previous research showed that unsuppressed HIV is associated with weaker immune responses to SARS-CoV-2, but the underlying mechanisms are unclear. We investigated how pre-existing T cell immunity against an endemic human coronavirus HCoV-NL63 impacts SARS-CoV-2 T cell responses in people living with HIV (PLWH) compared to uninfected individuals, and how HIV-related T cell dysfunction influences responses to SARS-CoV-2 variants.
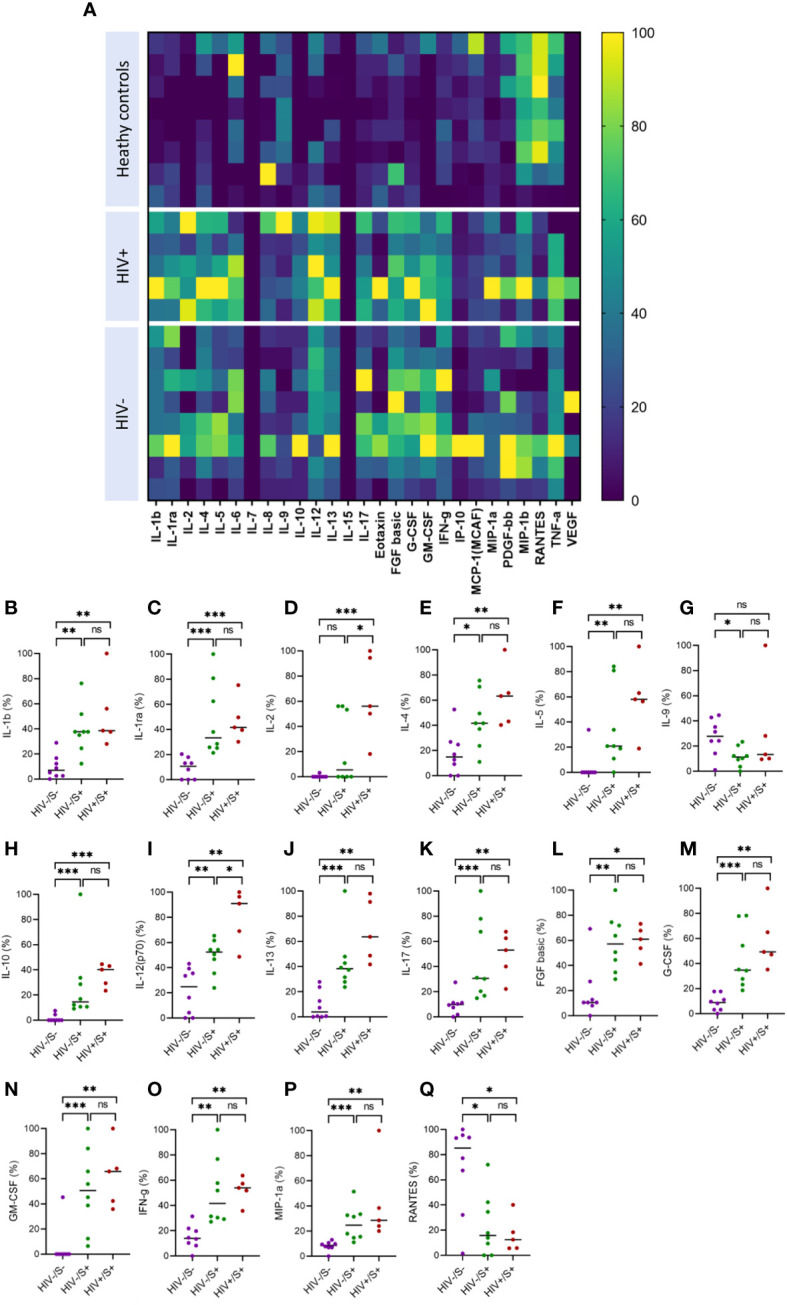
Methods: We used flow cytometry to measure T cell responses following PBMC stimulation with peptide pools representing beta, delta, wild-type, and HCoV-NL63 spike proteins. Luminex bead assay was used to measure circulating plasma chemokine and cytokine levels. ELISA and MSD V-PLEX COVID-19 Serology and ACE2 Neutralization assays were used to measure humoral responses.
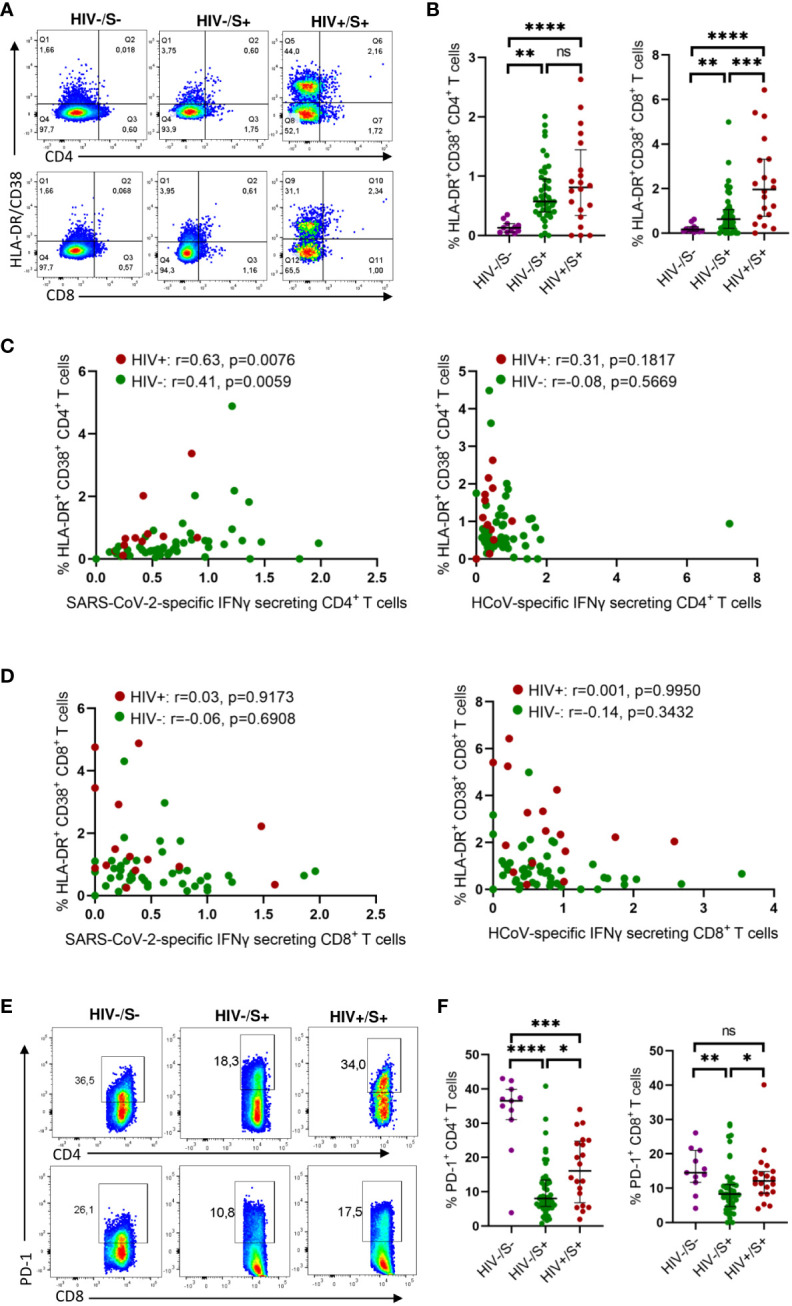
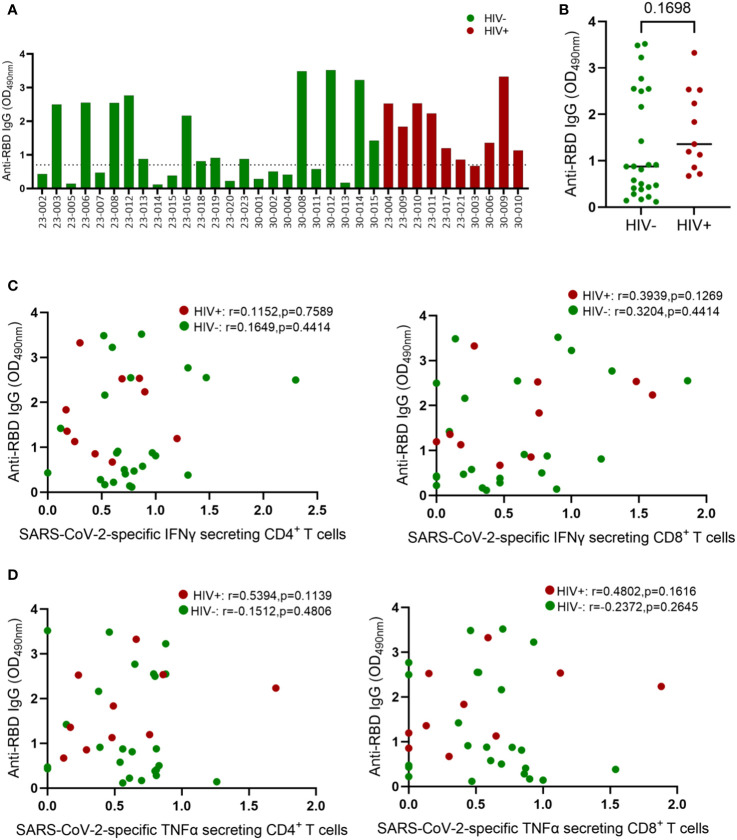
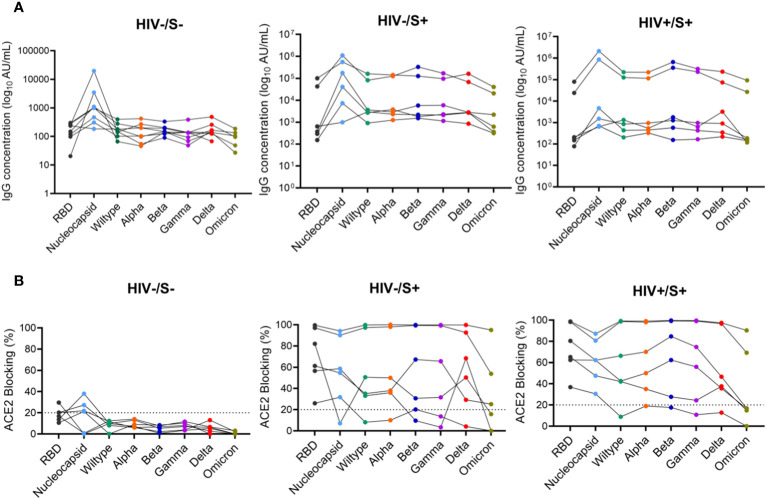
Results: Regardless of HIV status, we found a strong positive correlation between responses to HCoV-NL63 and SARS-CoV-2. However, PLWH exhibited weaker CD4+ T cell responses to both HCoV-NL63 and SARS-CoV-2 than HIV-uninfected individuals. PLWH also had higher proportions of functionally exhausted (PD-1high) CD4+ T cells producing fewer proinflammatory cytokines (IFNγ and TNFα) and had elevated plasma IL-2 and IL-12(p70) levels compared to HIV-uninfected individuals. HIV status didn't significantly affect IgG antibody levels against SARS-CoV-2 antigens or ACE2 binding inhibition activity.
Conclusion: Our results indicate that the decrease in SARS-CoV-2 specific T cell responses in PLWH may be attributable to reduced frequencies of pre-existing cross-reactive responses. However, HIV infection minimally affected the quality and magnitude of humoral responses, and this could explain why the risk of severe COVID-19 in PLWH is highly heterogeneous.
Keywords: COVID-19; HCoV-NL63; HIV; SARS-CoV-2; T-cell response; antibody response.
Copyright © 2024 Ng’uni, Musale, Nkosi, Mandolo, Mvula, Michelo, Karim, Moosa, Khan, Jambo, Hanekom, Sigal, Kilembe and Ndhlovu.
Conflict of interest statement
The authors declare that the research was conducted in the absence of any commercial or financial relationships that could be construed as a potential conflict of interest.
Figures
Similar articles
-
Healthy donor T cell responses to common cold coronaviruses and SARS-CoV-2.J Clin Invest. 2020 Dec 1;130(12):6631-6638. doi: 10.1172/JCI143120. J Clin Invest. 2020. PMID: 32966269 Free PMC article. Clinical Trial.
-
Prospective Assessment of SARS-CoV-2 Seroconversion (PASS) study: an observational cohort study of SARS-CoV-2 infection and vaccination in healthcare workers.BMC Infect Dis. 2021 Jun 9;21(1):544. doi: 10.1186/s12879-021-06233-1. BMC Infect Dis. 2021. PMID: 34107889 Free PMC article.
-
Are higher antibody levels against seasonal human coronaviruses associated with a more robust humoral immune response after SARS-CoV-2 vaccination?Front Immunol. 2022 Sep 8;13:954093. doi: 10.3389/fimmu.2022.954093. eCollection 2022. Front Immunol. 2022. PMID: 36159791 Free PMC article.
-
Molecular mechanisms of human coronavirus NL63 infection and replication.Virus Res. 2023 Apr 2;327:199078. doi: 10.1016/j.virusres.2023.199078. Epub 2023 Feb 22. Virus Res. 2023. PMID: 36813239 Free PMC article. Review.
-
An overview on the seven pathogenic human coronaviruses.Rev Med Virol. 2022 Mar;32(2):e2282. doi: 10.1002/rmv.2282. Epub 2021 Aug 2. Rev Med Virol. 2022. PMID: 34339073 Review.
Cited by
-
Reprogramming tumor-associated macrophages with lipid nanosystems reduces PDAC tumor burden and liver metastasis.J Nanobiotechnology. 2024 Dec 24;22(1):795. doi: 10.1186/s12951-024-03010-5. J Nanobiotechnology. 2024. PMID: 39719597 Free PMC article.
-
T-cell responses to ancestral SARS-CoV-2 and Omicron variant among unvaccinated pregnant and postpartum women living with and without HIV in South Africa.Sci Rep. 2024 Sep 2;14(1):20348. doi: 10.1038/s41598-024-70725-8. Sci Rep. 2024. PMID: 39223211 Free PMC article.
References
-
- WHO . COVID-19 timeline 2020. Available at: https://www.who.int/news-room/detail/29-06-2020-covidtimeline.
-
- van Rooyen C, Brauer M, Swanepoel P, van den Berg S, van der Merwe C, van der Merwe M, et al. . Comparison of T-cell immune responses to SARS-CoV-2 spike (S) and nucleocapsid (N) protein using an in-house flow-cytometric assay in laboratory employees with and without previously confirmed COVID-19 in South Africa: nationwide cross-sectional study. J Clin Pathol (2022) 76(6):384–390. doi: 10.1136/jclinpath-2021-207556 - DOI - PMC - PubMed
-
- Nomah DK, Reyes-Uruena J, Llibre JM, Ambrosioni J, Ganem FS, Miro JM, et al. . HIV and SARS-CoV-2 co-infection: epidemiological, clinical features, and future implications for clinical care and public health for people living with HIV (PLWH) and HIV most-at-risk groups. Curr HIV/AIDS Rep (2022) 19(1):17–25. doi: 10.1007/s11904-021-00596-5 - DOI - PMC - PubMed
Publication types
MeSH terms
Substances
Supplementary concepts
Grants and funding
LinkOut - more resources
Full Text Sources
Medical
Research Materials
Miscellaneous