

Effects of temperature acclimation on the upper thermal tolerance of two Arctic fishes
- PMID: 38343721
- PMCID: PMC10858409
- DOI: 10.1093/conphys/coae001
Effects of temperature acclimation on the upper thermal tolerance of two Arctic fishes
Abstract
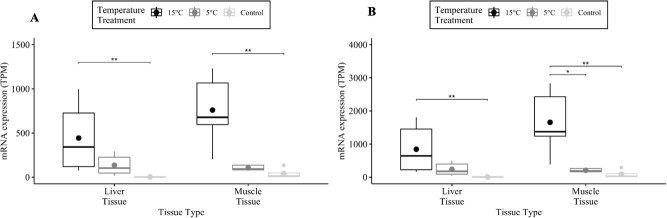
The thermally dynamic nearshore Beaufort Sea, Alaska, is experiencing climate change-driven temperature increases. Measuring thermal tolerance of broad whitefish (Coregonus nasus) and saffron cod (Eleginus gracilis), both important species in the Arctic ecosystem, will enhance understanding of species-specific thermal tolerances. The objectives of this study were to determine the extent that acclimating broad whitefish and saffron cod to 5°C and 15°C changed their critical thermal maximum (CTmax) and HSP70 protein and mRNA expression in brain, muscle and liver tissues. After acclimation to 5°C and 15°C, the species were exposed to a thermal ramping rate of 3.4°C · h-1 before quantifying the CTmax and HSP70 protein and transcript concentrations. Broad whitefish and saffron cod acclimated to 15°C had a significantly higher mean CTmax (27.3°C and 25.9°C, respectively) than 5°C-acclimated fish (23.7°C and 23.2°C, respectively), which is consistent with trends in CTmax between higher and lower acclimation temperatures. There were species-specific differences in thermal tolerance with 15°C-acclimated broad whitefish having higher CTmax and HSP70 protein concentrations in liver and muscle tissues than saffron cod at both acclimation temperatures. Tissue-specific differences were quantified, with brain and muscle tissues having the highest and lowest HSP70 protein concentrations, respectively, for both species and acclimation temperatures. The differences in broad whitefish CTmax between the two acclimation temperatures could be explained with brain and liver tissues from 15°C acclimation having higher HSP70a-201 and HSP70b-201 transcript concentrations than control fish that remained in lab-acclimation conditions of 8°C. The shift in CTmax and HSP70 protein and paralogous transcripts demonstrate the physiological plasticity that both species possess in responding to two different acclimation temperatures. This response is imperative to understand as aquatic temperatures continue to elevate.
Keywords: Arctic teleosts; HSP70 expression; critical thermal maximum; thermal plasticity.
© The Author(s) 2024. Published by Oxford University Press and the Society for Experimental Biology.
Conflict of interest statement
These authors declare no conflict of interest.
Figures


Similar articles
-
Temperature tolerance and oxygen consumption of two South American tetras, Paracheirodon innessi and Hyphessobrycon herbertaxelrodi.J Therm Biol. 2019 Dec;86:102434. doi: 10.1016/j.jtherbio.2019.102434. Epub 2019 Oct 10. J Therm Biol. 2019. PMID: 31789229
-
Influence of acclimation temperature on the induction of heat-shock protein 70 in the catfish Horabagrus brachysoma (Günther).Fish Physiol Biochem. 2012 Aug;38(4):919-927. doi: 10.1007/s10695-011-9578-9. Epub 2011 Dec 6. Fish Physiol Biochem. 2012. PMID: 22143442
-
Mathematical modeling and analysis of the heat shock protein response during thermal stress in fish and HeLa cells.Math Biosci. 2022 Apr;346:108692. doi: 10.1016/j.mbs.2021.108692. Epub 2021 Sep 3. Math Biosci. 2022. PMID: 34481823
-
Short-term acclimation dynamics in a coldwater fish.J Therm Biol. 2023 Feb;112:103482. doi: 10.1016/j.jtherbio.2023.103482. Epub 2023 Jan 14. J Therm Biol. 2023. PMID: 36796924
-
Acclimation capacity to global warming of amphibians and freshwater fishes: Drivers, patterns, and data limitations.Glob Chang Biol. 2024 May;30(5):e17318. doi: 10.1111/gcb.17318. Glob Chang Biol. 2024. PMID: 38771091
References
-
- Abràmoff MD, Magalhães PJ, Ram SJ (2004) Image processing with ImageJ. Biophotonics Int 11: 36–42.
-
- Ahlmann-Eltze C, Patil I (2021) Ggsignif: R package for displaying significance brackets for 'ggplot2'. PsyArxiv . 10.31234/osf.io/7awm6. - DOI
-
- Becker CD, Genoway RG (1979) Evaluation of the critical thermal maximum for determining thermal tolerance of freshwater fish. Environ Biol Fishes 4: 245–256. 10.1007/BF00005481. - DOI
-
- Beitinger TL, Bennett WA, Mccauley RW (2000) Temperature tolerances of North American freshwater fishes exposed to dynamic changes in temperature. Environ Biol Fishes 58: 237–275. 10.1023/A:1007676325825. - DOI
LinkOut - more resources
Full Text Sources
Miscellaneous
