

Effects of incubation temperature on the upper thermal tolerance of the imperiled longfin smelt (Spirinchus thaleichthys)
- PMID: 38343722
- PMCID: PMC10858410
- DOI: 10.1093/conphys/coae004
Effects of incubation temperature on the upper thermal tolerance of the imperiled longfin smelt (Spirinchus thaleichthys)
Abstract
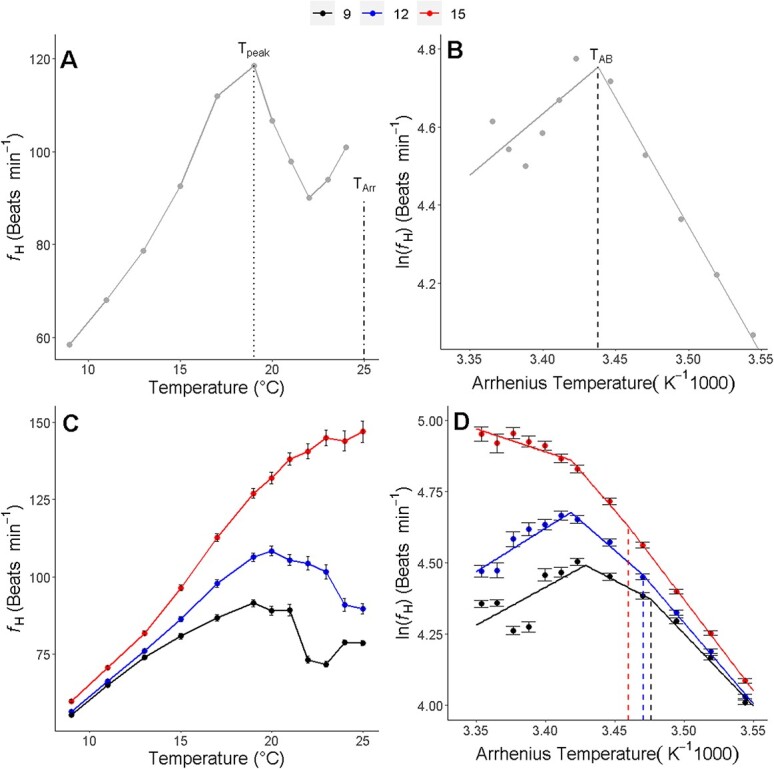
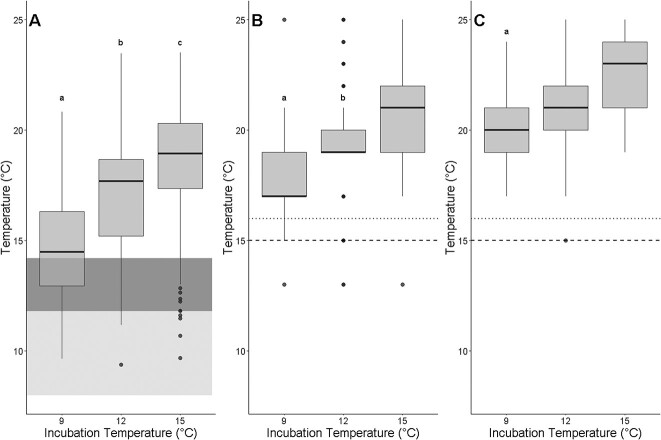
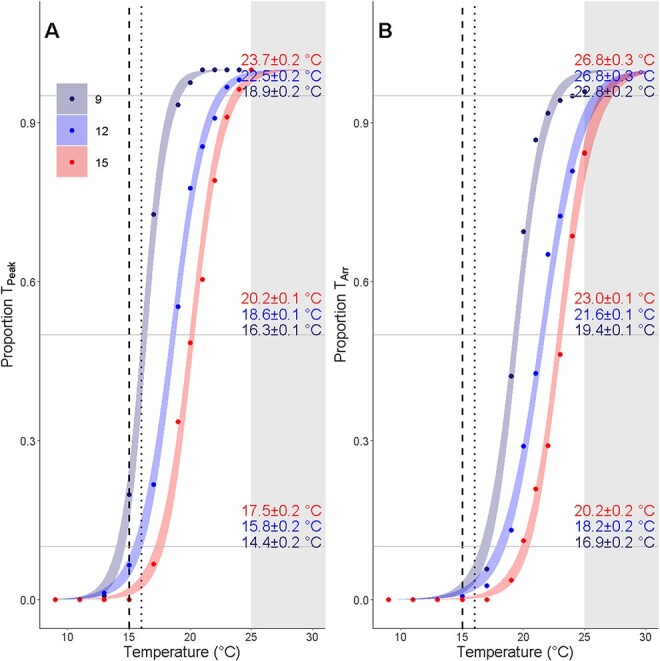
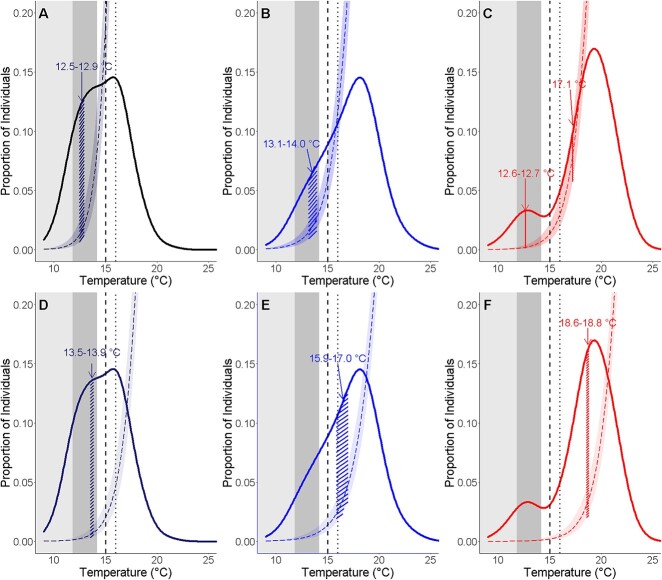
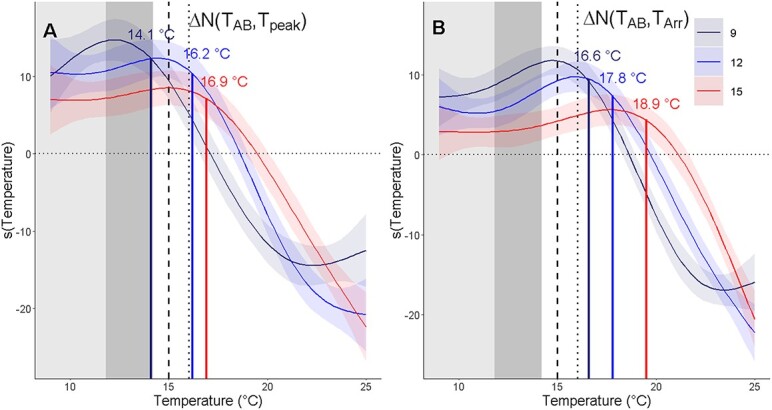
Upper thermal limits in many fish species are limited, in part, by the heart's ability to meet increased oxygen demand during high temperatures. Cardiac plasticity induced by developmental temperatures can therefore influence thermal tolerance. Here, we determined how incubation temperatures during the embryonic stage influence cardiac performance across temperatures during the sensitive larval stage of the imperiled longfin smelt. We transposed a cardiac assay for larger fish to newly hatched larvae that were incubated at 9°C, 12°C or 15°C. We measured heart rate over increases in temperature to identify the Arrhenius breakpoint temperature (TAB), a proxy for thermal optimum and two upper thermal limit metrics: temperature when heart rate is maximized (Tpeak) and when cardiac arrhythmia occurs (TArr). Higher incubation temperatures increased TAB, Tpeak and TArr, but high individual variation in all three metrics resulted in great overlap of individuals at TAB, Tpeak and TArr across temperatures. We found that the temperatures at which 10% of individuals reached Tpeak or TArr and temperatures at which number of individuals at TAB relative to Tpeak (ΔN(TAB,Tpeak)) was maximal, correlated more closely with upper thermal limits and thermal optima inferred from previous studies, compared to the mean values of the three cardiac metrics of the present study. Higher incubation temperatures increased the 10% Tpeak and TArr thresholds but maximum ΔN(TAB,Tpeak) largely remained the same, suggesting that incubation temperatures modulate upper thermal limits but not Topt for a group of larvae. Overall, by measuring cardiac performance across temperatures, we defined upper thermal limits (10% thresholds; Tpeak, 14.4-17.5°C; TArr, 16.9-20.2°C) and optima (ΔN(TAB,Tpeak), 12.4-14.4°C) that can guide conservation strategies for longfin smelt and demonstrated the potential of this cardiac assay for informing conservation plans for the early life stages of fish.
Keywords: Arrhenius breakpoint; San Francisco Estuary; cardiac performance; climate change; heart rate; larvae; thermal performance.
© The Author(s) 2024. Published by Oxford University Press and the Society for Experimental Biology.
Conflict of interest statement
The authors have no conflicts of interest to declare.
Figures
Similar articles
-
Physiological response of longfin smelt to changing temperatures and turbidities.Conserv Physiol. 2024 Dec 14;12(1):coae081. doi: 10.1093/conphys/coae081. eCollection 2024. Conserv Physiol. 2024. PMID: 39678703 Free PMC article.
-
Thermal optima and tolerance in the eurythermic goldfish (Carassius auratus): relationships between whole-animal aerobic capacity and maximum heart rate.Physiol Biochem Zool. 2014 Sep-Oct;87(5):599-611. doi: 10.1086/677317. Epub 2014 Aug 19. Physiol Biochem Zool. 2014. PMID: 25244373
-
Mechanisms of cardiac collapse at high temperature in a marine teleost (Girella nigrians).Comp Biochem Physiol A Mol Integr Physiol. 2023 Dec;286:111512. doi: 10.1016/j.cbpa.2023.111512. Epub 2023 Sep 17. Comp Biochem Physiol A Mol Integr Physiol. 2023. PMID: 37726058
-
Effects of high temperatures on threatened estuarine fishes during periods of extreme drought.J Exp Biol. 2016 Jun 1;219(Pt 11):1705-16. doi: 10.1242/jeb.134528. J Exp Biol. 2016. PMID: 27252456
-
Does oxygen limit thermal tolerance in arthropods? A critical review of current evidence.Comp Biochem Physiol A Mol Integr Physiol. 2016 Feb;192:64-78. doi: 10.1016/j.cbpa.2015.10.020. Epub 2015 Oct 24. Comp Biochem Physiol A Mol Integr Physiol. 2016. PMID: 26506130 Free PMC article. Review.
Cited by
-
Physiological response of longfin smelt to changing temperatures and turbidities.Conserv Physiol. 2024 Dec 14;12(1):coae081. doi: 10.1093/conphys/coae081. eCollection 2024. Conserv Physiol. 2024. PMID: 39678703 Free PMC article.
References
-
- Allen-Ankins S, Stoffels RJ (2017) Contrasting fundamental and realized niches: two fishes with similar thermal performance curves occupy different thermal habitats. Freshw Sci 36: 635–652. 10.1086/693134. - DOI
-
- Auer SK, Salin K, Rudolf AM, Anderson GJ, Metcalfe NB (2015a) The optimal combination of standard metabolic rate and aerobic scope for somatic growth depends on food availability. Funct Ecol 29: 479–486. 10.1111/1365-2435.12396. - DOI
