. 2023 Oct 12;17(2):e13604.
doi: 10.1111/eva.13604. eCollection 2024 Feb.

DNA methylation and transcriptome analysis reveal epigenomic differences among three macaque species

Affiliations

DNA methylation and transcriptome analysis reveal epigenomic differences among three macaque species

Jiao Wang et al. Evol Appl. .

Abstract

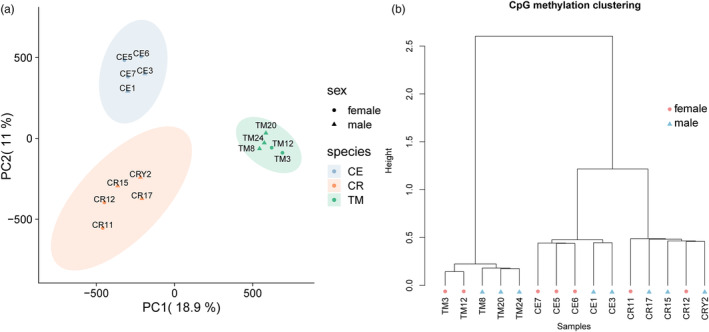
Macaques (genus Macaca) are the most widely distributed non-human primates, and their evolutionary history, gene expression profiles, and genetic differences have been extensively studied. However, the DNA methylomes of macaque species are not available in public databases, which hampers understanding of epigenetic differences among macaque species. Epigenetic modifications can potentially affect development, physiology, behavior, and evolution. Here, we investigated the methylation patterns of the Tibetan macaque (M. thibetana; TM), Chinese rhesus macaque (M. mulatta lasiota; CR), and crab-eating macaque (M. fascicularis; CE) through whole-genome bisulfite sequencing from peripheral blood. We compared genome-wide methylation site information for the three species. We identified 12,128 (CR vs. CE), 59,165 (CR vs. TM), and 39,751 (CE vs. TM) differentially methylated regions (DMRs) in the three macaques. Furthermore, we obtained the differentially expressed genes (DEGs) among the three macaque species. The differences between CR and CE were smaller at both the methylome and transcriptome levels than compared with TM (CR vs. TM and CE vs. TM). We also found a change in the density of single nucleotide mutations in DMRs relative to their flanking regions, indicating a potential mechanism through which genomic alterations may modulate methylation landscapes, thereby influencing the transcriptome. Functional enrichment analyses showed the DMR-related genes were enriched in developmental processes and neurological functions, such as the growth hormone-related pathway, insulin secretion pathway, thyroid hormone synthesis pathway, morphine addiction, and GABAergic synapses. These differences may be associated with variations in physiology and habitat among the macaques. Our study provides one of the first genome-wide comparisons of genetic, gene expression, and epigenetic variations across different macaques. Our results should facilitate further research on comparative genomic and genetic differences in macaque species.

Keywords: DNA methylation; Macaca; epigenetics; gene expression; neuro development.


Conflict of interest statement

The authors declare that they have no competing interests.

Figures

FIGURE 1
FIGURE 1
Display of overall methylation pattern and cluster analysis of CpG locus information. (a) PCA of CpG site methylation information. (b) Cluster analysis performed based on the methylation information of CpG sites. Distance method: “correlation”; Clustering method: “ward”.
FIGURE 2
FIGURE 2
Methylation levels of differential methylation regions (DMRs). (a–c) The percent methylation levels of DMR in groups (a) CR versus CE, (b) CR versus TM, and (c) CE versus TM were plotted. “t‐test, p < 0.001” means that methylation levels differ significantly between any two macaque species.(d–f) The DMR heatmap of group (d) CR versus CE, (e) CR versus TM, and (f) CE versus TM. Each heatmap shows 2000 DMRs randomly selected from each group of DMRs.
FIGURE 3
FIGURE 3
Distribution pattern of DMRs. (a) Circos plot of DMR density distribution. Different color areas in the figure represent the density distribution of DMRs in different groups. The red line in the outermost box represents the centromere. (b–d) The percentage of genomic regions overlapped with DMR. The different DMR groups from (b) to (d) are CR versus CE, CR versus TM, and CE versus TM.
FIGURE 4
FIGURE 4
Gene expression profiles of three rhesus species. (a) Results of cluster analysis of gene expression profiles in transcriptome samples. (b) Results of PCA of gene expression profiles in transcriptome samples. (c–e) The species‐specific DEGs of (c) CR versus CE, (d) CR versus TM, and (e) CEvsTM. The genes marked in the figure are DEGs with LogFC >10.
FIGURE 5
FIGURE 5
Combined analysis of multi‐omics. (a‐d) Methylation trends of 4 groups of CR genes with different expression intensities in the gene body and flanking regions. The corresponding expression intensity groups from (a) to (d) were TPM = 0, 0 < TPM ≤1, 1 < TPM ≤10, and TPM ≥10, respectively. (e–g) The multi‐omics differential gene. of (e) CR versus CE, (f) CR versus TM, and (g) CE versus TM. Part of the genes marked with asterisks were DMR‐related DEGs. (h) KEGG enrichment results of DMR‐related DEGs of CR versus TM. (i–k) SNV density of DMR and its flanking regions. In the figure, the abscissa origin DMR* represents DMR and ± 1 kb flanking sequence. ±1 ~ ±4 on the abscissa represents the 1 kb region from DMR ± 1 ~ ± 4 kb. The different SNV density groups from (i) to (k) are the hypermethylated DMGs of CR versus CE, CR versus TM, and CE versus TM.

Similar articles

Cited by

References

    1. Akalin, A. , Kormaksson, M. , Li, S. , Garrett‐Bakelman, F. E. , Figueroa, M. E. , Melnick, A. , & Mason, C. E. (2012). methylKit: A comprehensive R package for the analysis of genome‐wide DNA methylation profiles. Genome Biology, 13(10), R87. - PMC - PubMed
    1. Angers, B. , Castonguay, E. , & Massicotte, R. (2010). Environmentally induced phenotypes and DNA methylation: How to deal with unpredictable conditions until the next generation and after. Molecular Ecology, 19(7), 1283–1295. - PubMed
    1. Batista, T. M. , Garcia‐Martin, R. , Cai, W. , Konishi, M. , O’Neill, B. T. , Sakaguchi, M. , Kim, J. H. , Jung, D. Y. , Kim, J. K. , & Kahn, C. R. (2019). Multi‐dimensional transcriptional remodeling by physiological insulin in vivo. Cell Reports, 26(12), 3429–3443.e3423. - PMC - PubMed
    1. Bonkovsky, H. L. , Guo, J. T. , Hou, W. , Li, T. , Narang, T. , & Thapar, M. (2013). Porphyrin and heme metabolism and the porphyrias. Comprehensive Physiology, 3(1), 365–401. - PubMed
    1. Chalifoux, J. R. , & Carter, A. G. (2011). GABAB receptor modulation of synaptic function. Current Opinion in Neurobiology, 21(2), 339–344. - PMC - PubMed

LinkOut - more resources