

This is a preprint.
Radiomic Biomarkers of Locoregional Recurrence: Prognostic Insights from Oral Cavity Squamous Cell Carcinoma preoperative CT scans
- PMID: 38343846
- PMCID: PMC10854303
- DOI: 10.21203/rs.3.rs-3857391/v1
Radiomic Biomarkers of Locoregional Recurrence: Prognostic Insights from Oral Cavity Squamous Cell Carcinoma preoperative CT scans
Update in
-
Radiomic biomarkers of locoregional recurrence: prognostic insights from oral cavity squamous cell carcinoma preoperative CT scans.Front Oncol. 2024 Apr 23;14:1380599. doi: 10.3389/fonc.2024.1380599. eCollection 2024. Front Oncol. 2024. PMID: 38715772 Free PMC article.
Abstract
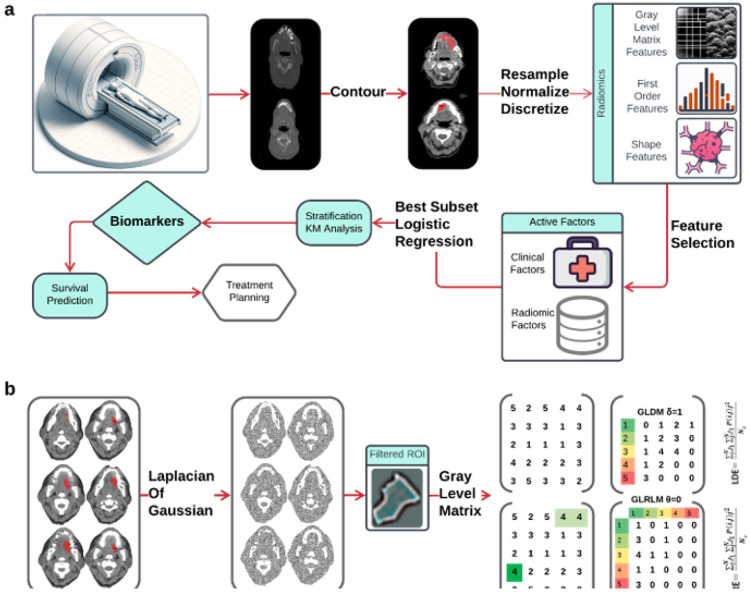
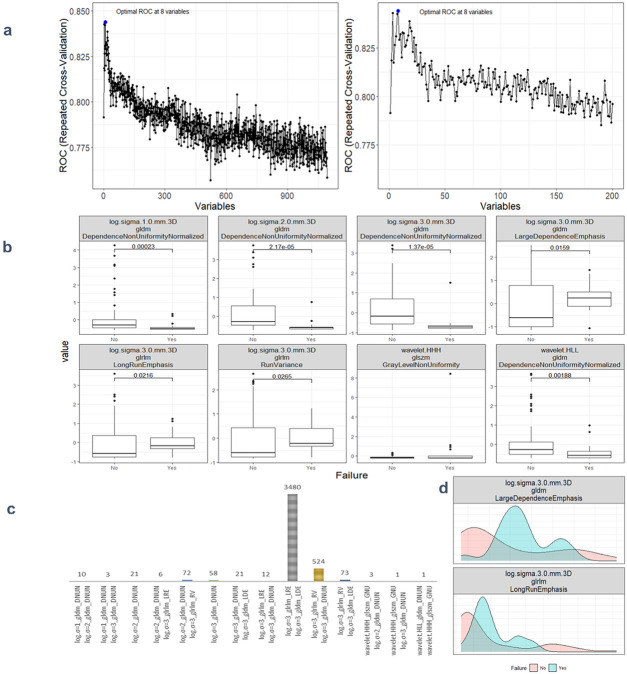
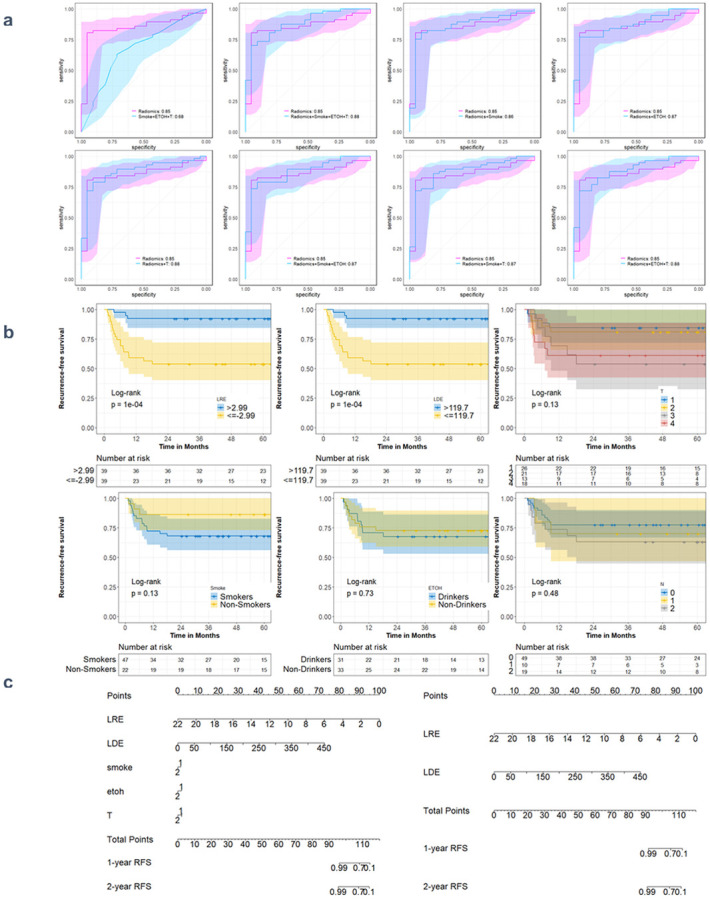
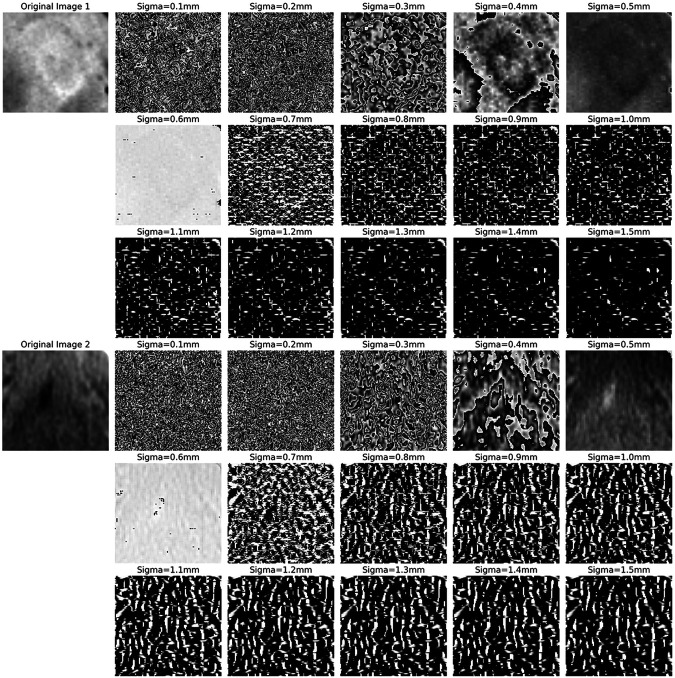
This study aimed to identify CT-based imaging biomarkers for locoregional recurrence (LR) in Oral Cavity Squamous Cell Carcinoma (OSCC) patients. Our study involved a retrospective review of 78 patients with OSCC who underwent surgical treatment at a single medical center. An approach involving feature selection and statistical model diagnostics was utilized to identify biomarkers. Two radiomics biomarkers, Large Dependence Emphasis (LDE) of the Gray Level Dependence Matrix (GLDM) and Long Run Emphasis (LRE) of the Gray Level Run Length Matrix (GLRLM) of the 3D Laplacian of Gaussian (LoG σ = 3), have demonstrated the capability to preoperatively distinguish patients with and without LR, exhibiting exceptional testing specificity (1.00) and sensitivity (0.82). The group with LRE > 2.99 showed a 3-year recurrence-free survival rate of 0.81, in contrast to 0.49 for the group with LRE ≤ 2.99. Similarly, the group with LDE > 120 showed a rate of 0.82, compared to 0.49 for the group with LDE ≤ 120. These biomarkers broaden our understanding of using radiomics to predict OSCC progression, enabling personalized treatment plans to enhance patient survival.
Figures
Similar articles
-
Radiomic biomarkers of locoregional recurrence: prognostic insights from oral cavity squamous cell carcinoma preoperative CT scans.Front Oncol. 2024 Apr 23;14:1380599. doi: 10.3389/fonc.2024.1380599. eCollection 2024. Front Oncol. 2024. PMID: 38715772 Free PMC article.
-
Identification of CT-based non-invasive radiomic biomarkers for overall survival prediction in oral cavity squamous cell carcinoma.Sci Rep. 2023 Dec 8;13(1):21774. doi: 10.1038/s41598-023-48048-x. Sci Rep. 2023. PMID: 38066047 Free PMC article.
-
Next-Generation Radiogenomics Sequencing for Prediction of EGFR and KRAS Mutation Status in NSCLC Patients Using Multimodal Imaging and Machine Learning Algorithms.Mol Imaging Biol. 2020 Aug;22(4):1132-1148. doi: 10.1007/s11307-020-01487-8. Mol Imaging Biol. 2020. PMID: 32185618
-
Identification of CT-based non-invasive Radiographic Biomarkers for Overall Survival Stratification in Oral Cavity Squamous Cell Carcinoma.Res Sq [Preprint]. 2023 Aug 23:rs.3.rs-3263887. doi: 10.21203/rs.3.rs-3263887/v1. Res Sq. 2023. Update in: Sci Rep. 2023 Dec 8;13(1):21774. doi: 10.1038/s41598-023-48048-x. PMID: 37674725 Free PMC article. Updated. Preprint.
-
Emerging histological and serological biomarkers in oral squamous cell carcinoma: Applications in diagnosis, prognosis evaluation and personalized therapeutics (Review).Oncol Rep. 2023 Dec;50(6):213. doi: 10.3892/or.2023.8650. Epub 2023 Oct 20. Oncol Rep. 2023. PMID: 37859591 Free PMC article. Review.
References
-
- Yuen APW, Wei WI, Wong YM, Tang KC. Elective neck dissection versus observation in the treatment of early oral tongue carcinoma. Head & Neck: Journal for the Sciences and Specialties of the Head and Neck 1997;19:583–8. - PubMed
-
- Contrera KJ, Huang AT, Shenson JA, Tang C, Roberts D, Myers JN, et al. Primary and recurrent regional metastases for lateralized oral cavity squamous cell carcinoma. Surgical Oncology 2022;44:101804. - PubMed
-
- Licitra L, Locati L, Bossi P. Head and neck cancer. Annals of Oncology 2004;15:iv267–73. - PubMed
-
- Duprez F, Berwouts D, De Neve W, Bonte K, Boterberg T, Deron P, et al. Distant metastases in head and neck cancer. Head & Neck 2017;39:1733–43. - PubMed
Publication types
Grants and funding
LinkOut - more resources
Full Text Sources
