. 2024 Jan 26:15:1295745.
doi: 10.3389/fendo.2024.1295745. eCollection 2024.

Difference of central foveal thickness measurement in patients with macular edema using optical coherence tomography in different display modes

Affiliations

Difference of central foveal thickness measurement in patients with macular edema using optical coherence tomography in different display modes

Dan Jouma Amadou Maman Lawali et al. Front Endocrinol (Lausanne). .

Abstract

Purpose: To assess the differences in the measurement of central foveal thickness (CFT) in patients with macular edema (ME) between two display modes (1:1 pixel and 1:1 micron) on optical coherence tomography (OCT).

Design: This is a retrospective, cross-sectional study.

Methods: Group A consisted of participants with well-horizontal OCT B-scan images and group B consisted of participants with tilted OCT B-scan. We manually measured the CFT under the two display modes, and the values were compared statistically using the paired t-test. Spearman's test was used to assess the correlations between the OCT image tilting angle (OCT ITA) and the differences in CFT measurement. The area under the curve (AUC) was calculated to define the OCT ITA cutoff for a defined CFT difference.

Results: In group A, the mean CFT in the 1:1 pixel display mode was 420.21 ± 130.61 µm, similar to the mean CFT of 415.27 ± 129.85 µm in the 1:1 micron display mode. In group B, the median CFT in the 1:1 pixel display mode is 409.00 μm (IQR: 171.75 μm) and 368.00 μm (IQR: 149.00 μm) in the 1:1 micron display mode. There were significant differences between the two display modes with the median (IQR) absolute difference and median (IQR) relative difference of 38.00 μm (75.00 μm) and 10.19% (21.91%) (all p = 0.01). The differences in CFT measurement between the two display modes were correlated with the OCT ITA (absolute differences, r = 0.88, p < 0.01; relative differences, r = 0.87, p < 0.01). The AUC for a predefined CFT difference was 0.878 (10 μm), 0.933 (20 μm), 0.938 (30 μm), 0.961 (40 μm), 0.962 (50 μm), and 0.970 (60 μm).

Conclusion: In patients with DM, when the OCT B-scan images were well-horizontal, manual CFT measurements under the two display modes were similar, but when the B-scan images were tilted, the CFT measurements were different under the two display modes, and the differences were correlated to the OCT ITA.

Keywords: central foveal thickness; display mode; macular edema; optical coherence tomography; optical coherence tomography image tilting angle.


Conflict of interest statement

The authors declare that the research was conducted in the absence of any commercial or financial relationships that could be construed as a potential conflict of interest.

Figures

Figure 1
Figure 1
Representative images of the central foveal thickness manual measurement in the two optical coherence tomography display modes (1:1 pixel display mode and 1:1 micron display mode) in group (B). (A) Central foveal thickness manual measurement in the 1:1 pixel display mode. (B) Central foveal thickness manual measurement in the 1:1 micron display mode. In the 1:1 pixel display mode, the central foveal thickness is 939 μm, and in the 1:1 micron display mode, it is 709 μm.
Figure 2
Figure 2
Representative images of the central foveal thickness manual measurement in the two OCT display modes (1:1 pixel display mode and 1:1 micron display mode) in group (A). (A) Central foveal thickness manual measurement in the 1:1 pixel display mode. (B) Central foveal thickness manual measurement in the 1:1 micron mode. In the 1:1 pixel display mode, the central foveal thickness is 461 μm, and in the 1:1 micron display mode, it is 459 μm.
Figure 3
Figure 3
Representative spectral-domain optical coherence tomography image of the central foveal thickness and the optical coherence tomography image tilting angle. Central foveal thickness is defined as the distance between the surface of the internal limiting membrane and the outer border of the retinal pigment epithelium at the foveal zone. Optical coherence tomography image tilting angle is the angle alpha between the line parallel to the edge of the optical coherence tomography image and the line tangent to the retinal pigment epithelium.
Figure 4
Figure 4
Area under the receiver operating characteristic (ROC) curve (AUC) and optical coherence tomography image tilting angle (OCT ITA) cutoff for a predefined central foveal thickness difference. As a result, the AUC of OCT ITA for a predefined central foveal thickness difference was 0.878 (10 μm), 0.933 (20 μm), 0.938 (30 μm), 0.961 (40 μm), 0.962 (50 μm), and 0.970 (60 μm).
Figure 5
Figure 5
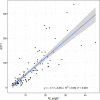
Linear regressions of the optical coherence tomography image tilting angle and the absolute differences in central foveal thickness manual measurement between the two display modes along with the regression equations. As a result, the regression equation of the optical coherence tomography image tilting angle and the absolute difference in central foveal thickness manual measurement are Y1 = −17.7 + 6.95x (R2 = 0.69, p < 0.001).
Figure 6
Figure 6
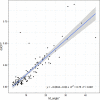
Linear regressions of the optical coherence tomography image tilting and the relative differences in central foveal thickness manual measurement between the two display modes along with the regression equations. As a result, the regression equation of the optical coherence tomography image tilting angle and the relative difference in central foveal thickness manual measurement are Y2 = −0.0634 + 0.02x (R2 = 0.75, p < 0.001).

References

    1. Yau JW, Rogers SL, Kawasaki R, Lamoureux EL, Kowalski JW, Bek T, et al. . Global prevalence and major risk factors of diabetic retinopathy. Diabetes Care (2012) 35(3):556–64. doi: 10.2337/dc11-1909 - DOI - PMC - PubMed
    1. Wang Z, Zhong Y, Yao M, Ma Y, Zhang W, Li C, et al. . Automated segmentation of macular edema for the diagnosis of ocular disease using deep learning method. Sci Rep (2021) 11(1):13392. doi: 10.1038/s41598-021-92458-8 - DOI - PMC - PubMed
    1. Forrester JV, Kuffova L, Delibegovic M. The role of inflammation in diabetic retinopathy. Front Immunol (2020) 11:583687. doi: 10.3389/fimmu.2020.583687 - DOI - PMC - PubMed
    1. Bae JH, Al-Khersan H, Yannuzzi NA, Hasanreisoglu M, Androudi S, Albini TA, et al. . Surgical therapy for macular edema: What we have learned through the decades. Ocul Immunol Inflamm (2019) 27(8):1242–50. doi: 10.1080/09273948.2019.1672194 - DOI - PubMed
    1. Tang F, Qin X, Lu J, Song P, Li M, Ma X. Optical coherence tomography predictors of short-term visual acuity in eyes with macular edema secondary to retinal vein occlusion treated with intravitreal conbercept. Retina (2020) 40(4):773–85. doi: 10.1097/iae.0000000000002444 - DOI - PubMed

Publication types

MeSH terms

LinkOut - more resources