. 2023 Oct 17;17(2):sfad265.
doi: 10.1093/ckj/sfad265. eCollection 2024 Feb.

Genetic and clinical characterization of familial renal glucosuria

Affiliations

Genetic and clinical characterization of familial renal glucosuria

Lubin Xu et al. Clin Kidney J. .

Abstract

Background: Familial renal glucosuria (FRG) is a hereditary disorder caused by variants in SLC5A2 encoding sodium-glucose cotransporter 2 (SGLT2). In this study, we aimed to characterize proximal tubule solute transport, glucagon secretion and the genotype-phenotype relationship in FRG patients.

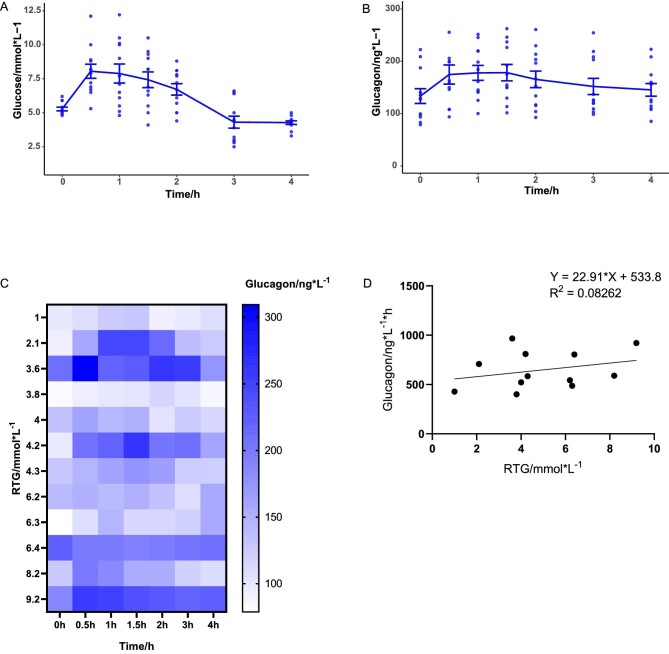
Methods: We sequenced SLC5A2 and PDZK1IP1 in 21 FRG patients and measured the renal threshold of glucose (RTG) in 15 patients. We built an open-source online calculator of RTG, evaluated the proximal tubule transport of amino acid, uric acid and phosphate, and explored glucagon secretion after glucose ingestion in FRG patients.

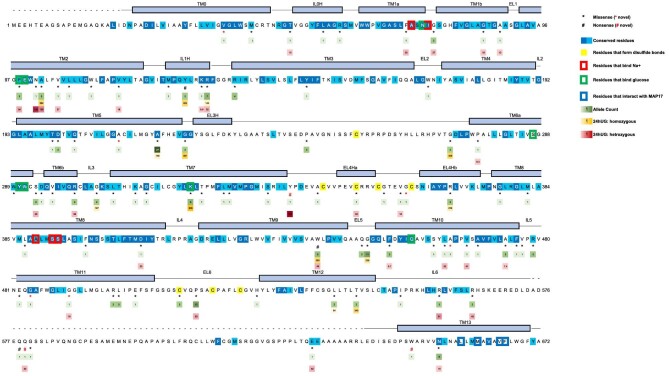
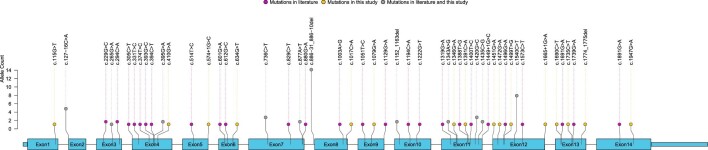
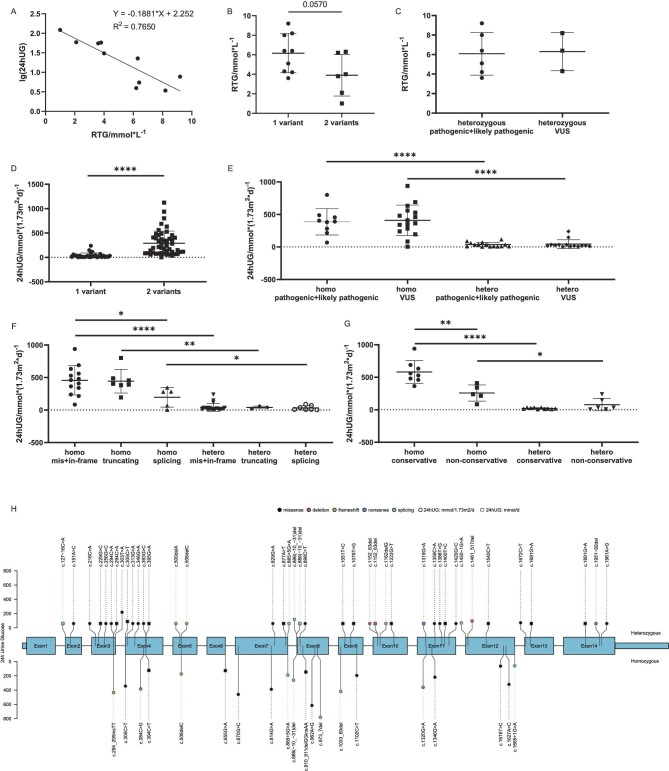
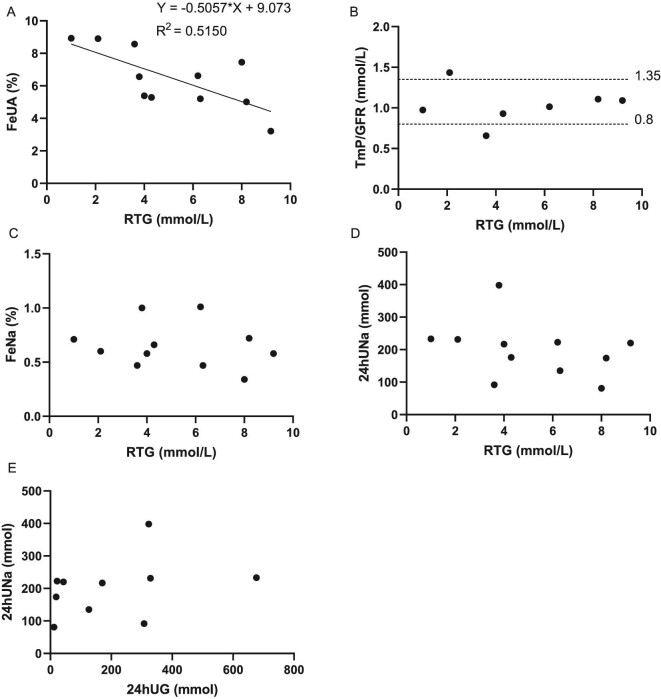
Results: We identified 12 novel SLC5A2 variants (G484D, R564W, A212S, c.574+1G>C, W649*, S592Cfs*6, Q579*, Y339*, V39F, G491E, A464E and G360D) in our cohort and yielded 111 SLC5A2 variants from literature review. RTG in our cohort ranged from 1.0 to 9.2 mmol/L. Patients with two SLC5A2 variants had lower RTG (3.9 vs 6.2 mmol/L) and higher 24-h urinary glucose excretion (24hUG) than single-variant carriers (291.0 vs 40.0 mmol/1.73 m2). Patients with homozygous missense or in-frame indels had mean 24hUG of 457.2 mmol/1.73 m2, comparable to those with homozygous truncating variants (445.0 mmol/1.73 m2) and significantly more than those with homozygous splicing variants (196.6 mmol/1.73 m2). Patients with homozygous missense variants involving conservative residues (582.0 mmol/1.73 m2) had more 24hUG than those with variants at non-conservative residues (257.6 mmol/1.73 m2). Four out of 14 tested patients had mild aminoaciduria. The RTG of FRG patients had no significant correlation to phosphate reabsorption but a potential negative correlation to the fractional excretion of uric acid. Postprandial suppression of glucagon secretion was absent in most FRG patients.

Conclusions: We built a comprehensive map showing the impact of SLC5A2 variant type and variant location on glucosuria severity. Our results highlighted the role of key residues in maintaining the transport function of SGLT2 and the functional link between glucosuria and reabsorption of amino acid and uric acid in FRG patients.

Keywords: SGLT2; SLC5A2; familial renal glucosuria; genotype–phenotype relationship.


Conflict of interest statement

All authors declare no conflicts of interest.

Figures

Figure 1:
Figure 1:
Variant distribution and glucosuria severity mapped onto SGLT2 protein domain structure (modified from Niu et al. [2]). Protein domains are plotted as deciphered by Niu et al. Alpha helices are shown as rectangles, and unmodeled residues are shown as dashed lines. Conserved residues are colored in different shades of blue. Residues that form disulfide bonds to stabilize the extracellular structure are highlighted in yellow. Residues that interact with MAP17 are marked with a blue box. Residues that bind Na+ and glucose are shown in red and green boxes, respectively. Missense and nonsense variants are marked with * and #, respectively. Black symbols (* and #) indicate variants previously reported in the literature, and red symbols indicate novel variants identified by this study. Allele count is listed below each variant and coloured in shades of green. 24hUG of homozygous and heterozygous carriers of each variant are visualized in different shades of gold and red, respectively. Both 24hUG corrected and not corrected by body surface area (in mmol/1.73 m2/day and mmol/day) are included in this figure.
Figure 2:
Figure 2:
SLC5A2 variants in Chinese FRG patients. Genetic variants found in Chinese FRG patients, represented by dots in different colours, were visualized on the SLC5A2 gene structure. The height of each node corresponds to the frequency of the variant. Magenta dots: variants from the literature review; yellow dots: variants identified in this study; grey dots: variants found both in our cohort and in the literature.
Figure 3:
Figure 3:
Genotype–phenotype relationship in FRG patients. (A) 24hUG is inversely related to RTG [lg(24hUG) = −0.1881 * RTG + 2.252, R2 = 0.7650]. (B) In our cohort, patients with two SLC5A2 variants had lower RTG than those with only one (mean RTG 3.9 ± 2.1 vs 6.2 ± 2.0 mmol/L, = .057). (C) In our cohort, the mean RTG of patients carrying heterozygous pathogenic/likely pathogenic (P/LP) variants was not significantly different from that of patients with heterozygous variants of uncertain significance (VUS) (6.08 ± 2.20 vs 6.30 ± 1.95 mmol/L, = .8897). (D) Literature review showed that 24hUG corrected by body surface area of patients carrying a single SLC5A2 variant were significantly lower than those carrying two variants (40.0 ± 51.5 vs 291.0 ± 248.0 mmol/1.73 m2, P < .0001). (E) Literature review showed that 24hUG of patients with P/LP variants were not significantly different from those with VUS variants (homozygous: 387.3 ± 202.7 vs 409.8 ± 234.6 mmol/1.73 m2, = .7599; heterozygous: 36.27 ± 34.20 vs 44.01 ± 66.55 mmol/1.73 m2, = .7924). Homo = homozygous, hetero = heterozygous. (F) Patients from the literature were divided according to the type of variant they carried: mis + in-frame (missense variants and in-frame indels), truncating (nonsense variants and frameshift variants) and splicing variants. Patients with homozygous splicing variants had significantly less 24hUG (196.6 ± 150.6 mmol/1.73 m2) than those with homozygous truncating (445.0 ± 182.5 mmol/1.73 m2) or mis + in-frame variants (457.2 ± 224.1 mmol/1.73m2, < .05). (G) Patients carrying missense variants were divided according to the conservativeness of the involved amino acid. Patients with homozygous variants at conservative residues had more 24hUG (582.0 ± 176.1 mmol/1.73 m2) than those with variants involving non-conservative residues (257.6 ± 124.3 mmol/1.73 m2, < 0.01). (H) 24hUG mapped on the SLC5A2 gene structure. Each node represents one variant, and the node's height corresponds to an average of 24hUG of FRG patients carrying this variant. Nodes on the top: heterozygotes; nodes on the bottom: homozygotes. The colour of the nodes represents variant types (black: missense variants; pink: in-frame indels; green: frameshift indels; blue: nonsense variants; cyan: splicing variants). Circles: 24hUG normalized by body surface area (mmol/1.73 m2/day); squares: 24hUG in mmol/day.
Figure 4:
Figure 4:
Phosphate and UA reabsorption in the proximal tubule and sodium excretion of patients with different RTG levels. (A) FeUA seems to negatively correlate with RTG (FeUA = −0.5057 * RTG + 9.073, R2 = 0.5150). (B) One patient had slightly decreased TmP/GFR, and one patient had slightly increased TmP/GFR. The rest of the patients had TmP/GFR within the normal range (0.8–1.35 mmol/L). No correlation was observed between TmP/GFR and RTG. (C) FeNa showed no correlation with RTG. (D, E) The data did not show any correlation between sodium excretion (24hUNa) and glucose excretion (RTG or 24hUG).
Figure 5:
Figure 5:
The relationship between glucagon secretion and RTG. Plasma glucose (A) and glucagon (B) levels were sampled in FRG patients during a 4-h OGTT (mean ± standard error). (C) Heatmap visualizing the relationship between glucagon levels and RTG. Each row represents an FRG patient arranged in the order of RTG, and each column represents a time point in the OGTT. Glucagon levels are represented with different shades of colour. (D) No significant correlation was observed between the area under the curve (AUC) of the glucagon–time curve and RTG.

References

    1. Santer R, Kinner M, Lassen CLet al. . Molecular analysis of the SGLT2 gene in patients with renal glucosuria. J Am Soc Nephrol 2003;14:2873–82. 10.1097/01.ASN.0000092790.89332.D2 - DOI - PubMed
    1. Niu Y, Liu R, Guan Cet al. . Structural basis of inhibition of the human SGLT2-MAP17 glucose transporter. Nature 2022;601:280–4. 10.1038/s41586-021-04212-9 - DOI - PubMed
    1. Wright EM, Loo DD, Hirayama BA.. Biology of human sodium glucose transporters. Physiol Rev 2011;91:733–94. 10.1152/physrev.00055.2009 - DOI - PubMed
    1. Ghezzi C, Loo DDF, Wright EM.. Physiology of renal glucose handling via SGLT1, SGLT2 and GLUT2. Diabetologia 2018;61:2087–97. 10.1007/s00125-018-4656-5 - DOI - PMC - PubMed
    1. van den Heuvel LP, Assink K, Willemsen Met al. . Autosomal recessive renal glucosuria attributable to a mutation in the sodium glucose cotransporter (SGLT2). Hum Genet 2002;111:544–7. 10.1007/s00439-002-0820-5 - DOI - PubMed