. 2023 Dec;2(12):1277-1290.
doi: 10.1038/s44161-023-00388-7. Epub 2023 Dec 5.

Bone marrow adipocytes fuel emergency hematopoiesis after myocardial infarction

Affiliations

Bone marrow adipocytes fuel emergency hematopoiesis after myocardial infarction

Shuang Zhang et al. Nat Cardiovasc Res. 2023 Dec.

Abstract

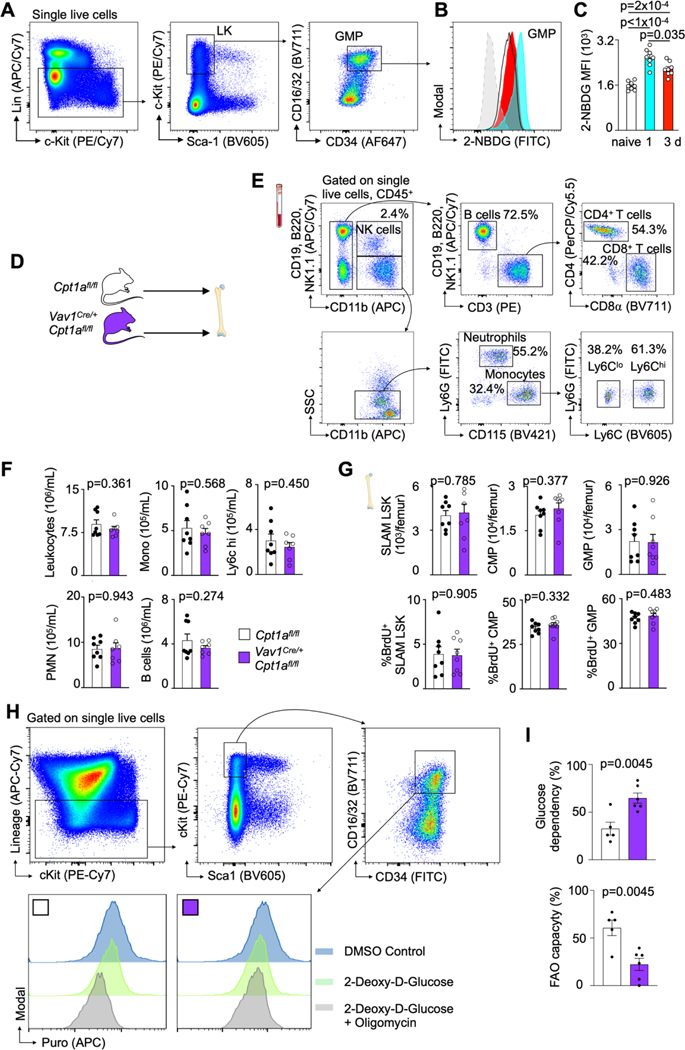
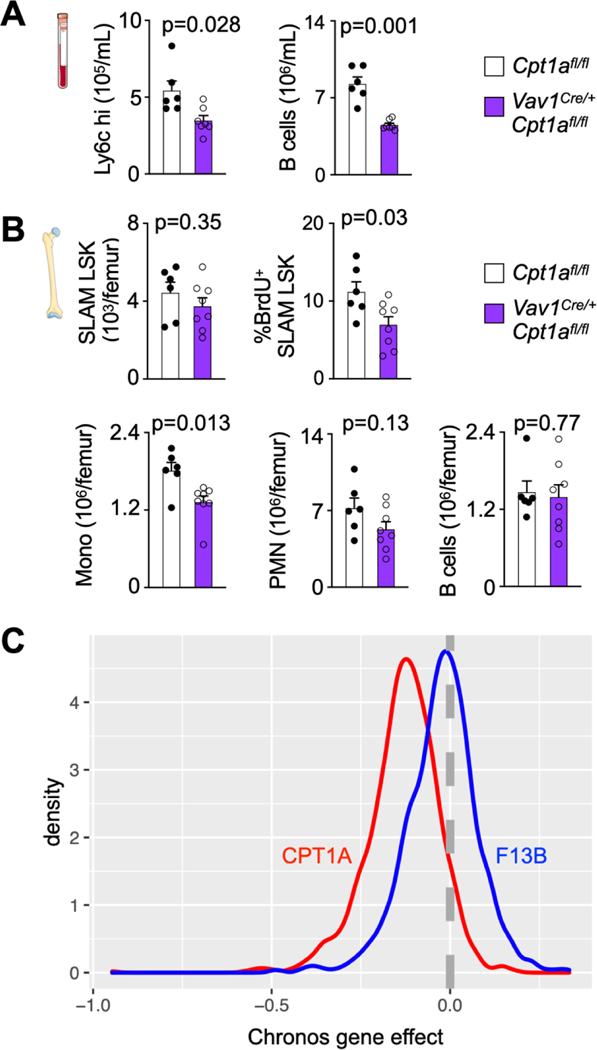
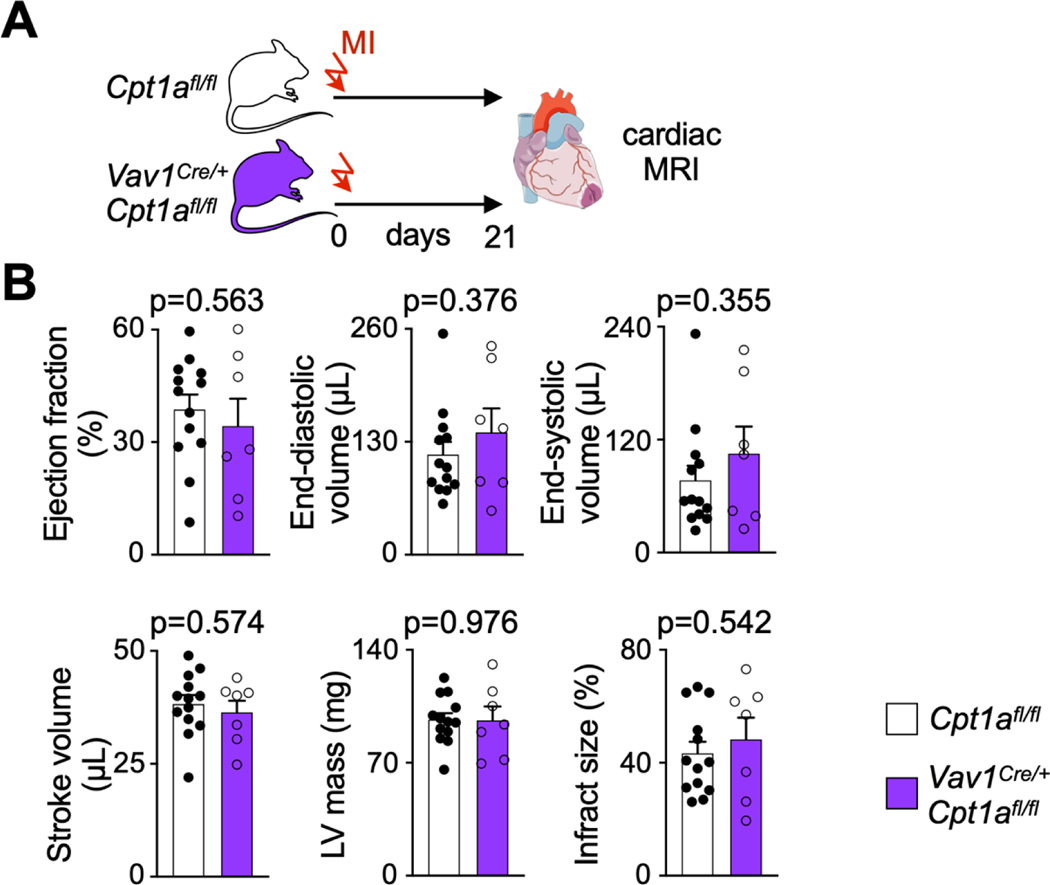
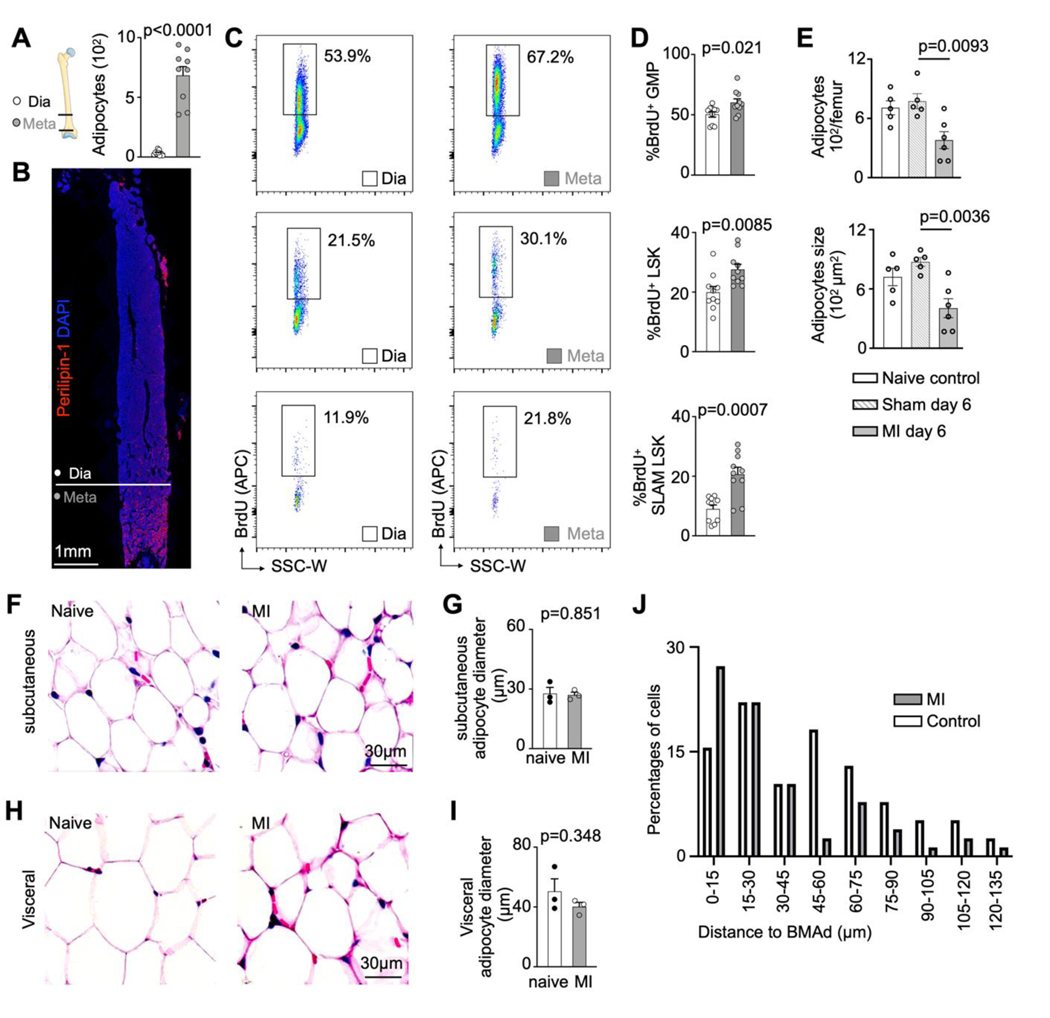
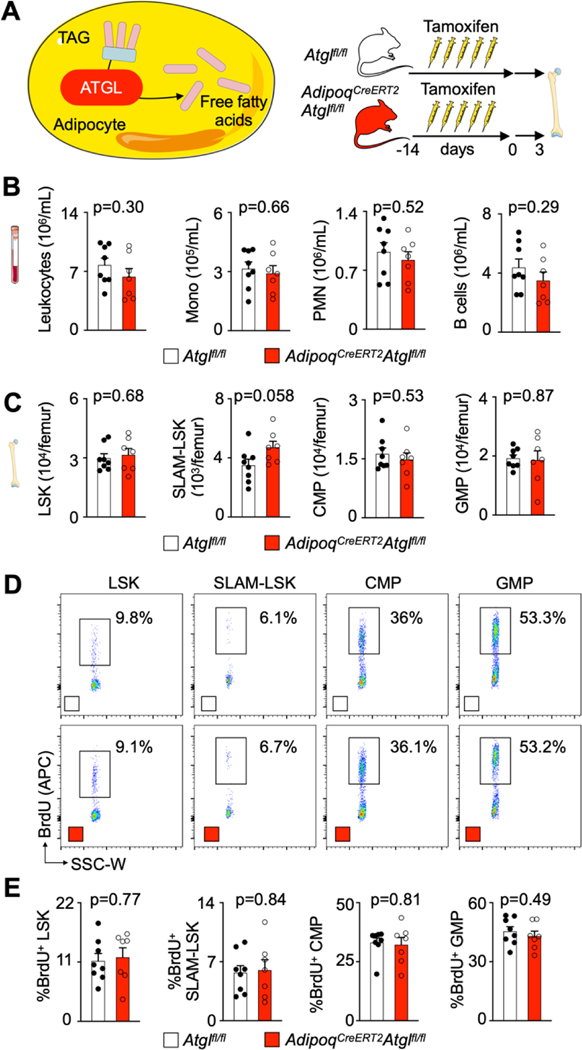
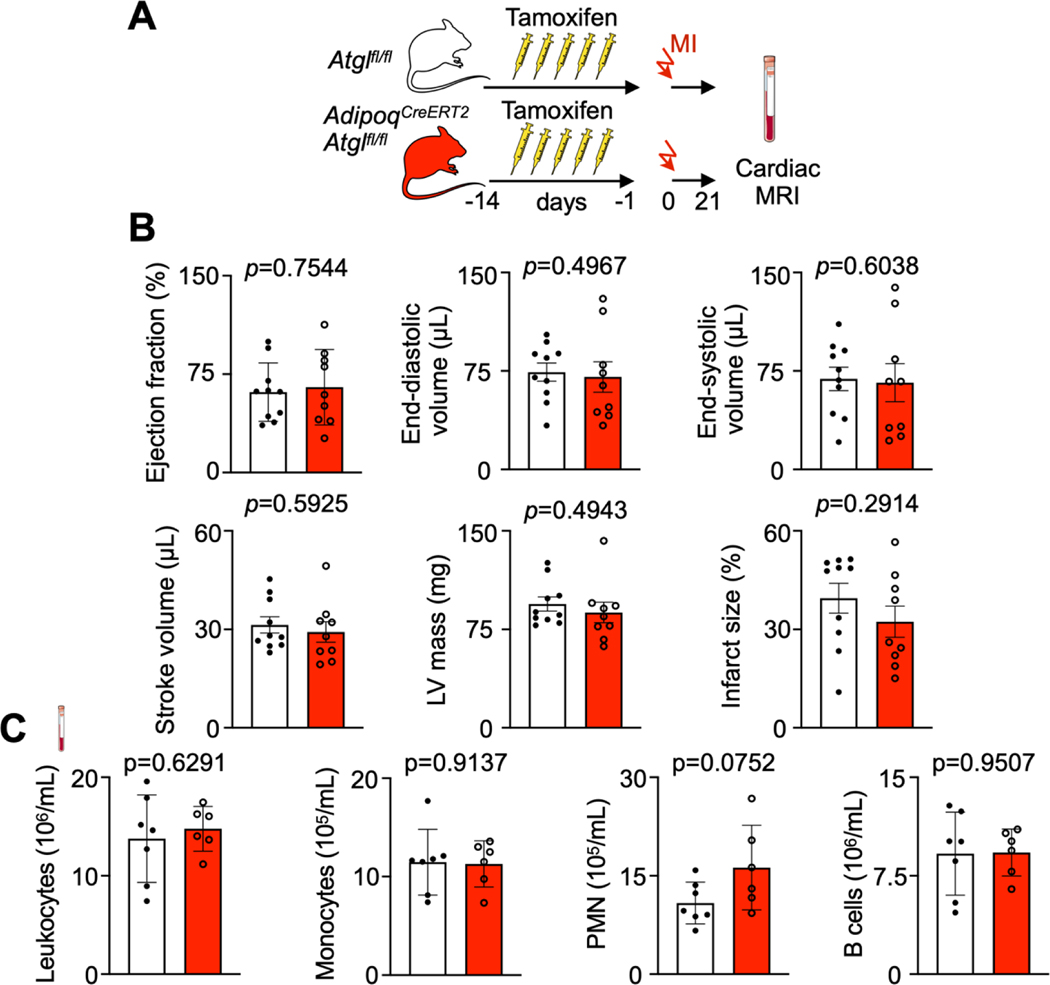
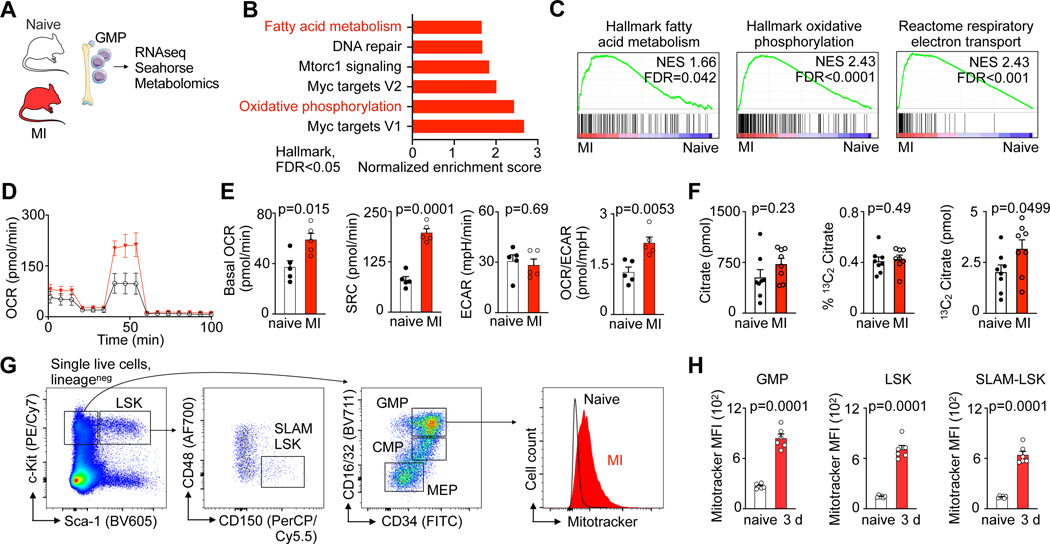
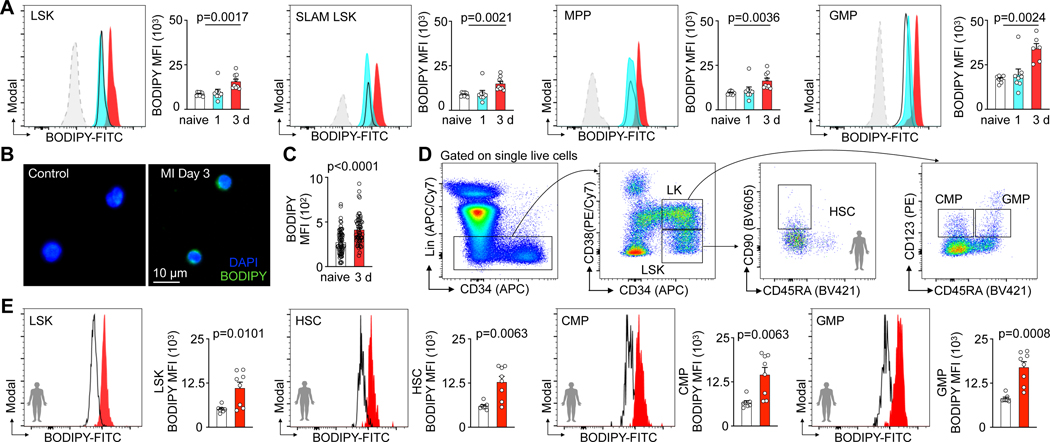
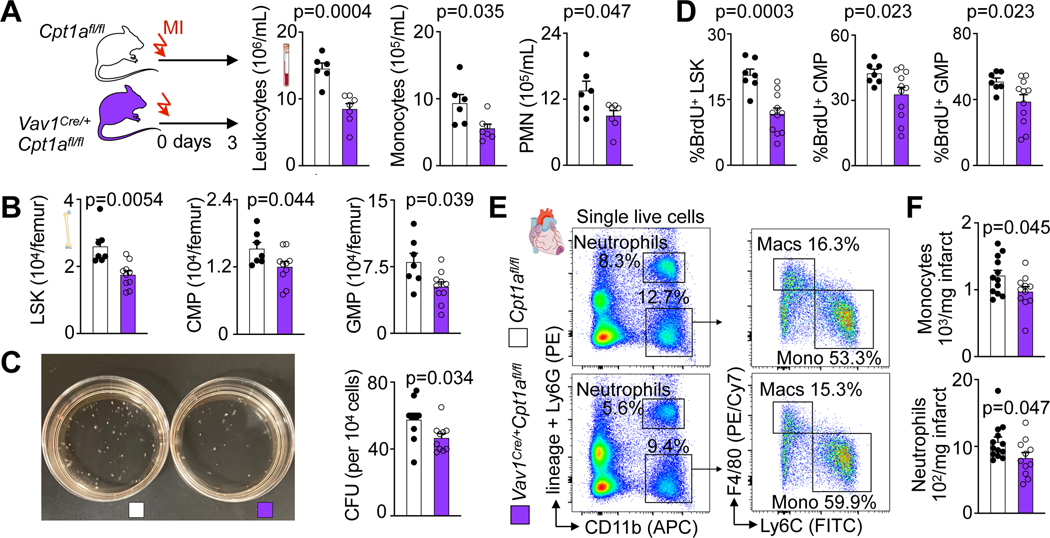
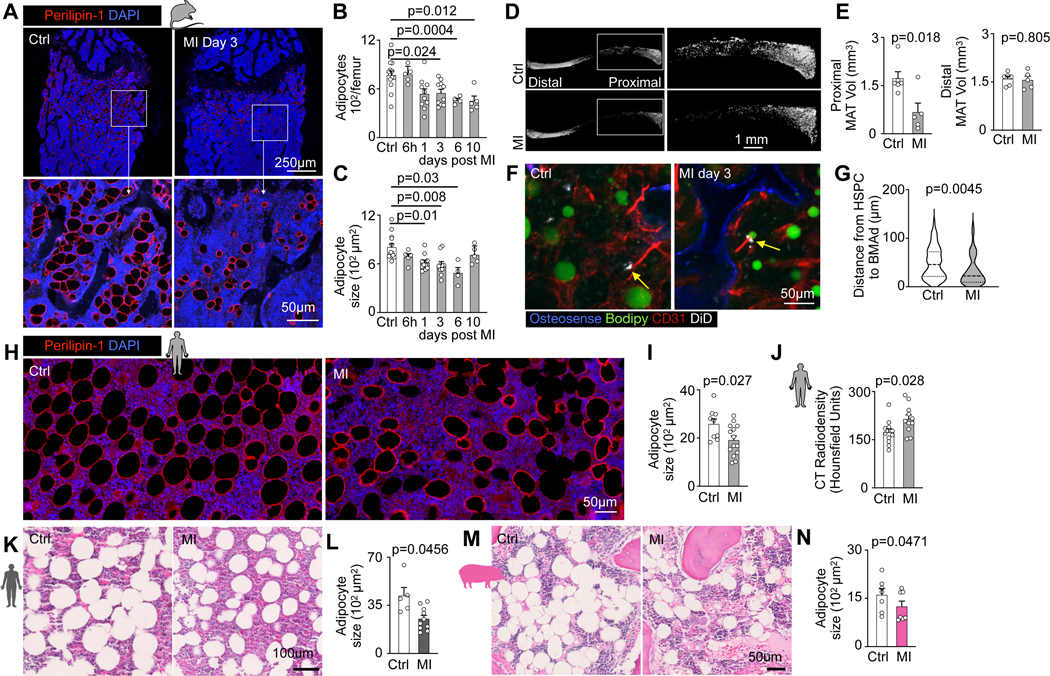
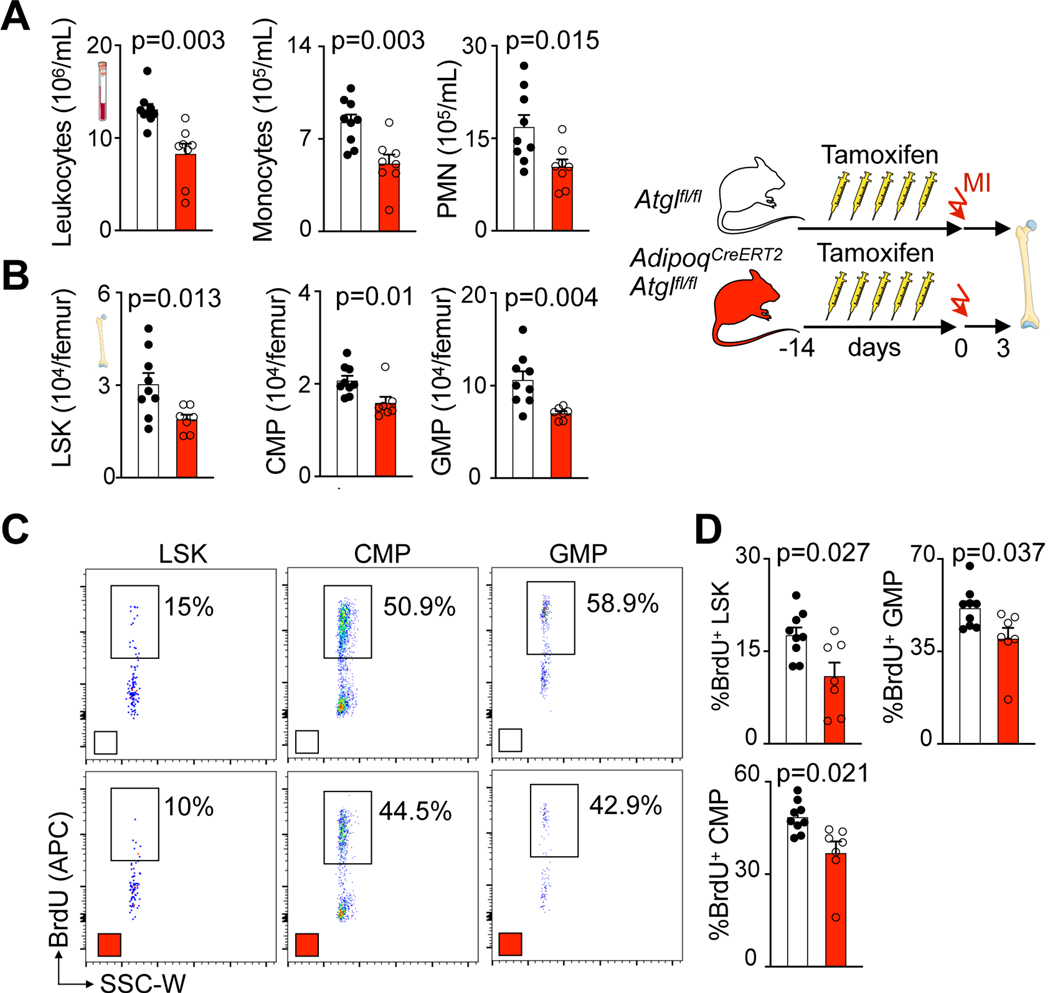
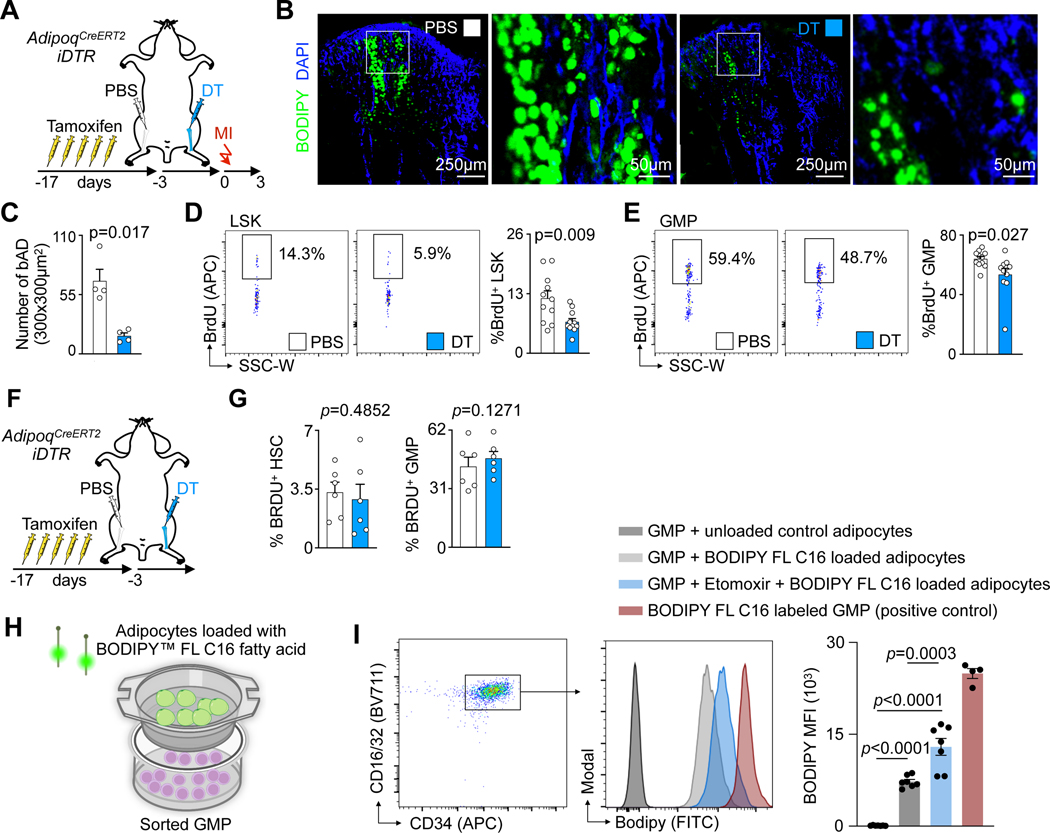
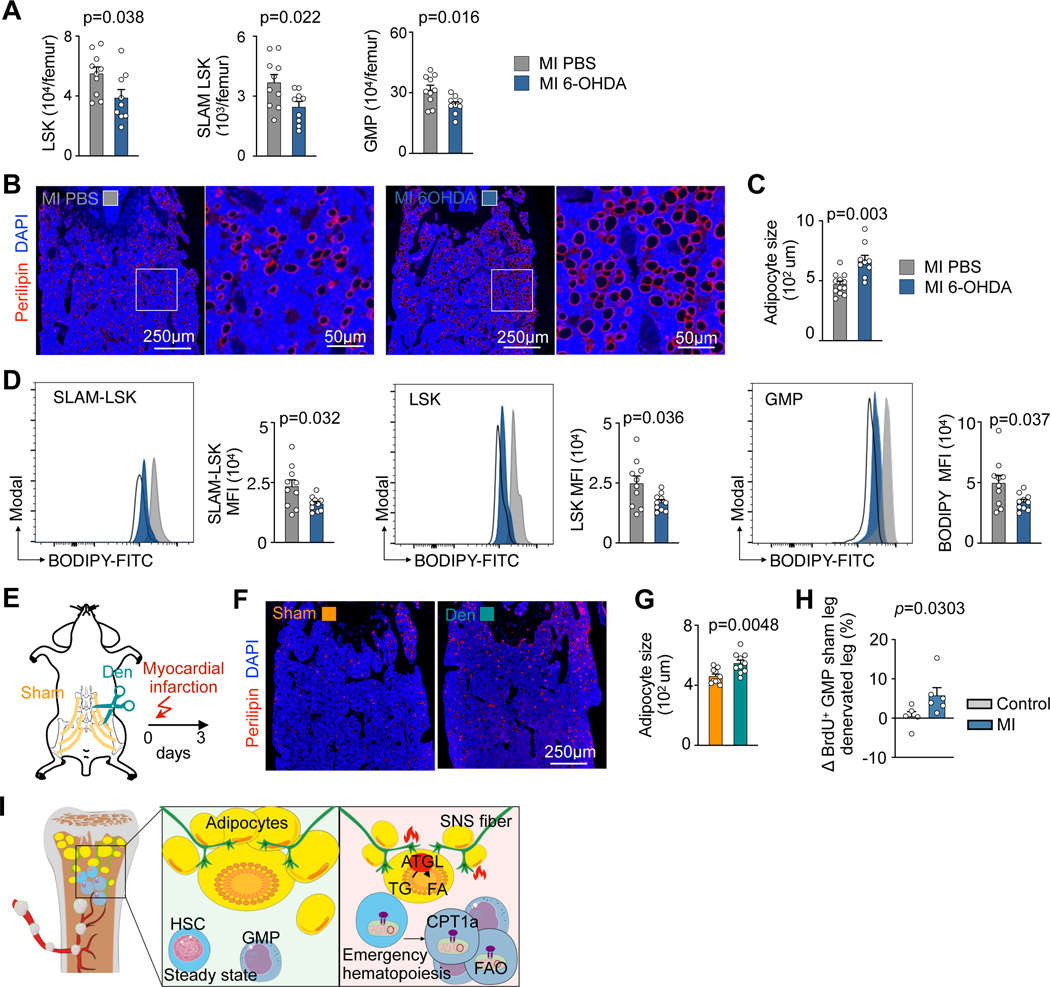
After myocardial infarction (MI), emergency hematopoiesis produces inflammatory myeloid cells that accelerate atherosclerosis and promote heart failure. Since the balance between glycolysis and mitochondrial metabolism regulates hematopoietic stem cell homeostasis, metabolic cues may influence emergency myelopoiesis. Here, we show in humans and female mice that hematopoietic progenitor cells increase fatty acid metabolism after MI. Blockade of fatty acid oxidation by deleting carnitine palmitoyltransferase (Cpt1A) in hematopoietic cells of Vav1Cre/+Cpt1Afl/fl mice limited hematopoietic progenitor proliferation and myeloid cell expansion after MI. We also observed reduced bone marrow adiposity in humans, pigs and mice following MI. Inhibiting lipolysis in adipocytes using AdipoqCreERT2Atglfl/fl mice or local depletion of bone marrow adipocytes in AdipoqCreERT2iDTR mice also curbed emergency hematopoiesis. Furthermore, systemic and regional sympathectomy prevented bone marrow adipocyte shrinkage after MI. These data establish a critical role for fatty acid metabolism in post-MI emergency hematopoiesis.

Keywords: Myocardial infarction; adipocytes; bone marrow; emergency hematopoiesis; fatty acid oxidation; lipolysis.


Conflict of interest statement

Competing interests statement All other authors declare no conflicts of interest, financial or otherwise.

Figures

Extended data Fig. 1 |
Extended data Fig. 1 |. Glucose uptake capacity of bone marrow GMP post MI and baseline phenotype in Vav1iCre+Cpt1Afl/fl mice
A, Representative flow cytometry plots, showing the gating strategy on GMP. B, Flow histograms and C, statistical analysis of 2-NBD glucose fluorescence in GMP isolated from naive controls and mice on day 1 and 3 post MI. Data are displayed as mean±SEM. (n=8 per time, Brown-Forsythe and Welsh Anova with Dunnett’s T3 multiple comparison, two independent experiments) D, Hematopoietic Cpt1a deficiency does not alter baseline leukocyte profile, Experimental design. E, PCR analysis of FACS-purified Vav+/+ and VavCre/+ for the presence of wildtype (Cpt1a+) and conditional undeleted (Cpt1afl) alleles. F, Gating strategy for blood leukocytes. G, Quantification of blood leukocytes in naive Cpt1afl/fl controls and Vav1iCre+Cpt1Afl/fl mice (n=8 Cpt1Afl/fl, n=8 Vav1iCre+Cpt1Afl/fl, two-tailed Welch’s t test, two independent experiments). H, Quantification of HSPC numbers and proliferation in naive Cpt1afl/fl controls and Vav1iCre+Cpt1Afl/fl mice (n=8 Cpt1Afl/fl, n=8 Vav1iCre+Cpt1Afl/fl, two-tailed Welch’s t test, two independent experiments). I, Representative flow cytometry plot, gating strategy on GMP and histogram for puromycin quantification. J, GMP glucose dependency and FAO capacity (n=5 Cpt1Afl/fl n=6 Vav1iCre+Cpt1Afl/fl, two-tailed unpaired t-test, two independent experiments). Data are displayed as mean±SEM.
Extended data Fig. 2 |
Extended data Fig. 2 |. Hematopoietic Cpt1a deficiency reduces hematopoiesis.
A, Quantification of blood leukocytes in Cpt1afl/fl controls and Vav1iCre+Cpt1Afl/fl mice on day 3 after MI (n=6 Cpt1Afl/fl, n=7 Vav1iCre+Cpt1Afl/fl, two-tailed Welch’s t test, three independent experiments). B, Bone marrow SLAM-LSK numbers and proliferation and leukocyte numbers in Cpt1afl/fl controls and Vav1iCre+Cpt1Afl/fl mice on day 3 after MI (n=6 Cpt1Afl/fl, n=8 Vav1iCre+Cpt1Afl/fl, two-tailed Welch’s t test, three independent experiments). Data are displayed as mean±SEM. C, Gene essentiality (Chronos) scores for CPT1A (red curve) and F13B (blue, a control gene expressed in hematopoietic cells).
Extended data Fig. 3 |
Extended data Fig. 3 |. Deletion of Cpt1a from HSPC and their progeny does not change post-MI outcomes 3 weeks later.
A, Experimental Outline. B, Left ventricular morphology and function measured by cardiac magnetic resonance imaging (MRI) 3 weeks after coronary ligation in Cpt1afl/fl controls and Vav1iCre+Cpt1Afl/fl mice (n=7 and 13, two-tailed unpaired t-tests, three independent experiments). Data are displayed as mean±SEM.
Extended data Fig. 4 |
Extended data Fig. 4 |. Expanded proliferation of hematopoietic stem and progenitor cells in the adipocyte-rich metaphysis after myocardial infarction.
A, Quantification of adipocytes in femur diaphysis versus metaphysis (n=9 mice, two-tailed paired t test, three independent experiments). Data are displayed as mean±SEM.B, Immunofluorescent staining of adipocytes in femur. C, Flow plots of BrdU incorporation into GMP, LSK and SLAM-LSK in the femur diaphysis versus metaphysis in mice on day 3 after MI. D, Quantification of GMP, LSK and SLAM-LSK proliferation in femur diaphysis versus metaphysis (n=10 mice for diaphysis, n=10 mice for metaphysis, two-tailed Welch’s t test, three independent experiments). Data are displayed as mean±SEM E, Quantification of adipocytes number and size on indicated days after surgery (n=5–6 per time, One-way ANOVA with Tukey’s multiple comparison tests, two independent experiments) Data are displayed as mean±SEM F, Hematoxylin and eosin (H&E) stain for subcutaneous adipocytes in control mice and on day 3 after MI. G, Quantification of subcutaneous adipocyte size in control mice and on day 3 after MI (n=20 fields of view for 3control mice, n=20 fields of view for3 mice with MI, two-tailed Welch’s t test). Data are displayed as mean±SEM H, H&E stain for visceral adipocytes in control mice and on day 3 after MI. H, Quantification of visceral adipocyte size in control mice and on day 3 after MI (n=20 fields of view for 3 control mice, n=20 fields of view for 3 mice with MI, two-tailed Welch’s t test). Data are displayed as mean±SEM. J, Percentage of counted labeled cells in the respective distance range of a bone marrow adipocyte in control and MI mice (78 cells counted in control and 61 in MI mice, three independent experiments).
Extended data Fig. 5 |
Extended data Fig. 5 |. Baseline hematopoiesis and leukocyte profile in AdipoqCreERT2Atglfl/fl mice.
A, Schematic depiction of ATGL-mediated lipolysis and experimental design. B, Quantification of blood leukocytes in Atglfl/fl controls and AdipoqCreERT2Atglfl/fl mice (n=8 Atglfl/fl, n=7 AdipoqCreERT2Atglfl/fl, two-tailed Welch’s t test, two independent experiments). C, Quantification of bone marrow SLAM-LSK, LSK, CMP and GMP numbers in Atglfl/fl controls and AdipoqCreERT2Atglfl/fl mice (n=8 Atglfl/fl, n=7 AdipoqCreERT2Atglfl/fl, two-tailed Welch’s t test, two independent experiments). D, Flow plots of Brdu incorporation into LSK, SLAM-LSK, CMP and GMP in Atglfl/fl controls and AdipoqCreERT2Atglfl/fl mice. E, Quantification of LSK, SLAM-LSK, CMP and GMP proliferation in Atglfl/fl controls and AdipoqCreERT2Atglfl/fl mice (n=8 Atglfl/fl, n=7 AdipoqCreERT2Atglfl/fl, two-tailed Welch’s t test, two independent experiments). Data are displayed as mean±SEM.
Extended data Fig. 6 |
Extended data Fig. 6 |. Reduced hematopoiesis and myocardial myeloid cell content in AdipoqCreERT2Atglfl/fl mice.
A, Bone marrow adipocyte immunofluorescence images stained with perilipin-1 in Atglfl/fl versus AdipoqCreERT2Atglfl/fl mice 3 days after MI. B, Quantification of adipocyte size (n=4 Atglfl/fl, n=6 AdipoqCreERT2Atglfl/fl, two-tailed Welch’s t test, three independent experiments). C, Quantification of blood leukocytes in Atglfl/fl controls and AdipoqCreERT2Atglfl/fl mice 3 days after MI (n=9 Atglfl/fl, n=9 AdipoqCreERT2Atglfl/fl, two-tailed Welch’s t test, three independent experiments). D, Quantification of bone marrow leukocytes in Atglfl/fl controls and AdipoqCreERT2Atglfl/fl mice 3 days after MI (n=9 Atglfl/fl, n=9 AdipoqCreERT2Atglfl/fl, two-tailed Welch’s t test, three independent experiments). E, Flow plots of infiltrated leukocytes in the hearts of Atglfl/fl controls and AdipoqCreERT2Atglfl/fl. F, Quantification of macrophages, monocytes and neutrophils in the myocardium of Atglfl/fl controls and AdipoqCreERT2Atglfl/fl mice 3 days after MI (n=9 Atglfl/fl, n=9 AdipoqCreERT2Atglfl/fl, two-tailed Welch’s t test, three independent experiments). Data are displayed as mean±SEM.
Extended data Fig. 7
Extended data Fig. 7. Deletion of Atgl from adipocytes does not change 3 week post-MI outcomes.
A, Experimental Outline. B, Left ventricular morphology and function measured by cardiac magnetic resonance imaging (MRI) 3 weeks after coronary ligation in Atglfl/fl controls and AdipoqCreERT2Atglfl/fl mice (n=9 and 10, Unpaired t-tests, two independent experiments). C, Quantification of blood leukocytes, monocytes, neutrophils (PMN) and B cells by flow cytometry 3 weeks after coronary ligation in Atglfl/fl controls and AdipoqCreERT2Atglfl/fl mice. (n=6 and 7, Unpaired t-tests). Data are displayed as mean±SEM.
Extended data Fig. 8.
Extended data Fig. 8.. Flow cytometry gating.
A, Gating strategy for lineage negative cells, used to gate on LK and LSK in Figure 1G. B, Gating strategy for single live cell used for human HSPC gating. C, Gating strategy for blood leukocytes. The gating on specific cell types is detailed in extended data figure 1E.
Fig. 1 |
Fig. 1 |. Myocardial infarction enhances fatty acid metabolism in hematopoietic stem and progenitor cells.
A, Experimental design. B, Hallmark gene sets significantly (FDR<0.05) enriched in granulocyte monocyte progenitors (GMP) from mice with myocardial infarction (MI). GMP were isolated from the bone marrow of control mice and day 2 after MI (n=3 control, n=3 MI). C, Gene set enrichment analysis showing upregulation of “Hallmark oxidative phosphorylation”, “Hallmark fatty acid metabolism” and “C2 Reactome respiratory electron transport” in GMP isolated from mice with MI. D, Real-time changes in the oxygen consumption rate (OCR) of GMP sorted from control mice compared to day 3 after MI (n=5 control, n=5 MI, two independent experiments), assessed by Seahorse assay. E, Quantification of basal OCR, spare respiration capacity (SRC), extracellular acidification rate (ECAR) and OCR/ECAR ratio of GMP sorted from control mice versus day 3 after MI (n=5 control, n=5 MI, two-tailed Welch’s t test, two independent experiments). F, Abundance of citrate, percentage of 13C2 labelled citrate, and amount of total 13C2 citrate as measured by mass spectrometry in 300,000 GMP isolated from control and day 3 post-MI mice that were injected with 13C16 palmitate (n=8 mice per group, two-tailed Mann-Whitney test, two independent experiments). G, Flow cytometry gating for hematopoietic stem and progenitor cells (HSPC) in mice and histogram of MitoTracker Green FM intensity in GMP from controls and mice on day 3 after MI. H, Mean fluorescence intensity (MFI) of MitoTracker Green staining in control mice versus day 3 after MI (n=5 control, n=6 MI, two-tailed Welch’s t test). Data are displayed as mean±SEM.
Fig. 2 |
Fig. 2 |. Hematopoietic stem and progenitor cells display increased fatty acid content in response to myocardial infarction.
A, Histograms and quantification of BODIPY lipid dye fluorescence intensity in LSK, SLAM-LSK, MPP and GMP from controls and mice day 1–3 after MI (n=9 control, n=8 MI day 1, n=9 MI day 3 for LSK, SLAM LSK and MPP, n=7 control, n=8 MI day1, n=6 MI day3 for GMP, one-way ANOVA followed by Dunnett’s post-test, four independent experiments). B, Fluorescence microscopy image of lipid BODIPY staining in GMP sorted from control mice versus day 3 after MI. C, Quantification of BODIPY mean fluorescence intensity (MFI) in sorted GMP from control mice versus day 3 after MI (n=12 control, n=10 MI, 6 measurements from each mouse, two-tailed Welch’s t test, three independent experiments). D, Flow cytometry gating for human bone marrow HSPC. E, Quantification of BODIPY lipid dye fluorescence intensity in LSK, HSC, CMP and GMP in controls versus patients on days 3–6 after MI (n=7 controls, n=8 MI patients, two-tailed Welch’s t test, three independent experiments). Data are displayed as mean±SEM.
Fig. 3 |
Fig. 3 |. Fatty acid oxidation is required for emergency hematopoiesis after myocardial infarction.
A, Quantification of blood leukocytes, monocytes and neutrophils (PMN) by flow cytometry in Cpt1afl/fl controls and Vav1Cre/+Cpt1Afl/fl mice, both 3 days after MI (n=6 Cpt1afl/fl, n= 7 Vav1Cre/+Cpt1Afl/fl, two-tailed Welch’s t test, three independent experiments). B, Quantification of bone marrow LSK, CMP and GMP by flow cytometry in Cpt1afl/fl controls and Vav1Cre/+Cpt1Afl/fl mice 3 days after MI (n=7 Cpt1afl/fl, n=10 Vav1Cre/+Cpt1Afl/fl, two-tailed Welch’s t test, three independent experiments). C, Colony forming unit (CFU) assay of bone marrow cells from Cpt1afl/fl controls and Vav1Cre/+Cpt1Afl/fl mice 3 days after MI (n=10 Cpt1afl/fl, n=10 Vav1Cre/+Cpt1Afl/fl, two-tailed Welch’s t test). D, Proliferation quantification of LSK, CMP and GMP in the femurs of Cpt1afl/fl controls and Vav1Cre/+Cpt1Afl/fl mice 3 days after MI (n=7 Cpt1afl/fl, n=11 Vav1Cre/+Cpt1Afl/fl, two-tailed Welch’s t test, three independent experiments). E, Flow plots and F, quantification of monocytes and neutrophils in the ischemic myocardium of Cpt1afl/fl controls and Vav1Cre/+Cpt1afl/fl mice on day 3 after MI (n=12 Cpt1afl/fl, n=11 Vav1Cre/+Cpt1Afl/fl, two-tailed Welch’s t test, four independent experiments). Data are displayed as mean±SEM.
Fig. 4 |
Fig. 4 |. Myocardial infarction reduces bone marrow adiposity.
A, Bone marrow adipocyte immunofluorescence staining for Perilipin-1 in controls versus mice on day 3 after MI. B, Quantification of adipocyte numbers and C, adipocyte size in femurs on indicated days after MI (n=13 control, n=4–10 per time, Brown-Forsythe and Welsh Anova with Dunnett’s T3 multiple comparison, six independent experiments). D, Representative Osmium μCT images and E, quantification of marrow adipose tissue (n=6 control mice, n=5 MI day 3, two-tailed Welch’s t test, 2 independent experiments). F, Confocal imaging of DiD-labeled LSK, adipocytes and endothelial cells in controls versus 3 days after MI. G, Quantification of LSK distance to the next adipocyte in control mice versus day 3 after MI (n=6 control, n=7 MI, two-tailed Welch’s t test, three independent experiments). H, Vertebral bone marrow adipocyte immunofluorescence staining for Perilipin-1 in humans with or without MI. I, Quantification of adipocyte size (n=9 controls, n=14 MI patients, two-tailed Welch’s t test). J, Vertebral density measurement by CT in control subjects without MI and patients admitted with acute MI (n=11 controls, n=11 MI, two-tailed Welch’s t test). K, Histology staining of sternal bone marrow samples from patients with myocardial infarction vs control patients. L, Quantification of adipocyte size (n=5 control subjects, n=10 MI patients, two-tailed Welch’s t test). M, Histology staining of bone marrow biopsies from the iliac crest of pigs before versus post-MI. N, Quantification of adipocyte size (n=7, two-tailed paired t test). Data are displayed as mean±SEM.
Fig. 5 |
Fig. 5 |. Fatty acids from bone marrow adipocytes are required for increased myelopoiesis after myocardial infarction.
A, Quantification of blood leukocytes, monocytes and neutrophils (PMN) by flow cytometry in Atglfl/fl controls and AdipoqCreERT2Atglfl/fl mice 3 days after MI (n=9 Atglfl/fl, n=8 AdipoqCreERT2Atglfl/fl, two-tailed Welch’s t test, three independent experiments). B, Quantification of bone marrow LSK, CMP and GMP by flow cytometry in Atglfl/fl controls and AdipoqCreERT2Atglfl/fl mice 3 days after MI (n=9 Atglfl/fl, n=7 AdipoqCreERT2Atglfl/fl, two-tailed Welch’s t test, three independent experiments). C, Flow plots and D, proliferation quantification of LSK, CMP and GMP in femurs of Atglfl/fl controls and AdipoqCreERT2Atglfl/fl mice 3 days after MI (n=9 Atglfl/fl, n=7 AdipoqCreERT2Atglfl/fl, two-tailed Welch’s t test, four independent experiments). Data are displayed as mean±SEM.
Fig. 6 |
Fig. 6 |. Local depletion of bone marrow adipocytes leads to reduced emergency hematopoiesis.
A, Experimental design for single leg adipocyte depletion before MI. B, Immunofluorescence imaging of adipocytes in PBS- versus diphtheria toxin- (DT) injected tibias. C, Number of adipocytes in PBS- versus DT-injected tibias (n=4 mice, two-tailed paired t test, three independent experiments). D,E, Flow plots and proliferation quantification of LSK (D) and GMP (E) in PBS- versus DT-injected tibias 3 days after MI (n=11, two-tailed paired t test, three independent experiments). F, Experimental design for single leg adipocyte depletion. G, Proliferation quantification of HSC and GMP in non-MI mice (n=6, paired t test). H, Experimental design for in vitro FFA transfer experiment. I, Gating strategy, histogram, and quantification of BODIPY FL C16 in GMPs co-cultured with adipocytes (GMPs and adipocytes from n=4 mice for the positive control, n=7 for every other group, One-way ANOVA with Tukey’s multiple comparison tests, two independent experiments). Data are displayed as mean±SEM.
Fig. 7 |
Fig. 7 |. Sympathetic nerve fibers regulate the release of fatty acids from bone marrow adipocytes in response to myocardial infarction.
A, Quantification of LSK, SLAM-LSK and GMP in PBS versus 6-OHDA-treated mice 3 days after MI (n=10 mice PBS, n=9 6-OHDA, two-tailed Welch’s t test, four independent experiments). B, Immunofluorescence Perilipin staining and C, adipocyte quantification in controls versus 6-OHDA injected mice, all on day 3 after MI (n=12 PBS, n=9 6-OHDA, two-tailed Welch’s t test, four independent experiments). D, Flow cytometry histograms and quantification of lipid content in SLAM-LSK, LSK, and GMP in controls versus 6-OHDA treated mice, all 3 days after MI (n=10 PBS, n=10 6-OHDA, two-tailed Welch’s t test, four independent experiments). E, Experimental design of single leg denervation. F, Immunofluorescent staining of adipocytes in sham versus denervated femurs. G, Quantification of adipocyte size in sham denervated versus denervated femurs in mice on day 3 after MI (n=10, two-tailed paired t test). H, Difference in GMP proliferation between the two legs (sham leg vs. denervated leg) in MI and control mice (n=5 control mice and n=6 MI mice, two-tailed Mann-Whitney test, four independent experiments) I, Graphical abstract. Data are displayed as mean±SEM.

Comment in

References

    1. Galkina E. & Ley K. Immune and inflammatory mechanisms of atherosclerosis (*). Annu Rev Immunol 27, 165–197 (2009). - PMC - PubMed
    1. Moore KJ & Tabas I. Macrophages in the pathogenesis of atherosclerosis. Cell 145, 341–355 (2011). - PMC - PubMed
    1. Patel AA et al. The fate and lifespan of human monocyte subsets in steady state and systemic inflammation. J Exp Med 214, 1913–1923 (2017). - PMC - PubMed
    1. Dutta P. et al. Myocardial Infarction Activates CCR2(+) Hematopoietic Stem and Progenitor Cells. Cell Stem Cell 16, 477–487 (2015). - PMC - PubMed
    1. Dutta P. et al. Myocardial infarction accelerates atherosclerosis. Nature 487, 325–329 (2012). - PMC - PubMed