

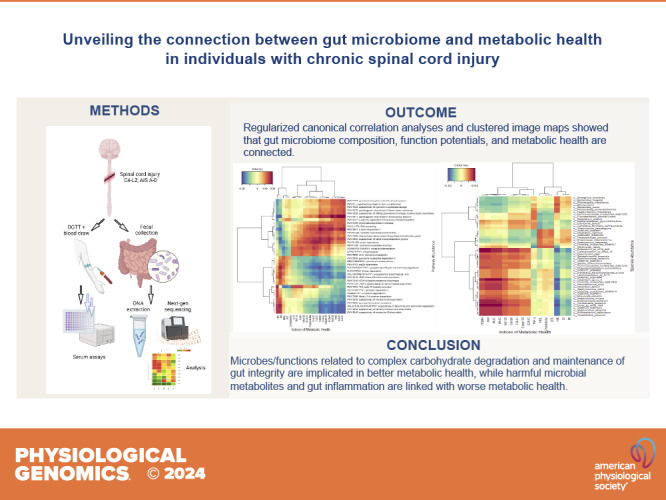
Unveiling the connection between gut microbiome and metabolic health in individuals with chronic spinal cord injury
- PMID: 38344780
- PMCID: PMC11283909
- DOI: 10.1152/physiolgenomics.00107.2023
Unveiling the connection between gut microbiome and metabolic health in individuals with chronic spinal cord injury
Abstract
Accumulating evidence has revealed that alterations in the gut microbiome following spinal cord injury (SCI) exhibit similarities to those observed in metabolic syndrome. Considering the causal role of gut dysbiosis in metabolic syndrome development, SCI-induced gut dysbiosis may be a previously unidentified contributor to the increased risk of cardiometabolic diseases, which has garnered attention. With a cross-sectional design, we evaluated the correlation between gut microbiome composition and functional potential with indicators of metabolic health among 46 individuals with chronic SCI. Gut microbiome communities were profiled using next-generation sequencing techniques. Indices of metabolic health, including fasting lipid profile, glucose tolerance, insulin resistance, and inflammatory markers, were assessed through fasting blood tests and an oral glucose tolerance test. We used multivariate statistical techniques (i.e., regularized canonical correlation analysis) to identify correlations between gut bacterial communities, functional pathways, and metabolic health indicators. Our findings spotlight bacterial species and functional pathways associated with complex carbohydrate degradation and maintenance of gut barrier integrity as potential contributors to improved metabolic health. Conversely, those correlated with detrimental microbial metabolites and gut inflammatory pathways demonstrated associations with poorer metabolic health outcomes. This cross-sectional investigation represents a pivotal initial step toward comprehending the intricate interplay between the gut microbiome and metabolic health in SCI. Furthermore, our results identified potential targets for future research endeavors to elucidate the role of the gut microbiome in metabolic syndrome in this population.NEW & NOTEWORTHY Spinal cord injury (SCI) is accompanied by gut dysbiosis and the impact of this on the development of metabolic syndrome in this population remains to be investigated. Our study used next-generation sequencing and multivariate statistical analyses to explore the correlations between gut microbiome composition, function, and metabolic health indices in individuals with chronic SCI. Our results point to potential gut microbial species and functional pathways that may be implicated in the development of metabolic syndrome.
Keywords: gut microbiome; insulin resistance; metabolic health; next-generation sequencing; spinal cord injury.
Conflict of interest statement
No conflicts of interest, financial or otherwise, are declared by the authors.
Figures
Similar articles
-
Comparison of the gut microbiome composition among individuals with acute or long-standing spinal cord injury vs. able-bodied controls.J Spinal Cord Med. 2022 Jan;45(1):91-99. doi: 10.1080/10790268.2020.1769949. Epub 2020 Jun 4. J Spinal Cord Med. 2022. PMID: 32496944 Free PMC article.
-
Gut Microbiome Composition and Serum Metabolome Profile Among Individuals With Spinal Cord Injury and Normal Glucose Tolerance or Prediabetes/Type 2 Diabetes.Arch Phys Med Rehabil. 2022 Apr;103(4):702-710. doi: 10.1016/j.apmr.2021.03.043. Epub 2021 Jun 12. Arch Phys Med Rehabil. 2022. PMID: 34126067
-
Utilizing a low-carbohydrate/high-protein diet to improve metabolic health in individuals with spinal cord injury (DISH): study protocol for a randomized controlled trial.Trials. 2019 Jul 30;20(1):466. doi: 10.1186/s13063-019-3520-3. Trials. 2019. PMID: 31362773 Free PMC article.
-
Traumatic Spinal Cord Injury and the Gut Microbiota: Current Insights and Future Challenges.Front Immunol. 2020 May 8;11:704. doi: 10.3389/fimmu.2020.00704. eCollection 2020. Front Immunol. 2020. PMID: 32528463 Free PMC article. Review.
-
Spinal cord injury and the human microbiome: beyond the brain-gut axis.Neurosurg Focus. 2019 Mar 1;46(3):E11. doi: 10.3171/2018.12.FOCUS18206. Neurosurg Focus. 2019. PMID: 30835680 Review.
References
MeSH terms
Grants and funding
LinkOut - more resources
Full Text Sources
Medical