. 2024 May 21;149(21):1650-1666.
doi: 10.1161/CIRCULATIONAHA.123.065294. Epub 2024 Feb 12.

The Macrophage Landscape Across the Lifespan of a Human Cardiac Allograft

Affiliations

The Macrophage Landscape Across the Lifespan of a Human Cardiac Allograft

Xiao Li et al. Circulation. .

Abstract

Background: Much of our knowledge of organ rejection after transplantation is derived from rodent models.

Methods: We used single-nucleus RNA sequencing to investigate the inflammatory myocardial microenvironment in human pediatric cardiac allografts at different stages after transplantation. We distinguished donor- from recipient-derived cells using naturally occurring genetic variants embedded in single-nucleus RNA sequencing data.

Results: Donor-derived tissue resident macrophages, which accompany the allograft into the recipient, are lost over time after transplantation. In contrast, monocyte-derived macrophages from the recipient populate the heart within days after transplantation and form 2 macrophage populations: recipient MP1 and recipient MP2. Recipient MP2s have cell signatures similar to donor-derived resident macrophages; however, they lack signatures of pro-reparative phagocytic activity typical of donor-derived resident macrophages and instead express profibrotic genes. In contrast, recipient MP1s express genes consistent with hallmarks of cellular rejection. Our data suggest that recipient MP1s activate a subset of natural killer cells, turning them into a cytotoxic cell population through feed-forward signaling between recipient MP1s and natural killer cells.

Conclusions: Our findings reveal an imbalance of donor-derived and recipient-derived macrophages in the pediatric cardiac allograft that contributes to allograft failure.

Keywords: allografts; heart; killer cells, natural; macrophages; pediatrics; tissue donor; transplant recipients.


Conflict of interest statement

Disclosures None.

Figures

Figure 1.
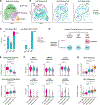
Figure 1.. Pediatric Cardiac Allografts Harboring Donor- and Recipient-derived Immune Cells.
(A) Schematic illustrating the design of the snRNA-seq experiments. Graft biopsies were collected from three pediatric patients at 5 days (5dPT), 15 months (15mPT), and 12 years (12yPT) after undergoing transplantation. Tissues from the apical anterior wall of the left ventricles were obtained during repeat heart transplantation. (B) Principal component analysis (PCA) bubble plots of pseudobulk snRNA-seq data colored by individual patient (top), age (middle), and sex (bottom). The bubble size in the top plot represents the amount of quality-controlled single nuclei. (C) Global uniform manifold approximation and projection (UMAP) of an integrated dataset showing 75,941 nuclei combined from control hearts and 20,690 nuclei combined from transplanted hearts. (D) Global UMAP showing 9 distinct cardiac cell types based on unbiased clustering and reference-assisted annotation. (E) Cell composition of nonimmune, lymphoid, and myeloid cells at each time point. Each dot in a box represents the fold-change over one of the four controls. (F) Nuclei in the same global UMAP colored by their inferred donor or recipient cell origins. Inference of only a few nuclei was ambiguous. (G) Percentages of donor-derived lymphoid and myeloid cells captured in the allografts at different timepoints. PT: post-transplantation.
Figure 2.
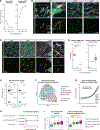
Figure 2.. Recipient MP2s Incompletely Acquire the Tissue Resident Macrophage Cell State.
(A) A representative uniform manifold approximation and projection (UMAP) of the myeloid cell subset. Reclustered nuclei are colored by myeloid subtypes. MP: macrophage. (B) Myeloid cells at three timepoints after transplantation (5dPT, 15mPT and 12yPT) colored by donor or recipient origin. Dashed-line encircles the MP2 cluster. (C) Bar graph of Mono and MP cell counts, highlighting the substantial abundance of donor MP2s at the 5dPT timepoint and the lack of donor-derived cells in late-stage post-transplantation. ,(D) Schematic illustrating the major classes of monocytes and macrophages in cardiac allografts, based on transcriptomic clustering and cell origin inference. (E) Box plot showing the expression z-scores of previously reported resident macrophage signature genes in monocytes and donor- and recipient-derived MP2s. (F) Violin plots showing expression levels of general MP2 genes MRC1, MERTK and CD163, donor MP2-specific genes LYVE1 and CYBB, and recipient MP2-specific gene CD163L1. (G) Expression z-scores of MHC-I and MHC-II genes in the main classes of monocytes and macrophages from control and allografts. *: two-sided unpaired Student’s t test, p<0.001. n.s.: non-significant, adjusted p>0.05.
Figure 3.
Figure 3.. Diminished donor MP2 replaced by recipient MP2s.
(A) The relative abundance of donor MP2s and recipient MP2s across the post-transplantation time points. (B and C) Representative images of RNA fluorescence in situ hybridization (FISH) for CYBB (B) and CD163L1 (C), co-stained with immunofluorescent antibody against CD163, DAPI and wheat germ agglutinin (WGA). Yellow arrowheads point to donor MP2s (CD163+CYBB+) (B) and recipient MP2 (CD163+CD163L1+) (C). Exemplary cells encircled by dashed boxes are shown in zoomed-in view. (D) Percentage of donor MP2s (CD163+CYBB+) and recipient MP2 (CD163+CD163L1+) quantified by FISH in allografts at each time point. Each data point represents a different tissue area. *: p<0.05, **: p<0.01, ***: p<0.001. P values determined by two-sided unpaired Student’s t test. (E) Distribution of proliferative MP2s from aggregated controls and each transplanted heart at each time points, quantified by expression of cell cycle-associated genes. (F) Cell-cell transition potential determined by RNA velocity overlayed on the UMAP of myeloid cells. The arrows illustrate the bifurcated transitions from monocytes to either recipient MP1s or recipient MP2s. (G) Aggregated expression pattern of a co-expressed gene set correlated with the monocyte-to-recipient MP2 differentiation trajectory. Each line represents the mean expression of a gene across monocytes and recipient MP2s, ranked by diffusion pseudotime. Six genes were highlighted as examples. (H) A dendrogram illustrating the similarity among donor MP2s and early and late recipient MP2s, measured by the distance between their transcriptomes. (I) Expression z-scores of reported tissue-resident macrophages markers (top) and the Mono-to-recipient MP2 differentiation trajectory genes shown in G in the donor MP2s and recipient MP2s across post-transplantation time points. *: two-sided unpaired Student’s t test, p<0.001.
Figure 4.
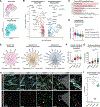
Figure 4.. Late-Stage Recipient MP2s Lack a Phagocytotic Signature and are Fibrogenic.
(A) Split view of myeloid UMAP of two MP2 populations from all allografts: Donor MP2s (left) and Recipient MP2s (right). (B) Volcano plot highlighting the differentially expressed genes between donor MP2s and recipient MP2s. The Y-axis was capped at 20 as the maximum. (C) Gene ontology analysis showing enriched biological processes in donor MP2s. (D) Expression z-scores of phagocytosis pathway genes among donor MP2s and recipient MP2s. (E) Chord diagrams of predicted significant ligand-receptor interactions between macrophages and cardiac cells (CM, cardiomyocytes; EC, endothelial cells; FB, fibroblasts; PC, pericytes; and SMC, smooth muscle cells). Potential ligands sent from donor MP2s (left), recipient MP2s at 15mPT (middle), and recipient MP2s at 12yPT (right) and received by multiple cardiac cell types in the respective samples. The thickness of the chord within each signal group represents relative signaling strength. Signaling pathways known to induce cardiac fibrosis are highlighted in blue. (F) Box plot of fibrosis scores in cardiac fibroblast cells from controls and allografts. Score were calculated on the basis of the expression of previously reported cardiac fibrosis signature genes in the fibroblast populations. (G) Percentage of fibrotic tissue area quantified from the trichrome staining images shown in Figure S1A. *: two-sided unpaired Student’s t test p<0.01. (H) Representative images of RNA fluorescence in situ hybridization (FISH) for PDGFB, co-stained with immunofluorescent antibody against CD163, DAPI and wheat germ agglutinin (WGA). Pink arrows point to non-MP cells that express PDGFB (CD163) and yellow arrowheads point to PDGFB-expressing MPs (CD163+PDGFB+). Exemplary cells encircled by dashed boxes are shown in zoomed-in view. (I) Percentage of recipient MP2 (CD163+PDGFB+) quantified by FISH in controls and allografts at each time point. Each data point represents a different tissue area. *: p<0.05, **: p<0.01, ***: p<0.001. P values determined by two-sided unpaired Student’s t test.
Figure 5.
Figure 5.. Recipient MP1s Associate with the Inflammatory Allograft Response.
(A) UMAP of the myeloid population, colored by cell subtypes and split by healthy controls and post-transplant timepoints. Each panel displays 500 randomly selected cells. Dashed lines highlight the Recipient MP1s in 5dPT samples. (B) Cell composition of monocytes and Recipient MP1s in allografts at different timepoints after transplantation. Fold-change of cell composition in allografts was calculated by comparing with controls. Note red dashed line at 0 represents baseline in controls. (C) Aggregated expression trend of a co-expressed gene set correlated with the Mono-to-Recipient MP1 differentiation trajectory. Each line represents the mean expression of a gene in monocytes and Recipient MP1s, ranked by diffusion pseudotime. Six of the 312 genes were highlighted as examples. (D) Gene set enrichment analysis showing enriched biologic processes (top) and molecular signature database (MSigDB) terms (bottom) in Recipient MP1s. Representative genes enriched in the terms are listed on the right. (E) Significant CCL3/4–CCR5 signaling predicted between Recipient MP1s and T cells (TC) and natural killer (NK) cells. Vertex diagram illustrates the direction (arrow) and strength (thickness) of interactions, and violin plots show specific expression of ligand and receptor genes. (F) Similar to E, vertex diagram and violin plots demonstrate the predicted IL1–IL1R signaling from Recipient MP1s to monocytes, Recipient MP2s, and Recipient MP1s themselves. (G) Principal component analysis (PCA) plot showing the distinct transcription profiles of Recipient MP1s in allografts compared to macrophages in failing hearts with dilated cardiomyopathy. (H) Heatmap showing the aggregated expression of representative genes from the allograft rejection hallmark gene set (left) and previously reported signature genes in cardiac allograft rejection (right).
Figure 6.
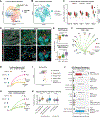
Figure 6.. Recipient MP1s Induce a Hypertoxic NK Cell State.
(A) Representative UMAP of T cells and NK cells in the integrated data. Nuclei are colored by T cell and NK subtype annotations. (B) UMAP of all T and NK cells from the allograft 5 days after transplantation (5dPT), colored by inferred donor and recipient origin. (C) Cell composition of T cell and NK cell subsets in the allograft at various timepoints after transplantation. The fold-change of cell composition in allografts was calculated by comparing with controls. Red dashed line at 0 represents baseline in controls. Note the significant enrichment and then gradual decrease of NK3 cells in the allografts. (D) Representative images of RNA fluorescence in situ hybridization (FISH) for CRTAM, co-stained with immunofluorescent antibody against CD163, DAPI and wheat germ agglutinin (WGA). Yellow arrowheads point to CRTAM+ NK3 cells. Exemplary NK3 cells encircled by dashed boxes are shown in zoomed-in view. (E) Expression z-scores of genes in KEGG pathways of NK cytotoxicity (top) and allograft rejection (bottom) in the 3 NK subtypes. *: two-sided unpaired Student’s t test, p<0.01. (F) Significant FASL–FAS signaling predicted between NK3 cells and almost all noncardiomyocytes. Vertex diagram illustrates the direction (arrow) and strength (thickness) of interactions. (G and H) Similar to F, vertex diagrams demonstrate the predicted IL-18 signaling from monocytes, Recipient MP1s, and Recipient MP2s to NK3 cells (G); and reciprocal CSF2 signaling from NK3 cells to monocytes and macrophages (H). (I) Principal component analysis (PCA) plot showing the distinct transcription profiles of NK3 cells in cardiac allografts compared with NK cells in failing hearts with dilated cardiomyopathy (DCM). (J), Box plot showing NK3 signature expression in NK cells at the individual level from the current and public snRNA-seq data sets. Each data point within a box represents the average expression value from NK cells in a single patient. (K) Expression z-scores of genes from the KEGG allograft rejection pathway in pediatric allograft NK3 cells, adult allograft endomyocardial biopsies, and DCM NK cells compared with their respective age-matched controls. *: two-sided unpaired Student’s t test, p<0.01. n.s.: non-significant, p > 0.05.

Comment in

References

    1. Epelman S, Lavine KJ, Beaudin AE, Sojka DK, Carrero JA, Calderon B, Brija T, Gautier EL, Ivanov S, Satpathy AT, Schilling JD, Schwendener R, Sergin I, Razani B, Forsberg EC, Yokoyama WM, Unanue ER, Colonna M, Randolph GJ, Mann DL. Embryonic and Adult-Derived Resident Cardiac Macrophages Are Maintained through Distinct Mechanisms at Steady State and during Inflammation. Immunity. 2014;40:91–104. - PMC - PubMed
    1. Zaman R, Hamidzada H, Kantores C, Wong A, Dick SA, Wang Y, Momen A, Aronoff L, Lin J, Razani B, Mital S, Billia F, Lavine KJ, Nejat S, Epelman S. Selective loss of resident macrophage-derived insulin-like growth factor-1 abolishes adaptive cardiac growth to stress. Immunity. 2021;54:2057–2071.e6. - PubMed
    1. Dick SA, Wong A, Hamidzada H, Nejat S, Nechanitzky R, Vohra S, Mueller B, Zaman R, Kantores C, Aronoff L, Momen A, Nechanitzky D, Li WY, Ramachandran P, Crome SQ, Becher B, Cybulsky MI, Billia F, Keshavjee S, Mital S, Robbins CS, Mak TW, Epelman S. Three tissue resident macrophage subsets coexist across organs with conserved origins and life cycles. Sci Immunol. 2022;7:eabf7777. - PubMed
    1. Bajpai G, Schneider C, Wong N, Bredemeyer A, Hulsmans M, Nahrendorf M, Epelman S, Kreisel D, Liu Y, Itoh A, Shankar TS, Selzman CH, Drakos SG, Lavine KJ. The human heart contains distinct macrophage subsets with divergent origins and functions. Nat Med. 2018;24:1234–1245. - PMC - PubMed
    1. Kang HM, Subramaniam M, Targ S, Nguyen M, Maliskova L, McCarthy E, Wan E, Wong S, Byrnes L, Lanata CM, Gate RE, Mostafavi S, Marson A, Zaitlen N, Criswell LA, Ye CJ. Multiplexed droplet single-cell RNA-sequencing using natural genetic variation. Nat Biotechnol. 2018;36:89–94. - PMC - PubMed