. 2024 May 29;36(6):2117-2139.
doi: 10.1093/plcell/koae039.

Pan-transcriptomic analysis reveals alternative splicing control of cold tolerance in rice

Affiliations

Pan-transcriptomic analysis reveals alternative splicing control of cold tolerance in rice

Yuanyuan Zhong et al. Plant Cell. .

Abstract

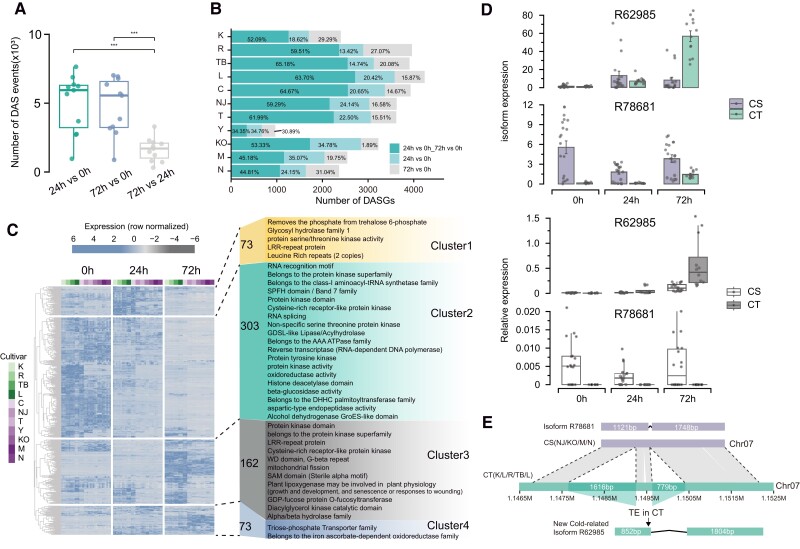
Plants have evolved complex mechanisms to adapt to harsh environmental conditions. Rice (Oryza sativa) is a staple food crop that is sensitive to low temperatures. However, its cold stress responses remain poorly understood, thus limiting possibilities for crop engineering to achieve greater cold tolerance. In this study, we constructed a rice pan-transcriptome and characterized its transcriptional regulatory landscape in response to cold stress. We performed Iso-Seq and RNA-Seq of 11 rice cultivars subjected to a time-course cold treatment. Our analyses revealed that alternative splicing-regulated gene expression plays a significant role in the cold stress response. Moreover, we identified CATALASE C (OsCATC) and Os03g0701200 as candidate genes for engineering enhanced cold tolerance. Importantly, we uncovered central roles for the 2 serine-arginine-rich proteins OsRS33 and OsRS2Z38 in cold tolerance. Our analysis of cold tolerance and resequencing data from a diverse collection of 165 rice cultivars suggested that OsRS2Z38 may be a key selection gene in japonica domestication for cold adaptation, associated with the adaptive evolution of rice. This study systematically investigated the distribution, dynamic changes, and regulatory mechanisms of alternative splicing in rice under cold stress. Overall, our work generates a rich resource with broad implications for understanding the genetic basis of cold response mechanisms in plants.


Conflict of interest statement

Conflict of interest statement. The authors declare that they have no competing interests.

Figures

Figure 1.
Figure 1.
Iso-Seq and RNA-Seq of cold-treated rice. A) Phylogenetic tree constructed using the genome sequences of 11 rice cultivars (top). The green line represents japonica rice and the purple line represents indica rice. Representative images of the 11 rice cultivars exposed to cold treatment at 6 to 8 °C with 0 h and 5 d (72 h recovery) (middle). The full names of each rice cultivar are: C (css12), K (Koshihikari), L (Lemont), R (Nipponbare), TB (Fujisaka5), T (TEQING), NJ (Nanjing11), Y (9311), KO (KOGONI 91-1::C), N (NONA_BOKRA), and M (MADINIKA 1329::GERVEX 8366-C1). Scale bar: 20 cm. The heatmap illustrates the number of HQ, OG, and EG (bottom). HQ means high-quality full-length transcripts based on PacBio Iso-Seq data. OG means genes overlapping with collapsed HQ. EGs means expressed genes based on Illumina RNA-Seq data. The number is shown by different colors. B) Heatmap showing the effect of chilling stress on gene expression in the 11 rice cultivars with 0-, 24-, and 72-h cold treatment. The mRNA expression value was scaled and shown in different colors. Gray indicates high expression, while blue signifies low expression. The green square represents CT and the purple square represents CS. C) Isoform length density (up) and the proportion of genes containing different numbers of isoforms (bottom) in the NIP (purple) and pan-transcriptome (green). The dotted line represents the median transcript length. D) Uncharacterized isoforms identified in the Iso-Seq data. This graph exclusively shows twelve sets arranged in descending order from highest to lowest values. The bar chart in the lower-left corner displays the number of uncharacterized isoforms for each set, while the stacked column chart above the horizontal axis illustrates the distribution of uncharacterized isoforms that are unique to or common among the 11 cultivars during the 0-, 24-, and 72-h cold treatment. The black circles below each black rectangle classify the corresponding uncharacterized isoforms into different cultivars. E) Circos visualization of the PacBio Iso-seq data in NIP reference genome. Outer to inner layers show the uncharacterized gene loci, lncRNA density, uncharacterized isoforms density, AS genes density, cold-induced DASGs only present in CS cultivars, cold-induced DASGs only present in CT cultivars, and cold-induced DASGs present in all CT cultivars but absent in CS cultivars from the Iso-seq data, respectively. Shades from light to dark indicate increasing numerical values. The numbers represent the length (Mb) of each chromosome. F) The number of genes with differential APA between distal (purple) or proximal (green) poly(A) sites at 0- and 24-h cold treatment, as well as between 24 h and 72 h cold treatment.
Figure 2.
Figure 2.
Validation of candidate genes associated with cold tolerance. A) Os03g0701200 and OsCATC CT-related and CS-related genes correlation network. B) Box plots show the distribution of OsCATC and Os03g0701200 expression in CS and CT cultivars. In the boxplots, center line, median; box limits, upper and lower quartiles; whiskers, 1.5× interquartile range; points, outliers. Statistical analysis of these data was performed using the Wilcoxon test (*P < 0.05, **P < 0.01, ***P < 0.001). C) Representative images of the mutants (Os03g0701200 and catc) and their corresponding control of Zhonghua 11 (ZH11) after 60 h of cold treatment with 3 d of recovery. Scale bar: 5 cm. WT denotes the control, and CR refers to the mutant. rep refers to a repeat. D) Survival rate (n = 3) and MDA (n = 4) levels of mutants (Os03g0701200 and catc) after cold treatment (0 and 60 h) with Zhonghua 11 (ZH11) as the corresponding controls. Representative results are depicted and the data is expressed as mean ± SEM. t test was used to calculate P-value. A P-value less than 0.05 is typically considered to be statistically significant. E) Alignment of CT cultivars include K (Koshihikari), R (Nipponbare), TB (Fujisaka5), L (Lemont), and CS cultivars include NJ (Nanjing11), N (NONA_BOKRA), KO (KOGONI 91-1::C), M (MADINIKA 1329::GERVEX 8366-C1), Y (9311) genomic DNA. The alignment revealed the insertion of an MITE of tourist type in the upstream sequence of Os03g0701200, an MITE of stow type in the downstream sequence, and structural variations in gene of OsCATC.
Figure 3.
Figure 3.
Cold-induced AS events increase the diversity of isoforms. A) Five major types of splice events in rice are presented: IR, ES, A3SS and A5SS, and MX exons. B) Pie charts showing the proportion of each type of AS event in 11 rice cultivars with 0-, 24-, and 72-h of cold treatment. C) Number of AS events in 11 rice cultivars with 0-, 24-, and 72-h cold treatment are presented through box plots. In the violin plot, center point, mean; box limits, upper and lower quartiles. Statistical analysis of these data was performed using the Wilcoxon test (**P < 0.01, ***P < 0.001). D) Stacked bar chart illustrating the distribution of genes containing different numbers of isoforms (colored bars) among cold treatment with 0-, 24-, and 72-h of cold treatment. The panel to the right zooms out to shows proportion of genes (dark gray bars outlined in black). E) The number of genes containing different numbers of isoforms in CS and CT cultivars with the same cold treatments was compared. The mean ± SEM. Statistical significance was determined using the Wilcoxon test (*P < 0.05, **P < 0.01). F) Scatter density plot showing the correlation between gene expression and the type of genes containing different numbers of isoforms. Spearman correlation coefficient was performed, P-value < 0.001. The expression data were standardized using FPKM method.
Figure 4.
Figure 4.
Specificity and experimental verification of cold-induced AS in rice. A) Box plots showing the distribution of DAS with 0-, 24-, and 72-h cold treatment. In the boxplots, center line, median; box limits, upper and lower quartiles; whiskers, 1.5× interquartile range; points, outliers. Statistical analysis of these data was performed using the Wilcoxon test (***P < 0.001). B) Stacked bar chart showing the percentage of rice cultivars that exhibited DASGs among the 11 cultivars. C) Heatmap showing the effect of chilling stress on the conserved and specific DASGs and functional annotation in CT rice cultivars with 0-, 24-, and 72-h cold treatment. The mRNA expression value was scaled and shown by different colors. Gray indicates low expression, while blue signifies high expression. D) Validation of Os07g0122000 through Illumina reads (top) and RT-qPCR (bottom). R62985 and R78681 are allelic AS transcripts of Os07g0122000. Bar plots showing the R62985 and R59596 expression in CS and CT cultivars. The data are shown as mean ± SEM. In the boxplots, center line, median; box limits, upper and lower quartiles; whiskers, 1.5× interquartile range; points, outliers. The relative expression level was calculated using the formula of 2−ΔCt. E) Alignment of CT cultivars include K (Koshihikari), R(Nipponbare), TB (Fujisaka5), L (Lemont), and CS cultivars include NJ (Nanjing11), N (NONA_BOKRA), KO (KOGONI 91-1::C), M (MADINIKA 1329::GERVEX 8366-C1) genomic DNA that shows DNAnona/MULE and LTR/Copia terminal element insertion in the upstream sequences. The PacBio long reads provided support for the DAS observed.
Figure 5.
Figure 5.
Key SR proteins regulate cold-induced AS in rice. A) Heatmap showing the effect of chilling stress on the gene expression of 22 SR proteins with 0-, 24-, and 72-h of cold treatment. We performed hierarchical clustering on rows. The mRNA expression level was scaled and shown by different colors. Red indicates high expression, while blue signifies low expression. B) Box plots showing the distribution of OsRS2Z38 and OsRS33 expression in CS and CT cultivars. In the boxplots, center line, median; box limits, upper and lower quartiles; whiskers, 1.5× interquartile range; points, outliers. Statistical analysis of these data was performed using the Wilcoxon test (**P < 0.01, ***P < 0.001). C) Expression of all transcripts of OsRS2Z38 and OsRS33 in the 11 rice cultivars with 0-, 24-, and 72-h cold treatment. TCONS refers to transcripts. The data are shown as mean ± SEM. D) Expression of the dominant transcripts of OsRS2Z38 and OsRS33 in the 11 rice cultivars with 0-, 24-, and 72-h of cold treatment. The data are shown as mean ± SEM. E) Phylogenetic relationships of the 22 SR genes across 11 rice cultivars.
Figure 6.
Figure 6.
OsRS2Z38 are differentiated in Asian cultivated rice. A) Box plots showing the distribution of OsRS2Z38 relative expression in CS and CT cultivars. In the boxplots, center line, median; box limits, upper and lower quartiles; whiskers, 1.5× interquartile range; points, outliers. Statistical analysis of these data was performed using the Wilcoxon test. A P-value less than 0.05 is considered to be statistically significant. B) Haplotype analysis of the promoter and CDS regions of OsRS2Z38 using 4,726 Asian cultivated rice accessions. Red lines indicate SNPs in the haplotypes. C) Distribution frequency of OsRS2Z38 haplotypes in diverse Asian cultivated rice collection. D) Sankey diagram illustrating the distribution of subpopulation, haplotype and survival rate in 165 rice cultivars. E) Representative images of the recovery growth of the mutant rs2z38 and its corresponding controls of NIP after 2 d cold treatment. Scale bar: 5 cm. F) Survival rate (n = 5) and MDA level (n = 4) of mutant rs2z38 after cold treatment (2 d) with NIP as controls. The representative results are depicted and the data are expressed as mean ± SEM. t test was used to calculate P-value. A P-value less than 0.05 is considered to be statistically significant. G) Bar chart represents the number of AS events of NIP and mutant rs2z38 under cold treatment with 0-, 24-, and 72-h cold treatment. H) Heatmap showing the effect of chilling stress on the transcript expression of 83 DASGs with 0- and 72-h cold treatment. The mRNA expression value was scaled and shown by different colors. I) Two examples of the PacBio long reads provided support for the DAS observed.
Figure 7.
Figure 7.
Splicing factor OsRS2Z38 and the cold-tolerance candidate gene respond to the cold stimulus. The splicing factor OsRS2Z38 regulates gene and transcription factor splicing, resulting in the production of cold-induced transcripts in japonica rice under cold stress. The cold-tolerance candidate gene is upregulated under cold stress and plays a regulatory role in japonica rice, compared to indica rice, which has different splicing and transcriptional regulatory patterns resulting in different levels of the cold tolerance. The solid arrow indicates the induction of cold stress responses.

References

    1. Abdel-Ghany SE, Hamilton M, Jacobi JL, Ngam P, Devitt N, Schilkey F, Ben-Hur A, Reddy ASN. A survey of the sorghum transcriptome using single-molecule long reads. Nat Commun. 2016:7(1):11706. 10.1038/ncomms11706 - DOI - PMC - PubMed
    1. Alamancos GP, Pagès A, Trincado JL, Bellora N, Eyras E. Leveraging transcript quantification for fast computation of alternative splicing profiles. RNA. 2015:21(9):1521–1531. 10.1261/rna.051557.115 - DOI - PMC - PubMed
    1. Albuquerque-Martins R, Szakonyi D, Rowe J, Jones AM, Duque P. ABA signaling prevents phosphodegradation of the SR45 splicing factor to alleviate inhibition of early seedling development in Arabidopsis. Plant Commun. 2023:4(2):100495. 10.1016/j.xplc.2022.100495 - DOI - PMC - PubMed
    1. Altschul SF, Gish W, Miller W, Myers EW, Lipman DJ. Basic local alignment search tool. J Mol Biol. 1990:215(3):403–410. 10.1016/s0022-2836(05)80360-2 - DOI - PubMed
    1. Buchfink B, Xie C, Huson DH. Fast and sensitive protein alignment using DIAMOND. Nat Methods. 2015:12(1):59–60. 10.1038/nmeth.3176 - DOI - PubMed

LinkOut - more resources