. 2024 Feb 26;64(4):1377-1393.
doi: 10.1021/acs.jcim.3c01890. Epub 2024 Feb 12.

Assessment of Two Restraint Potentials for Coarse-Grained Chemical-Cross-Link-Assisted Modeling of Protein Structures

Affiliations

Assessment of Two Restraint Potentials for Coarse-Grained Chemical-Cross-Link-Assisted Modeling of Protein Structures

Mateusz Leśniewski et al. J Chem Inf Model. .

Abstract

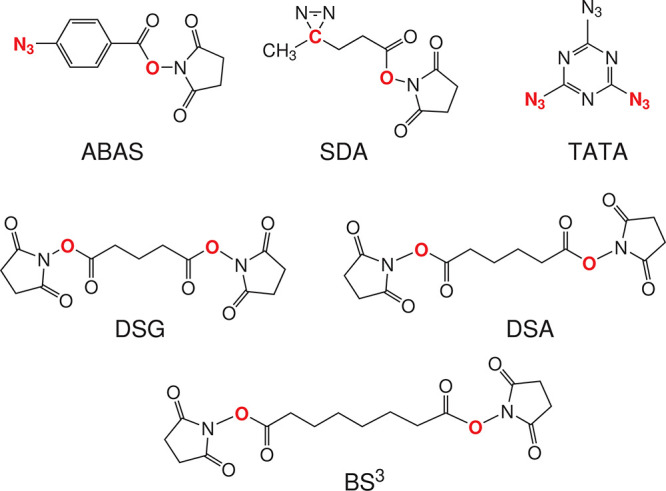
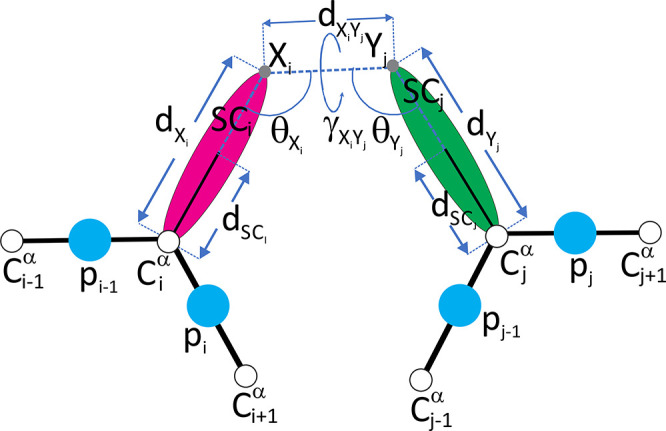
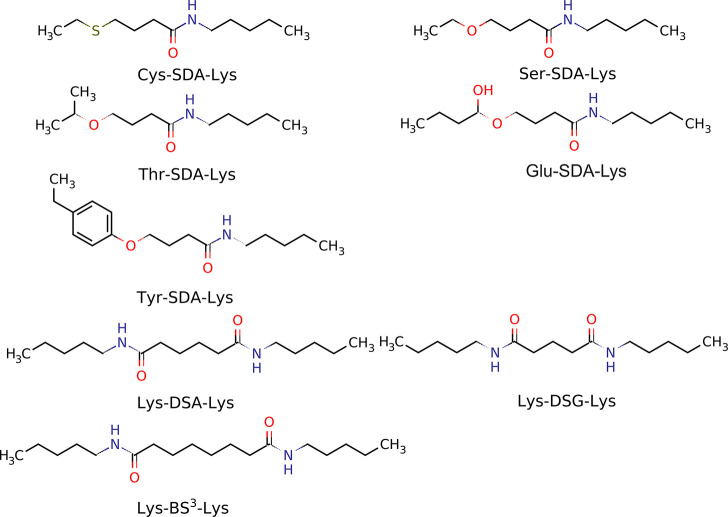
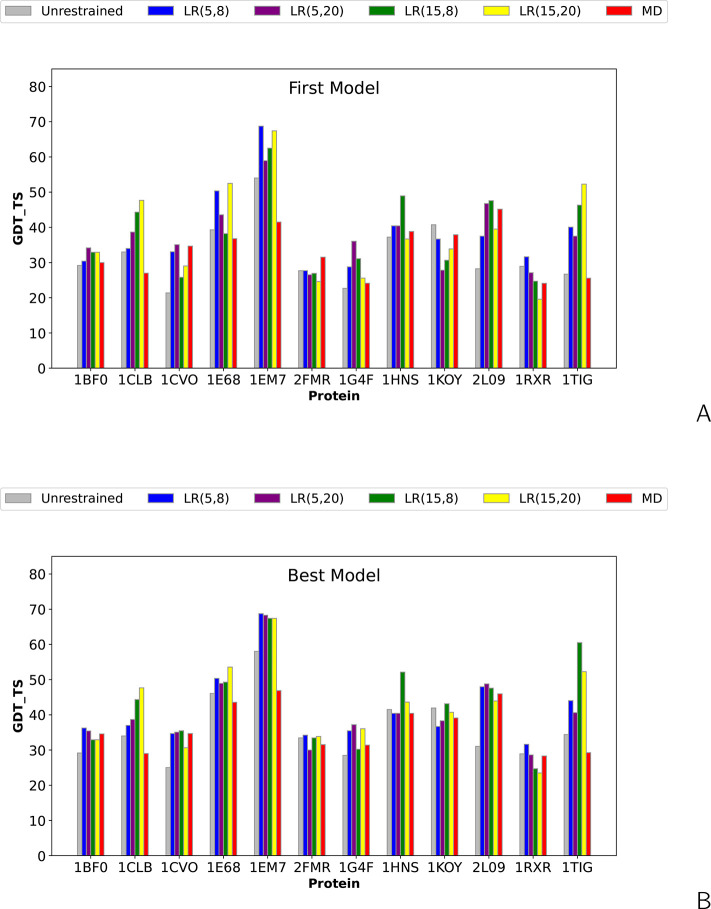
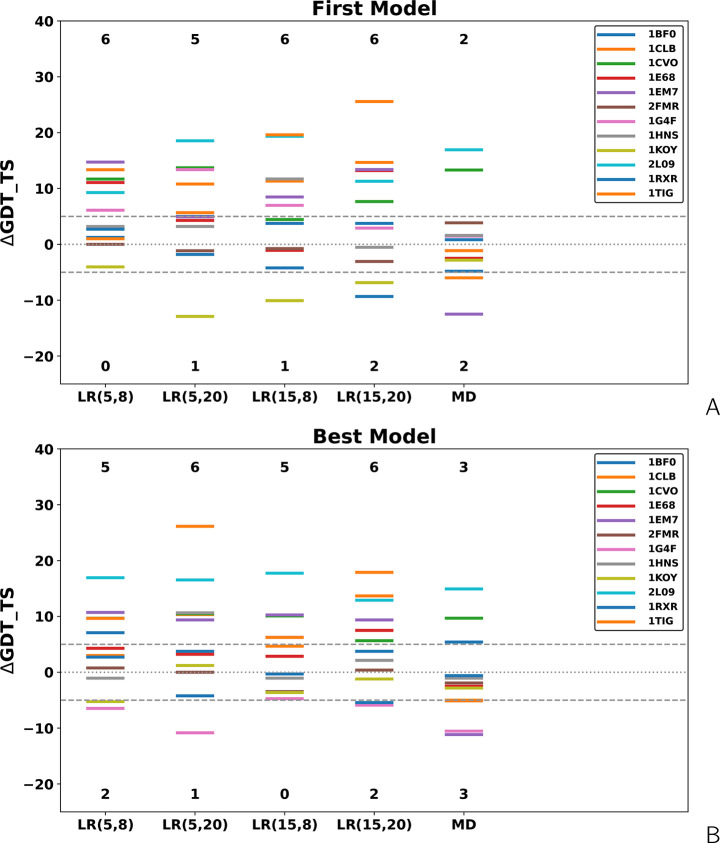
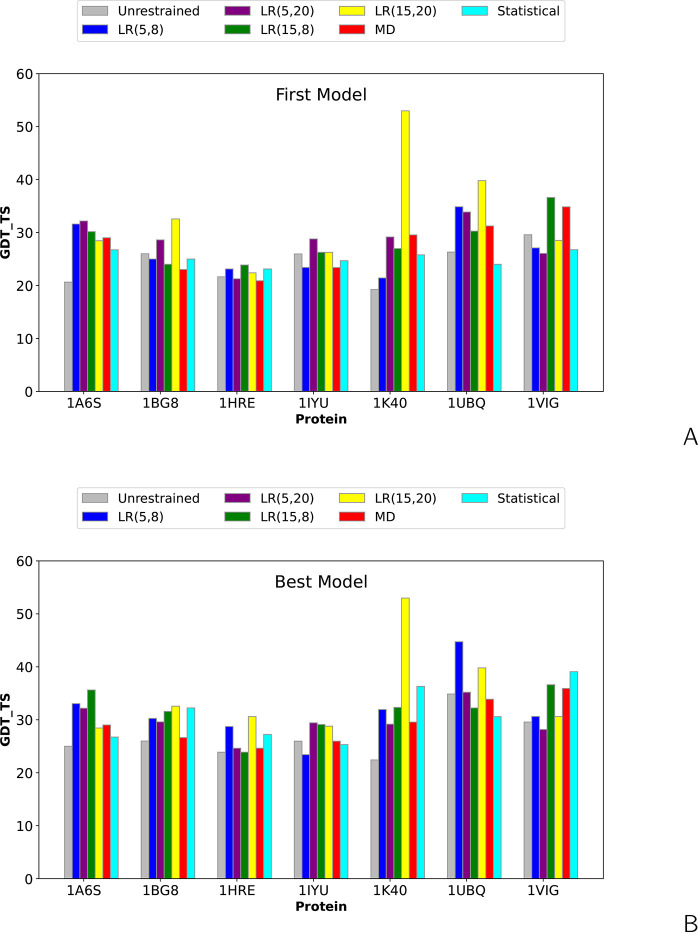
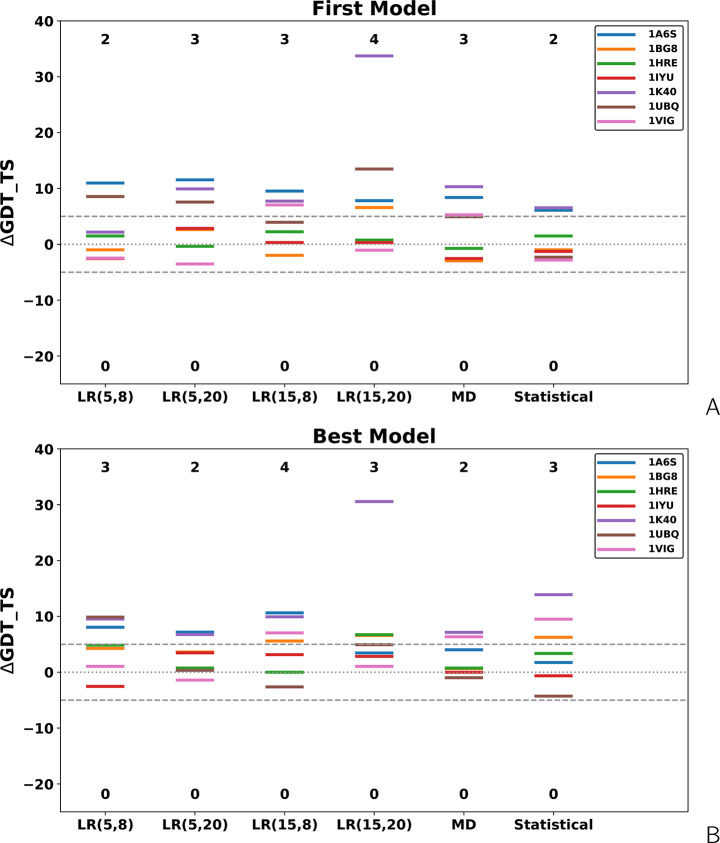
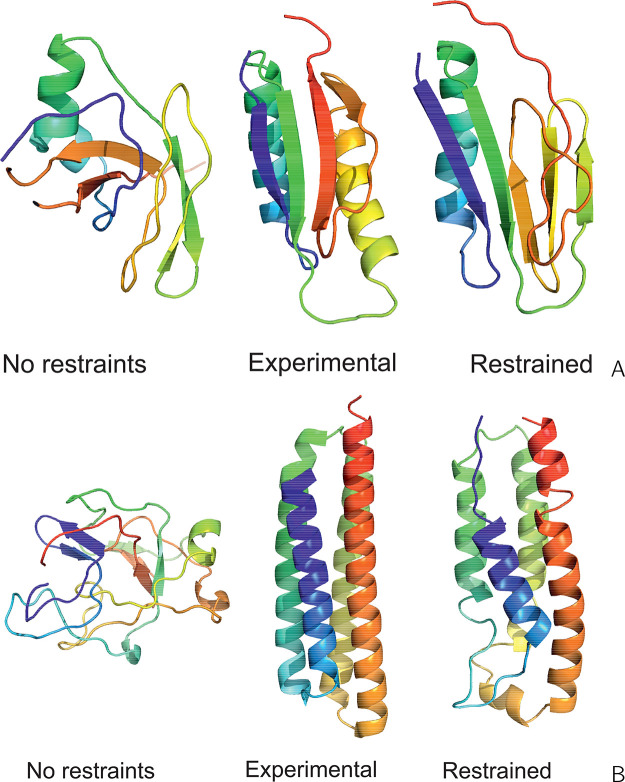
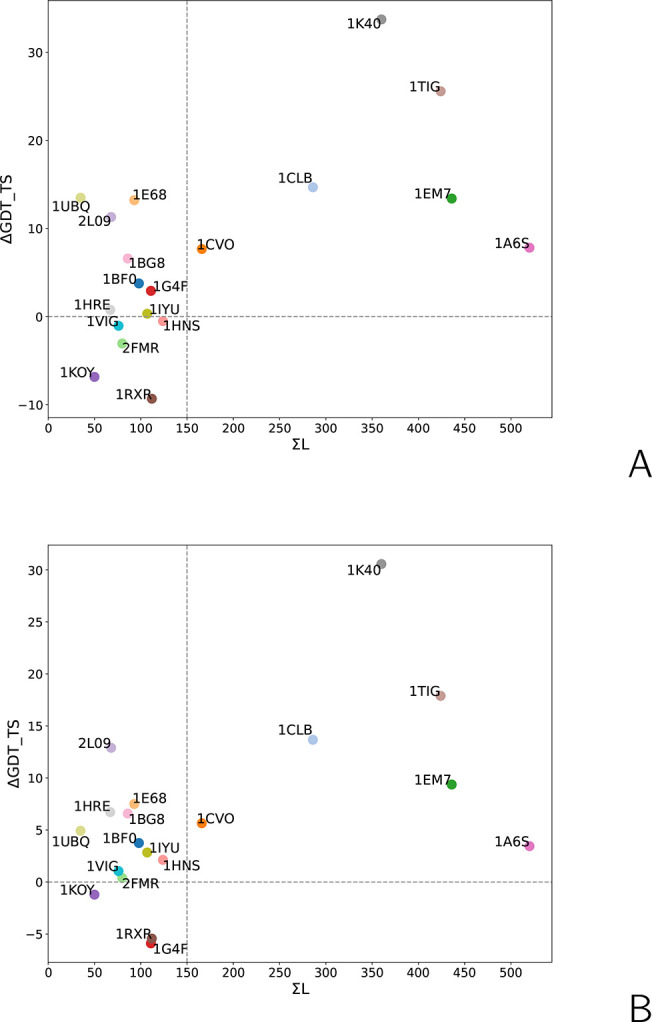
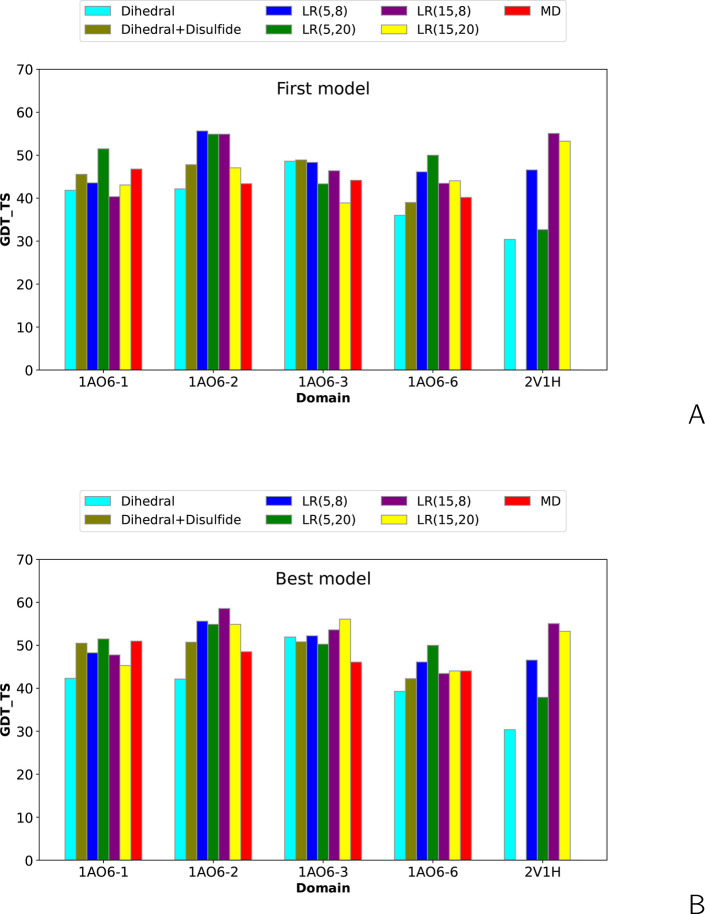
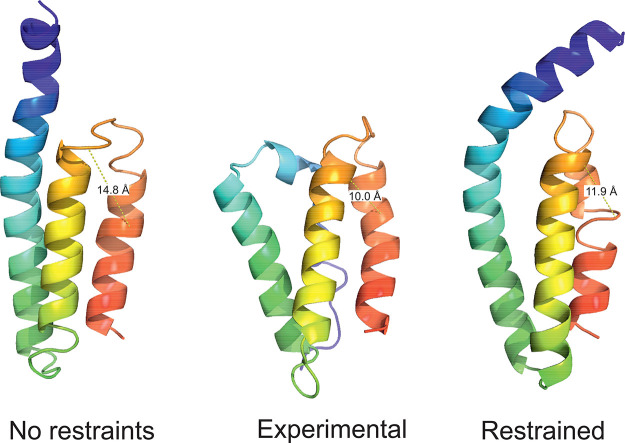
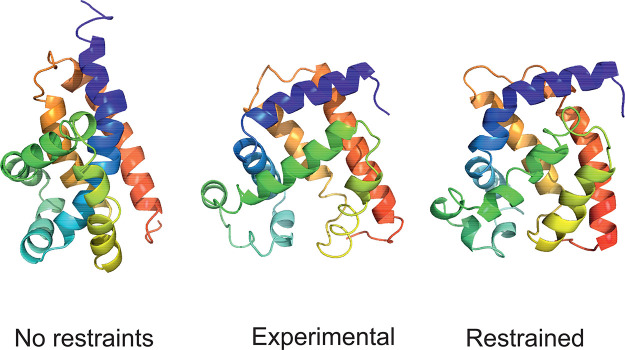
The influence of distance restraints from chemical cross-link mass spectroscopy (XL-MS) on the quality of protein structures modeled with the coarse-grained UNRES force field was assessed by using a protocol based on multiplexed replica exchange molecular dynamics, in which both simulated and experimental cross-link restraints were employed, for 23 small proteins. Six cross-links with upper distance boundaries from 4 Å to 12 Å (azido benzoic acid succinimide (ABAS), triazidotriazine (TATA), succinimidyldiazirine (SDA), disuccinimidyl adipate (DSA), disuccinimidyl glutarate (DSG), and disuccinimidyl suberate (BS3)) and two types of restraining potentials ((i) simple flat-bottom Lorentz-like potentials dependent on side chain distance (all cross-links) and (ii) distance- and orientation-dependent potentials determined based on molecular dynamics simulations of model systems (DSA, DSG, BS3, and SDA)) were considered. The Lorentz-like potentials with properly set parameters were found to produce a greater number of higher-quality models compared to unrestrained simulations than the MD-based potentials, because the latter can force too long distances between side chains. Therefore, the flat-bottom Lorentz-like potentials are recommended to represent cross-link restraints. It was also found that significant improvement of model quality upon the introduction of cross-link restraints is obtained when the sum of differences of indices of cross-linked residues exceeds 150.


Conflict of interest statement

The authors declare no competing financial interest.

Figures

Figure 1
Figure 1
Chemical structures of the cross-linking reagents referenced in this work: azido benzoic acid succinimide (ABAS), succinimidyldiazirine (SDA), triazidotriazine (TATA), disuccinimidyl glutarate (DSG), disuccinimidyl adipate (DSA), and disuccinimidyl suberate (BS3). The atoms or groups that are replaced by side-chain/backbone components upon cross-linking are shown in boldface red font. Note that only one of three possible pairs of groups is marked for TATA.
Figure 2
Figure 2
Scheme of the representation of cross-link restraints between residues with indices i and j, respectively, in the UNRES model. The Cα atoms are shown as white spheres, the united side chains (SC) are shown as colored spheroids, and the united peptide groups (p) are shown as blue spheres. The cross-linkable side chains are linked with the appropriate cross-linking reagent. The link is anchored in (approximately) the positions of the side chain atoms that are attached to the cross-link segment. The anchor points (indicated with “X” and “Y”, respectively, and light-gray spheres) are located on the Cα···SC axes of the UNRES residues. The geometric parameters on which the respective pseudopotentials depend (eqs 3–6) are also shown in the Figure. [Adapted with permission from ref (27). Copyright 2021, John Wiley and Sons.]
Figure 3
Figure 3
Structures of the compounds modeling the SDA-cross-linked pairs for the derivation of MD-based cross-link potentials introduced in this work and in ref (27). The abbreviations of cross-linking reagents and those of the residues they bridge are shown in each panel.
Figure 4
Figure 4
Bar plots of the global distance test total score (GDT_TS) of the (A) first and (B) highest-GDT_TS models of the short-cross-link benchmark proteins obtained in unrestrained UNRES simulations and cross-link-restrained simulations. LR(σ,A) denotes Lorentz-like potentials, with σ and A being the wall thickness and well depth, respectively (eq 8), and MD denotes MD-based potentials (eqs 3–6).
Figure 5
Figure 5
Level diagrams of the difference of the GDT_TS of the (A) first and (B) highest-GDT_TS models of the short-cross-link benchmark proteins obtained in cross-link-restrained simulations from those obtained in unrestrained simulations. LR(σ,A) denotes Lorentz-like potentials, with σ and A being the wall thickness and well depth, respectively (eq 8), and MD denotes MD-based potentials (eqs 3–6).
Figure 6
Figure 6
Bar plots of the global distance test total score (GDT_TS) of the (A) first and (B) highest-GDT_TS models of the BS3-cross-link benchmark proteins of ref (27) obtained in unrestrained UNRES simulations and cross-link-restrained simulations. LR(σ,A) denotes Lorentz-like potentials, with σ and A being the wall thickness and well depth, respectively (eq 8). “MD” denotes MD-based potentials (eqs 3–6), and “Statistical” denotes the statistical potentials (eq 7).
Figure 7
Figure 7
Level diagrams of the difference of the GDT_TS of the (A) first and (B) highest-GDT_TS models of the BS3-short-cross-link benchmark proteins of ref (27) obtained in cross-link-restrained simulations from those obtained in unrestrained simulations. LR(σ,A) denotes Lorentz-like potentials, with σ and A being the wall thickness and well depth, respectively (eq 8), “MD” denotes MD-based potentials (eqs 3–6), and “Statistical” denotes the statistical potentials (eq 7).
Figure 8
Figure 8
Experimental structures (center of a panel) of (A) 1TIG and (B) 1K40, compared with the respective first models of these proteins obtained in unrestrained UNRES simulations (left side of panel) and UNRES simulations restrained with the Lorentz-like cross-link potentials (right side of panel). The parameters of the Lorentz-like potentials were σ = 15 Å, A = 20 kcal/mol, respectively. For 1TIG (90 residues), the GDT_TS and Cα RMSD are 26.70 and 12.12 Å in unrestrained and 52.57 and 6.94 Å in restrained simulations, respectively. For 1K40 (126 residues), Cα RMSD are 19.25 and 12.12 Å in unrestrained and 52.98 and 3.92 Å in restrained simulations, respectively. The drawings were made with PyMOL.
Figure 9
Figure 9
Relationship between the sum of cross-link topological lengths (ΣL) with the difference between the GDT_TS of models obtained with Lorentz-type cross-link restraints (eq 8) with σ = 15 Å and A = 20 kcal/mol and those obtained in unrestrained simulations (ΔGDT_TS) for the (A) first and (B) highest-GDT_TS models of the 19 benchmark proteins with synthetic cross-link restraints.
Figure 10
Figure 10
Bar plots of the global distance test total score (GDT_TS) of the (A) first and (B) highest-GDT_TS models of repeats 1, 2, 3, and 6 of human serum albumin (PDB: 1AO6) and horse myoglobin (PDB: 2V1H) obtained in unrestrained UNRES simulations and cross-link-restrained simulations. LR(σ,A) denotes Lorentz-like potentials, with σ and A being the wall thickness and well depth, respectively (eq 8), and “MD” denotes MD-based potentials (eqs 3–6).
Figure 11
Figure 11
Experimental structure (center of the panel) of the sixth repeat of human serum albumin (1AO6-6, 84 residues) compared with the first model of this protein obtained in unrestrained UNRES simulations (left side of the panel) and UNRES simulations restrained with the Lorentz-like cross-link potentials (right side of the panel). The parameters of the Lorentz-like potentials were σ = 5 Å, A = 20 kcal/mol, respectively. The GDT_TS and Cα RMSD are 38.10 and 10.35 Å in unrestrained and 46.63 and 10.66 Å in restrained simulations, respectively. The only nonlocal cross-link and the respective side-chain-end distances are shown in all panels. The drawings were made with PyMOL.
Figure 12
Figure 12
Experimental structures (center of the panel) of horse myoglobin (2V1H, 153 residues) compared with the first model of this protein obtained in unrestrained UNRES simulations (left side of the panel) and UNRES simulations restrained with the Lorentz-like cross-link potentials (right side of the panel). The parameters of the Lorentz-like potentials were σ = 15 Å, A = 8 kcal/mol, respectively. The GDT_TS and Cα RMSD are 30.39 and 9.23 Å in unrestrained and 55.07 and 3.90 Å in restrained simulations, respectively. The drawings were made with PyMOL.

References

    1. Rappsilber J.; Siniossoglou S.; Hurt E. C.; Mann M. A Generic Strategy To Analyze the Spatial Organization of Multi-Protein Complexes by Cross-Linking and Mass Spectrometry. Anal. Chem. 2000, 72, 267–275. 10.1021/ac991081o. - DOI - PubMed
    1. Rappsilber J. The Beginning of a Beautiful Friendship: Crosslinking/Mass Spectrometry and Modelling of Proteins and Multi-Protein Complexes. J. Struct. Biol. 2011, 173, 530–540. 10.1016/j.jsb.2010.10.014. - DOI - PMC - PubMed
    1. Leitner A.; Joachimiak L. A.; Unverdorben P.; Walzthoeni T.; Frydman J.; Förster F.; Aebersold R. Chemical Cross-Linking/Mass Spectrometry Targeting Acidic Residues in Proteins and Protein Complexes. Proc. Natl. Acad. Sci. U.S.A. 2014, 111, 9455–9460. 10.1073/pnas.1320298111. - DOI - PMC - PubMed
    1. Belsom A.; Schneider M.; Fischer L.; Brock O.; Rappsilber J. Serum Albumin Domain Structures in Human Blood Serum by Mass Spectrometry and Computational Biology. Mol. Cell. Proteomics 2016, 15, 1105–1116. 10.1074/mcp.M115.048504. - DOI - PMC - PubMed
    1. Belsom A.; Schneider M.; Brock O.; Rappsilber J. Blind Evaluation of Hybrid Protein Structure Analysis Methods Based on Cross-Linking. Trends Biochem. Sci. 2016, 41, 564–567. 10.1016/j.tibs.2016.05.005. - DOI - PMC - PubMed

Publication types

MeSH terms