. 2024 Feb 12;19(2):e0298790.
doi: 10.1371/journal.pone.0298790. eCollection 2024.

Kinetics and mechanical work done to move the body centre of mass along a curve

Affiliations

Kinetics and mechanical work done to move the body centre of mass along a curve

Raphael M Mesquita et al. PLoS One. .

Abstract

When running on a curve, the lower limbs interact with the ground to redirect the trajectory of the centre of mass of the body (CoM). The goal of this paper is to understand how the trajectory of the CoM and the work done to maintain its movements relative to the surroundings (Wcom) are modified as a function of running speed and radius of curvature. Eleven participants ran at different speeds on a straight line and on circular curves with a 6 m and 18 m curvature. The trajectory of the CoM and Wcom were calculated using force-platforms measuring the ground reaction forces and infrared cameras recording the movements of the pelvis. To follow a circular path, runners overcompensate the rotation of their trajectory during contact phases. The deviation from the circular path increases when the radius of curvature decreases and speed increases. Interestingly, an asymmetry between the inner and outer lower limbs emerges as speed increases. The method to evaluate Wcom on a straight-line was adapted using a referential that rotates at heel strike and remains fixed during the whole step cycle. In an 18 m radius curve and at low speeds on a 6 m radius, Wcom changes little compared to a straight-line run. Whereas at 6 m s-1 on a 6 m radius, Wcom increases by ~25%, due to an augmentation in the work to move the CoM laterally. Understanding these adaptations provides valuable insight for sports sciences, aiding in optimizing training and performance in sports with multidirectional movements.


Conflict of interest statement

The authors have declared that no competing interests exist.

Figures
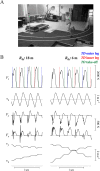
Fig 1
Fig 1. Image of the set-up and typical traces.
Panel A: Image of the 16 (1x1 m) force plate set-up for the 6 m radius of curvature. A 0.5 m track is drawn over the to guide the runner. Panel B: Typical traces of the three components of the GRF and of the velocity of the CoM relative an inertial reference frame attached to the lab. For both radii of curvature, variables were recorded over entire trials on one subject (body mass: 65.1 kg, height: 1.78 m) running at 14 km h-1. From top to bottom: Vertical component of the GRF (Fz) and of the velocity (vz), components of GRF in the transverse plane along the y- and the x-axis (respectively Fy and Fx). Further below, the two components of the horizontal velocities along the y-axis (vy) and the x-axis (vx). The dashed vertical lines drawn over Fz correspond to the time of touchdown of the inner leg (red) and of the outer leg (blue) and of the time of take-off of both legs (green).
Fig 2
Fig 2. Force plate disposition and experimental considerations.
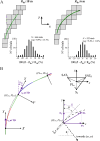
Panel A: Disposition of the 16 (1x1 m) force plates for both the 18 m and 6 m radii of curvature. For both radii of curvature, the theoretical radius Rth (black line) is drawn over the diagram of the force platforms superimposed with the trajectory computed from radius R (green line). Note, R is obtained by fitting a circular curve through the points PLc. The frequency distributions of (R-Rth)/ Rth is shown beside this as a histogram. Panel B: The upper left diagram of the panel shows the position of PLc relative to the three markers glued on the skin of the subject (see Assessment of the movement of the CoM in the transverse plane, in the Methods section). The lower left diagram illustrates how the two angles δ and θ are computed (see Eqs 7 and 8). The left diagram illustrates how the referential O-X-Y-z is rotated at each foot contact (see Computation of the work, in the Methods section).
Fig 3
Fig 3. PLc oscillation around the circular fit and angle deviations.
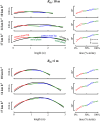
The left panels illustrate the typical traces of the oscillation of PLc over one stride around the circular fit R (black line), for the same subject as in Fig 1. In each panel, the circular path is rotated so that the cord of the arch defined by the first and last point of the stride is horizontal. The vertical scale is amplified to accentuate the oscillations around the curve. The right panels represent the temporal changes of the angles δ (continuous line) and θ (interrupted line) over the strides presented in the left panel. Colours are the same as in Fig 1.
Fig 4
Fig 4. Comparisons between running at 18 m, 6 m and on a straight line.
Panel A: Effect of running speed on the time of contact (tc) and aerial time (ta) of steps on of the inner (red) and outer (blue) while running a curve of 18 (left) and 6 m (right) radius. Panel B: Effect of speed on the difference between the "instantaneous" radius at touch down, rTD, and the radius described by the circular fit of the PLc trajectory, R. Panel C: The difference between the angles δ (continuous line) and θ (interrupted line) at take-off (subscript TD) and touch down (subscript TO). Panel D: The difference between δ and θ at take-off. In each panel, the continuous lines represent spline functions fitted on all the data.
Fig 5
Fig 5. Rotated referential forces and energies.
Panel A: The time-evolution of the three components of the GRF (Fz, FY and FX) recorded in the O-X-Y-z inertial reference frame during one step on the outer (blue) and inner leg (red) while running at 14 km –1 on a curve with an 18 m (left) and 6 m radii (right). The green line represents the average aerial phase for each trace. The thin lines are the individual traces recorded on the same subject than in Fig 1. The thick line is the average of all the steps. Panel B: Energy-time curves of the CoM on all the same steps than in panel A. Ez is the potential plus kinetic energy of the CoM due to its vertical movements, EX and EY are the kinetic energies due to the velocity of the CoM along the X- and the Y-axis, respectively. Ecom is the total energy of the CoM (Ecom = Ez+ EX+EY). In both panels, time is expressed as a percentage of the step period.
Fig 6
Fig 6. %Recovery and work done to sustain the centre of mass movements.
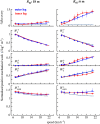
%Recovery and work done on the inner (red) and outer (blue) limb for both radii of curvature as a function of speed. The upper panels present energy recovered through the transduction between EX, EY and Ez. The four panels below present the mass-specific positive work normalised per unit distance. From top to bottom row 2 presents the work necessary to sustain the movements of the CoM respectively in the vertical direction (Wz), row 3: Along the X-axis (WX) and row 4: Along the Y-axis (WY). The bottom panel represents the work done to sustain the movements of the CoM relative to the surroundings. The interrupted lines represent spline fits for the left foot during SL. Other indications are as in Fig 4.

References

    1. Willems PA, Cavagna GA, Heglund NC. External, internal and total work in human locomotion. III. Energy Changes of the centre of mass as a function of speed and body size in birds and mammals. Journal of Experimental Biology. 1995;198:379–93. - PubMed
    1. Cavagna GA, Willems PA, Franzetti P, Detrembleur C. The two power limits conditioning step frequency in human running. The Journal of Physiology. 1991. Jun 1;437(1):95–108. doi: 10.1113/jphysiol.1991.sp018586 - DOI - PMC - PubMed
    1. Mesquita RM, Willems PA, Catavitello G, Dewolf AH. Kinematics and mechanical changes with step frequency at different running speeds. European Journal of Applied Physiology. 2023;In press. doi: 10.1007/s00421-023-05303-3 - DOI - PubMed
    1. Alexander RM. Stability and Manoeuvrability of Terrestrial Vertebrates. Integrative and Comparative Biology. 2002. Feb 1;42(1):158–64. doi: 10.1093/icb/42.1.158 - DOI - PubMed
    1. Wilson JW, Mills MGL, Wilson RP, Peters G, Mills MEJ, Speakman JR, et al. Cheetahs, Acinonyx jubatus, balance turn capacity with pace when chasing prey. Biol Lett. 2013. Oct 23;9(5):20130620. doi: 10.1098/rsbl.2013.0620 - DOI - PMC - PubMed